Notebookcheck Logo

Debut del rendimiento de la Radeon RX 7700S: Análisis del Framework Laptop 16
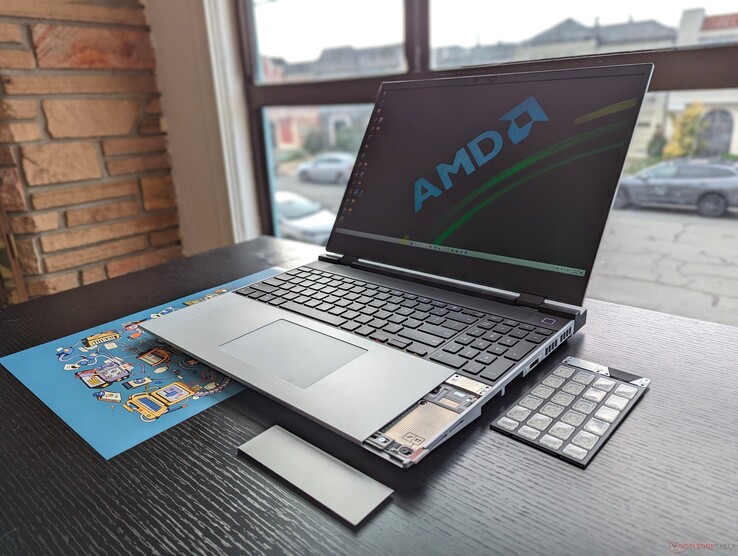
Gráficos discretos Radeon desmontables.

Puede que el nombre sea genérico, pero el diseño es cualquier cosa menos eso. El respetuoso con el medio ambiente Laptop 16 toma todo lo bueno del Laptop 13.5 y lo sube de nivel con componentes aún más actualizables y personalizables, incluida una GPU Radeon RDNA 3 extraíble.
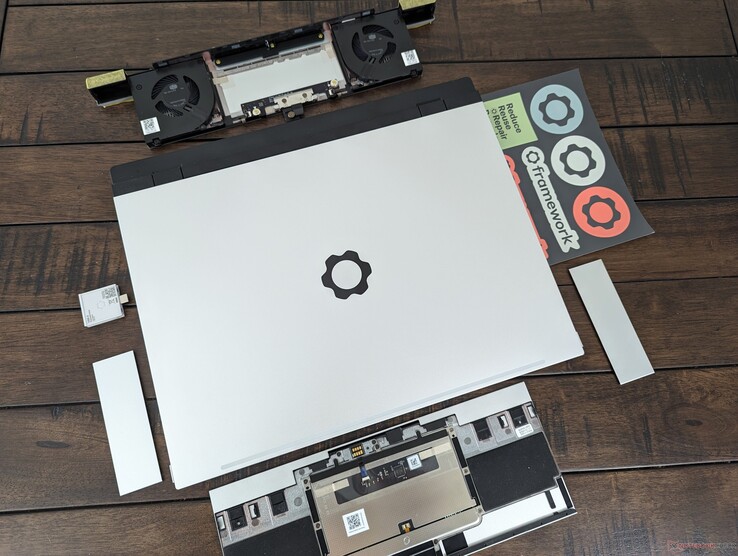
Marco Portátil 16 con el módulo de cubierta del reposamanos retirado

Revelado en la GDC 2023el Framework Laptop 16 amplía los aspectos de reparabilidad y sostenibilidad del Framework 13.5 pero en un formato más grande de 16 pulgadas. Sin embargo, es mucho más que una simple versión más grande, ya que el mayor tamaño de la pantalla ha permitido aún más personalización y piezas opcionales que el diseño original de 13,5 pulgadas, incluyendo gráficos discretos extraíbles, espaciadores para el panel táctil, LED y teclado numérico.

Nuestra unidad de análisis es la configuración de gama más alta con el Ryzen 9 7940HS y la Radeon RX 7700S de 100 W por unos 2400 dólares al por menor. Las SKUs de gama más baja se envían con el Ryzen 7 7840HS y sin GPU discreta, pero todas las opciones vienen con la misma pantalla IPS 1600p 165 Hz VRR. Los kits barebone y DIY también están disponibles al igual que para el portátil 13.5. Framework afirma que la compañía trabajó estrechamente con AMD en el diseño del Laptop 16, lo que implica que no deberíamos contener la respiración por ninguna opción Intel-Nvidia a corto plazo.

Aunque el Laptop 16 es totalmente capaz de jugar por sus especificaciones, Framework está teniendo cuidado de evitar llamarlo portátil para juegos por miedo a encasillar el modelo. En su lugar, el Laptop 16 se dirige a un público más amplio formado por usuarios multimedia, creadores de contenidos y jugadores por igual. Entre los competidores del Laptop 16 se incluyen portátiles de 16 pulgadas de fabricantes más tradicionales como el HP Spectre x360 16el próximo Dell XPS 16 Lenovo ThinkPad Z16o el Apple MacBook Pro 16.

Más revisiones del Marco:

Framework Laptop 16 (Laptop Serie)
Procesador
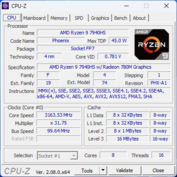
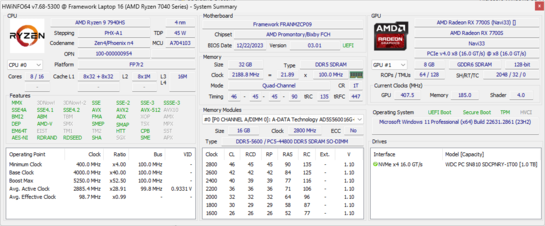
AMD Ryzen 9 7940HS 8 x 4 - 5.2 GHz, 79 W PL2 / Short Burst, 54 W PL1 / Sustained, Phoenix-HS (Zen 4)
Adaptador gráfico
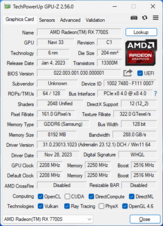
AMD Radeon RX 7700S - 8 GB VRAM, Memoría: 912 MHz, 100 W TDP, GDDR6, 23.20.24.15
Memoría
32 GB 
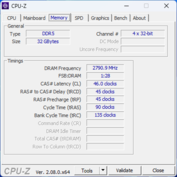
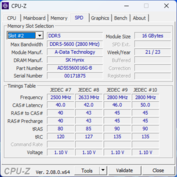
, ADATA, DDR5-5600, Dual-Channel, 46-45-45-90
pantalla
16.00 pulgadas 16:10, 2560 x 1600 pixels 189 PPI, lustroso: no, 165 Hz
Placa base
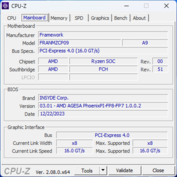
AMD Promontory/Bixby FCH
Disco duro
WDC PC SN810 1TB, 1024 GB 
Tarjeta de sonido
AMD Zen - Audio Processor - HD Audio Controller
Conexiones
4 USB 3.1 Gen2, 2 USB 4.0 40 Gbps, USB-C Power Delivery (PD), 3 DisplayPort, 1 Lector de Huellas Digitales
Equipamento de red
MediaTek Wi-Fi 6E MT7922 160MHz Wireless LAN Card (a/b/g/n = Wi-Fi 4/ac = Wi-Fi 5/ax = Wi-Fi 6/ Wi-Fi 6E 6 GHz), Bluetooth 5.1
Tamaño
Alto x ancho x profundidad (en mm): 20.95 x 356.58 x 290.2
Battería
85 Wh Litio-Polimero
Sistema Operativo
Microsoft Windows 11 Pro
Cámara
Webcam: 1080p30
Cámara principal: 2 MPix
Características adicionales
Altavoces: Stereo, Teclado: Chiclet, Luz de Teclado: si, Expansion Cards, dGPU bay, Numpad, 12 Meses Garantía
Peso
2.418 kg, Suministro de Electricidad: 487 g
Precio
2400 USD
Nota: El fabricante puede utilizar componentes de diferentes proveedores, incluidos paneles de visualización, unidades o lápices de memoria con especificaciones similares.


Posibles contendientes en la comparación

Valoración
Fecha
Modelo
Peso
Altura
Tamaño
Resolución
Precio
89.6 %
v7 (old)
01/2024
Framework Laptop 16
R9 7940HS, Radeon RX 7700S
2.4 kg20.95 mm16.00"2560x1600
88.1 %
v7 (old)
12/2023
MSI Prestige 16 B1MG-001US
Ultra 7 155H, Arc 8-Core
1.6 kg19.1 mm16.00"2560x1600
88.6 %
v7 (old)
12/2023
Lenovo ThinkPad Z16 Gen 2
R9 PRO 7940HS, Radeon RX 6550M
1.8 kg15.8 mm16.00"3840x2400
93.2 %
v7 (old)
11/2023
Apple MacBook Pro 16 2023 M3 Max
Apple M3 Max 16-Core, M3 Max 40-Core GPU
2.1 kg16.9 mm16.00"3456x2234
87.1 %
v7 (old)
08/2023
Dell Inspiron 16 Plus 7630
i7-13700H, NVIDIA GeForce RTX 4060 Laptop GPU
2.2 kg19.95 mm16.00"2560x1600
87.3 %
v7 (old)
01/2023
HP Spectre x360 2-in-1 16-f1075ng
i7-12700H, Iris Xe G7 96EUs
2 kg19.9 mm16.00"3072x1920

Maletín - Cuando la forma se une a la función

El chasis es una evolución del más pequeño Portátil de 13,5. Mientras que los materiales son en gran parte los mismos entre ellos, el Laptop 16 se siente más grueso y más rígido alrededor de la base para una mejor primera impresión incluso después de tener en cuenta todas las nuevas piezas desmontables. Al intentar torcer la base o alabear el teclado no se produciría casi ningún crujido y sólo distorsiones mínimas, lo que ya son enormes mejoras con respecto al más frágil Laptop 13.5.

Desafortunadamente, un atributo no ha mejorado y es la tapa. Al igual que en el Laptop 13.5, la tapa del Laptop 16 es más susceptible a torcerse y alabearse en comparación con otras alternativas de 16 pulgadas como el HP Spectre x360 16 o el Blade 16. Las bisagras pueden ser decentes, pero la tapa se siente como el aspecto más débil del chasis una vez más.

Las dimensiones y el peso son diferentes dependiendo de si se acopla el módulo dGPU o si, en su lugar, se acopla el módulo de cubierta estándar más pequeño. De hecho, el Laptop 16 se vuelve notablemente más pesado y largo que otros portátiles multimedia de 16 pulgadas cuando lleva acoplado el módulo dGPU. Su diseño ya es bastante largo con 270 mm sólo con el módulo de cubierta estándar. Si la portabilidad es una preocupación, sin duda puede hacerlo mejor con portátiles más tradicionales de Apple o la Serie LG Gram.

Con el módulo de cubierta de la bahía de expansión estándar356.58 x 270,0 x 17,95 mm2.1 kg
Con módulo de bahía gráfica discreta356.58 x 290,2 x 20,95 mm2.4 kg


Materiales de aleación de magnesio y aluminio similares a los del portátil 13.5 para una textura y aspecto similares
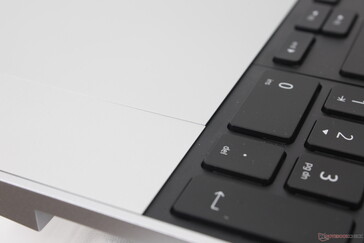
Los módulos extraíbles no siempre se alinean perfectamente con el resto del portátil, lo que puede hacer que el chasis parezca barato
La tapa se abre hasta un ángulo máximo de 150 grados, mientras que la tapa del portátil 13.5 puede abrirse hasta los 180 grados
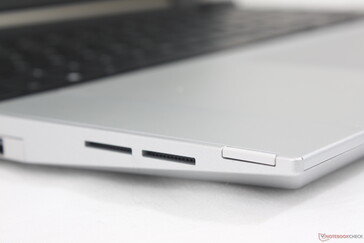
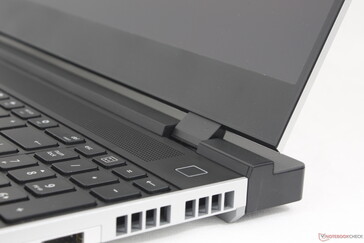
Botón de encendido con huella dactilar
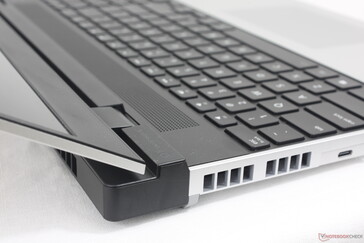
El módulo dGPU trasero (negro) añade un peso y una longitud notables al portátil
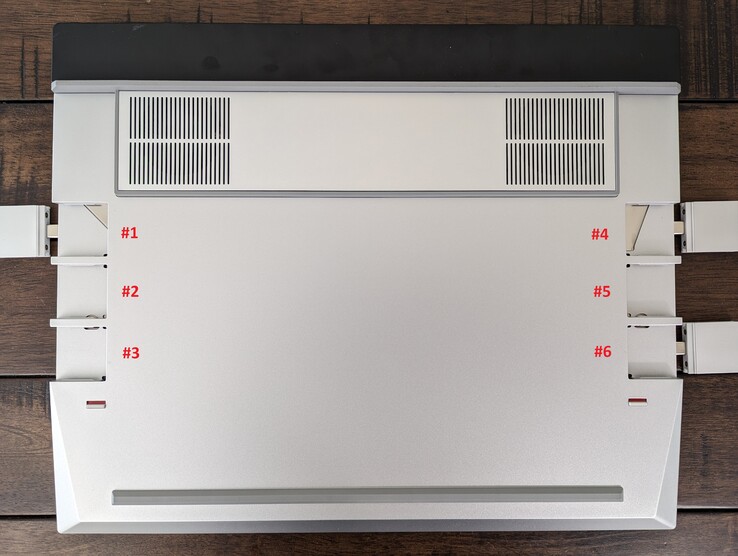
El sistema admite hasta 6 tarjetas de expansión, frente a las 4 del portátil 13,5

Comparación de tamaños

358 mm 245.3 mm 19.9 mm 2 kg356.58 mm 290.2 mm 20.95 mm 2.4 kg358 mm 258 mm 19.1 mm 1.6 kg356.78 mm 251.9 mm 19.95 mm 2.2 kg355.7 mm 248.1 mm 16.9 mm 2.1 kg354.4 mm 237.4 mm 15.8 mm 1.8 kg297 mm 210 mm 1 mm 5.7 g

Conectividad - Seis puertos personalizables

Se trata del único portátil de los últimos tiempos que integra un total de seis puertos USB-C y nada más, ni siquiera una toma de audio o un bloqueo Kensington. Los seis puertos son compatibles con la gama actual de tarjetas de expansión de Framework, por lo que funcionan igual que en el portátil 13.5.

Es importante tener en cuenta que los seis puertos USB-C no son iguales, como muestra nuestra tabla de abajo. Sólo dos son USB4, tres son compatibles con DP y cuatro son compatibles con el adaptador de CA USB-C. No hay indicadores visuales para diferenciar los puertos.

Ranura de tarjeta de expansión #Interfaz¿Compatible con DisplayPort?240 W ¿Compatible con carga USB-C?USB-A ¿Alto consumo de energía?
1USB4YYY
2USB 3.2NYN
3USB 3.2NNN
4USB4YYY
5USB 3.2YYN
6USB 3.2NNN

Además, sigue sin haber tarjetas de expansión para lectores SD de tamaño completo, WAN o RJ-45. Si estos puertos son importantes para usted, tendrá que buscar adaptadores USB o estaciones de acoplamiento.

Las seis ranuras USB-C no son idénticas en cuanto a características

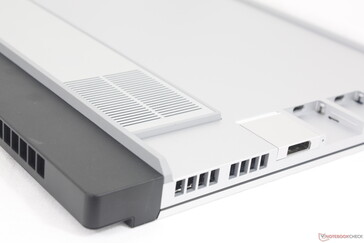
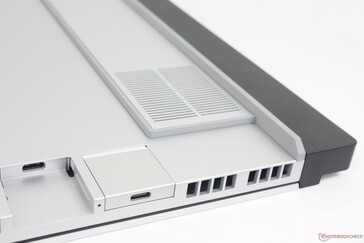
Un séptimo puerto USB-C a lo largo del borde trasero queda disponible si se instala el módulo de GPU discreta. Este puerto es compatible con DP pero no con el adaptador de CA.

Frontal: Sin puertos
Derecha: 3x USB-C (USB4, USB 3.2, USB 3.2)
Trasera: 1x USB-C 3.2
Izquierda: 3x USB-C (USB4, USB 3.2, USB 3.2)

Lector de tarjetas SD

El Laptop 16 utiliza el mismo lector de tarjetas de expansión MicroSD que se encuentra en el Laptop 13.5 para velocidades de lectura y escritura similares. Con sólo unos 80 MB/s, el rendimiento es mucho más lento que el de los lectores de tarjetas de modelos de la competencia como el ThinkPad Z16 Gen 2 o el MacBook Pro 16.

No tenemos acceso a la tarjeta de expansión del lector de tarjetas SD de nuestro Portátil 16, por lo que a continuación ofrecemos los datos del Portátil 13.5 en su lugar.

SD Card Reader
average JPG Copy Test (av. of 3 runs)
MSI Prestige 16 B1MG-001US
Intel Core Ultra 7 155H (Toshiba Exceria Pro SDXC 64 GB UHS-II)
182.5 MB/s
Apple MacBook Pro 16 2023 M3 Max
Apple M3 Max 16-Core (Angelbird AV Pro V60)
163.3 MB/s
Lenovo ThinkPad Z16 Gen 2
AMD Ryzen 9 PRO 7940HS (Toshiba Exceria Pro SDXC 64 GB UHS-II)
144.2 MB/s
HP Spectre x360 2-in-1 16-f1075ng
Intel Core i7-12700H
136 MB/s
Framework Laptop 13.5
Intel Core i7-1165G7 (AV Pro UHS-II V60)
73.8 MB/s
Dell Inspiron 16 Plus 7630
Intel Core i7-13700H (AV Pro SD microSD 128 GB V60)
19.3 MB/s
maximum AS SSD Seq Read Test (1GB)
Lenovo ThinkPad Z16 Gen 2
AMD Ryzen 9 PRO 7940HS (Toshiba Exceria Pro SDXC 64 GB UHS-II)
237.2 MB/s
Apple MacBook Pro 16 2023 M3 Max
Apple M3 Max 16-Core (Angelbird AV Pro V60)
226.7 MB/s
MSI Prestige 16 B1MG-001US
Intel Core Ultra 7 155H (Toshiba Exceria Pro SDXC 64 GB UHS-II)
221.2 MB/s
HP Spectre x360 2-in-1 16-f1075ng
Intel Core i7-12700H
161 MB/s
Framework Laptop 13.5
Intel Core i7-1165G7 (AV Pro UHS-II V60)
90.3 MB/s
Dell Inspiron 16 Plus 7630
Intel Core i7-13700H (AV Pro SD microSD 128 GB V60)
28.3 MB/s

Comunicación

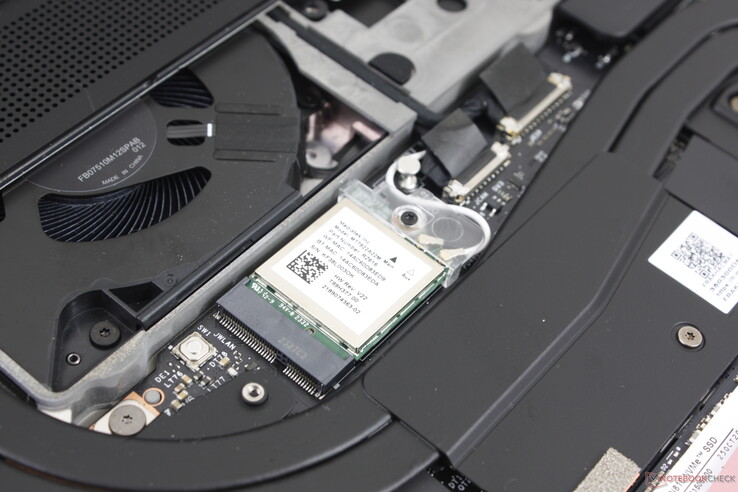
El Wi-Fi 6 y 6E lo proporciona un MediaTek MT7922 en lugar del habitual AX211, en consonancia con el diseño sin Intel del modelo. Experimentamos conexiones estables y fiables cuando lo emparejamos con nuestro router de prueba Asus AXE11000.

Lamentablemente, no es compatible con WAN.

Módulo WLAN extraíble
Networking
iperf3 transmit AXE11000
Apple MacBook Pro 16 2023 M3 Max
Broadcom 0x14E4, 0x4388 WiFi 6E AirPort
1726 (1684min - 1758max) MBit/s +81%
Lenovo ThinkPad Z16 Gen 2
MediaTek Wi-Fi 6E MT7922 160MHz Wireless LAN Card
1326 (1246min - 1393max) MBit/s +39%
Dell Inspiron 16 Plus 7630
Intel Wi-Fi 6E AX211
1261 (1137min - 1385max) MBit/s +32%
MSI Prestige 16 B1MG-001US
Intel Killer Wi-Fi 7 BE1750W 320 MHz (BE200NGW)
1144 (654min - 1349max) MBit/s +20%
HP Spectre x360 2-in-1 16-f1075ng
Intel Wi-Fi 6E AX211
964 (863min - 1044max) MBit/s +1%
Framework Laptop 16
MediaTek Wi-Fi 6E MT7922 160MHz Wireless LAN Card
956 (920min - 1017max) MBit/s
iperf3 receive AXE11000
Apple MacBook Pro 16 2023 M3 Max
Broadcom 0x14E4, 0x4388 WiFi 6E AirPort
1752 (1702min - 1776max) MBit/s +99%
HP Spectre x360 2-in-1 16-f1075ng
Intel Wi-Fi 6E AX211
1532 (1427min - 1569max) MBit/s +74%
Lenovo ThinkPad Z16 Gen 2
MediaTek Wi-Fi 6E MT7922 160MHz Wireless LAN Card
1439 (1253min - 1548max) MBit/s +64%
MSI Prestige 16 B1MG-001US
Intel Killer Wi-Fi 7 BE1750W 320 MHz (BE200NGW)
1317 (915min - 1453max) MBit/s +50%
Dell Inspiron 16 Plus 7630
Intel Wi-Fi 6E AX211
1184 (1047min - 1237max) MBit/s +35%
Framework Laptop 16
MediaTek Wi-Fi 6E MT7922 160MHz Wireless LAN Card
880 (846min - 906max) MBit/s
iperf3 transmit AXE11000 6GHz
HP Spectre x360 2-in-1 16-f1075ng
Intel Wi-Fi 6E AX211
1623 (1482min - 1674max) MBit/s +61%
Dell Inspiron 16 Plus 7630
Intel Wi-Fi 6E AX211
1524 (1318min - 1580max) MBit/s +51%
MSI Prestige 16 B1MG-001US
Intel Killer Wi-Fi 7 BE1750W 320 MHz (BE200NGW)
1210 (747min - 1295max) MBit/s +20%
Lenovo ThinkPad Z16 Gen 2
MediaTek Wi-Fi 6E MT7922 160MHz Wireless LAN Card
1041 (952min - 1137max) MBit/s +3%
Framework Laptop 16
MediaTek Wi-Fi 6E MT7922 160MHz Wireless LAN Card
1010 (930min - 1099max) MBit/s
iperf3 receive AXE11000 6GHz
HP Spectre x360 2-in-1 16-f1075ng
Intel Wi-Fi 6E AX211
1536 (1436min - 1555max) MBit/s +37%
Lenovo ThinkPad Z16 Gen 2
MediaTek Wi-Fi 6E MT7922 160MHz Wireless LAN Card
1387 (1348min - 1433max) MBit/s +24%
Dell Inspiron 16 Plus 7630
Intel Wi-Fi 6E AX211
1229 (1099min - 1323max) MBit/s +9%
Framework Laptop 16
MediaTek Wi-Fi 6E MT7922 160MHz Wireless LAN Card
1123 (1095min - 1152max) MBit/s
MSI Prestige 16 B1MG-001US
Intel Killer Wi-Fi 7 BE1750W 320 MHz (BE200NGW)
1111 (866min - 1323max) MBit/s -1%
0501001502002503003504004505005506006507007508008509009501000105011001150Tooltip
Framework Laptop 16; iperf3 transmit AXE11000 6GHz; iperf 3.1.3: Ø1010 (930-1099)
Framework Laptop 16; iperf3 receive AXE11000 6GHz; iperf 3.1.3: Ø1123 (1095-1152)

Cámara web

Una webcam de 2 MP con IR y obturador manual viene de serie mientras que competidores como las series HP Spectre o Elite llevan más de un año comercializándose con webcams de 5 MP o superiores. Esperemos que Framework pueda ofrecer opciones de webcam mejoradas en el futuro.
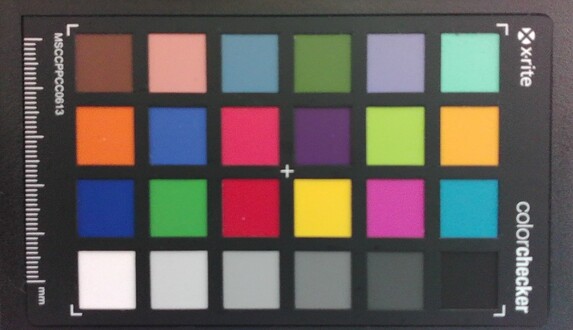
ColorChecker
6.1 ∆E
8.2 ∆E
12.3 ∆E
11.8 ∆E
12.5 ∆E
10.3 ∆E
8.6 ∆E
5.2 ∆E
7.6 ∆E
1.2 ∆E
7.3 ∆E
7.3 ∆E
3.3 ∆E
6.8 ∆E
5 ∆E
3.4 ∆E
5.2 ∆E
11.6 ∆E
5.3 ∆E
2 ∆E
5.5 ∆E
6.4 ∆E
4.8 ∆E
1.7 ∆E
ColorChecker Framework Laptop 16: 6.64 ∆E min: 1.24 - max: 12.45 ∆E

Accesorios - Más opciones que el cinturón utilitario de Batman

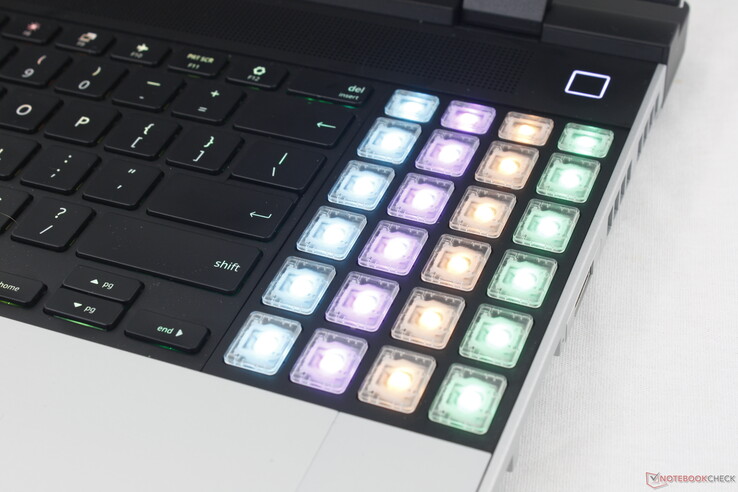
A diferencia del típico portátil, el Laptop 16 se define posiblemente por sus accesorios. Los más notables incluyen el módulo gráfico discreto trasero extraíble, los módulos LED Matrix y el módulo RGB Macropad. Por el momento sólo hay una dGPU para elegir, pero es probable que en el futuro haya más opciones disponibles.

El Macropad RGB es una opción secundaria al teclado numérico estándar. Sus entradas son exactamente las mismas que las de un teclado numérico normal, pero las teclas son visualmente diferentes, ya que son transparentes y con retroiluminación RGB, mientras que el teclado numérico estándar está impreso y sólo tiene retroiluminación blanca. Las teclas transparentes y coloridas del Macropad pueden resultar atractivas para los usuarios hardcore o los jugadores a los que les gusta personalizar las entradas de sus teclas.

El macropad RGB funciona de forma idéntica al teclado numérico normal

En cuanto a los módulos LED Matrix, éstos sustituyen a los separadores normales y constan de numerosos LED en una rejilla similar a un píxel que puede programarse para mostrar los niveles de duración de la batería, textos desplazables, notificaciones o un reloj. Los módulos LED Matrix no nos fueron enviados para su revisión, por lo que no los hemos probado personalmente.

Los usuarios que no deseen los módulos dGPU o LED Matrix pueden instalar cubiertas de placa estándar en sus respectivos lugares. Estas cubiertas se envían con todas las configuraciones del portátil 16.

Más allá de los accesorios, la mayoría de las piezas internas son reemplazables y pueden adquirirse individualmente al fabricante, incluida la placa base, al igual que en el Marco 13.5.

Mantenimiento

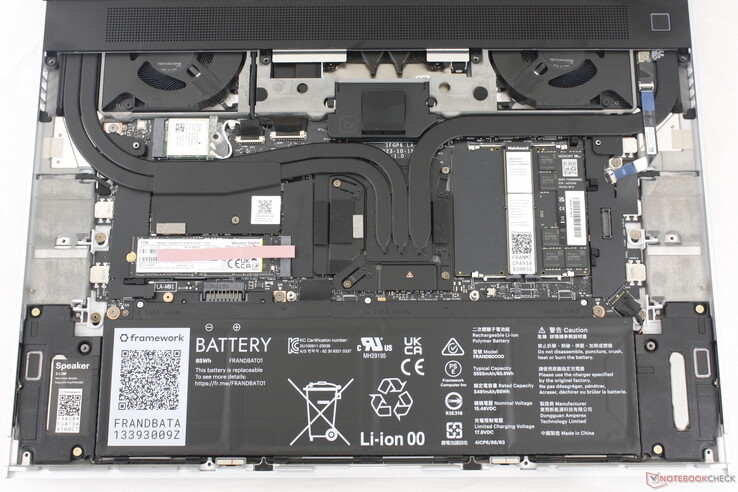
Acceder a la placa base es más complicado de lo habitual. Mientras que la mayoría de los demás portátiles sólo requieren retirar el panel inferior, el Laptop 16 requiere retirar el teclado, el clickpad, un cable plano, 15 tornillos Torx y una placa central metálica para revelar las entrañas. No es difícil ni mucho menos, pero el proceso es ligeramente más largo en comparación con algo como un ThinkPad o EliteBook tradicional.

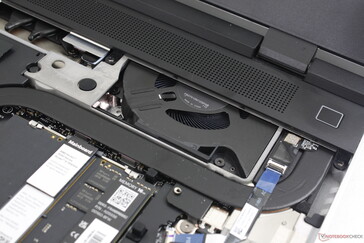
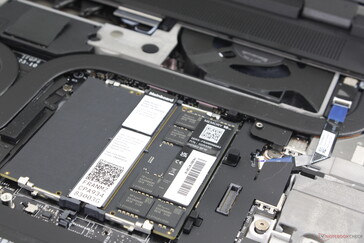
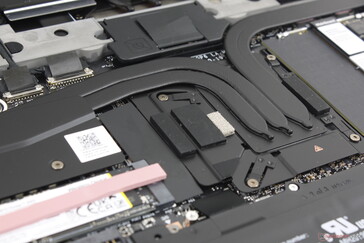
Portátil 16 con el teclado, el clickpad y la placa central desmontados. Observe los códigos QR en la mayoría de los componentes para facilitar la sustitución de piezas

Afortunadamente, Framework ofrece algunas de las guías de reparación más detalladas y fáciles de seguir que hemos visto de cualquier fabricante de portátiles para que el mantenimiento sea pan comido. Recomendamos encarecidamente consultar la extensa página de soporte oficial https://frame.work/laptop-16-support#customize-your-laptopque cubre todo desde sencillas actualizaciones de RAM y SSD hasta sustituciones de la placa base e instalación de módulos dGPU. No necesitamos reimprimir todo el proceso de mantenimiento, pero los procedimientos tienen una curva de aprendizaje ligeramente superior a los del portátil 13.5 debido a las complejidades de la nueva dGPU extraíble y los módulos de entrada más grandes.

Aunque muchos de los módulos son magnéticos, sigue siendo necesario un destornillador para instalar la dGPU trasera y algunos módulos deben instalarse en un orden determinado. El módulo trasero en particular no es plug-and-play ya que el sistema debe estar apagado y el teclado y el clickpad deben ser retirados primero. La buena noticia es que sólo tiene que desmontar y volver a montar el sistema una vez antes de que los procedimientos de mantenimiento se conviertan en una segunda naturaleza. Framework incluso fomenta esto enviando el teclado y el clickpad desmontados, lo que obliga al usuario a aprender cómo funcionan algunos de los módulos antes de encender el portátil por primera vez.

El uso de imanes y pestillos para los módulos del panel táctil es un enfoque intuitivo del mantenimiento. Esperamos ver esto ampliado hasta el punto en que todos los módulos y actualizaciones puedan realizarse sin herramientas.

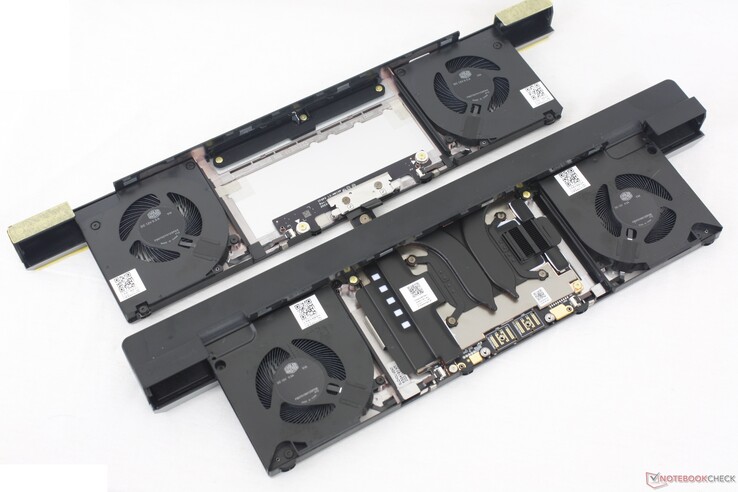
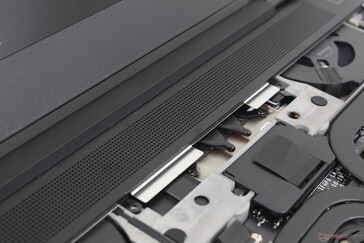
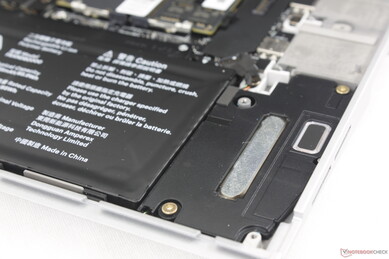
Módulo trasero de la dGPU Radeon 7700S (abajo) junto al módulo trasero estándar (arriba). Los ventiladores son ligeramente más gruesos en el módulo dGPU. Siempre debe insertarse un módulo

Garantía

Si se adquiere en EE.UU., se aplica la garantía limitada estándar del fabricante de un año. La protección cubre el portátil además de sus piezas y módulos.

Dispositivos de entrada: extraíbles, sustituibles y reorganizables

Teclado

Las teclas RGB por tecla tienen 1,5 mm de recorrido, lo que es común entre la mayoría de los Ultrabooks. La experiencia de escritura no se siente obstaculizada por el aspecto extraíble del teclado que es exactamente lo que nos gusta ver. Los usuarios que prefieran portátiles con un recorrido de teclas más profundo y firme deberían probar el HP Spectre.

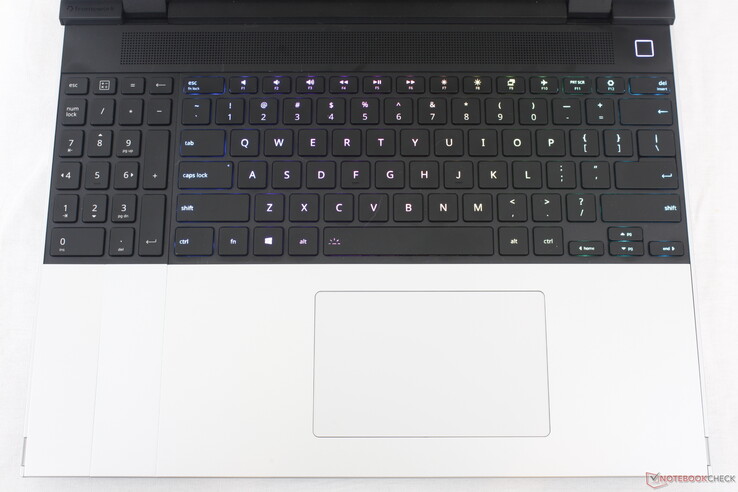
Curiosamente, las teclas del teclado numérico sólo tienen retroiluminación blanca, mientras que las teclas QWERTY principales tienen iluminación RGB. Los usuarios que prefieran no tener numpad en absoluto pueden en su lugar instalar espaciadores para centrar el teclado QWERTY o instalar un macropad RGB con teclas personalizables. La posibilidad de reposicionar o centrar el teclado a su gusto no es algo que hayamos visto en ningún otro portátil. El teclado numérico, por ejemplo, puede instalarse a la izquierda o a la derecha del teclado QWERTY para algunas configuraciones realmente interesantes.

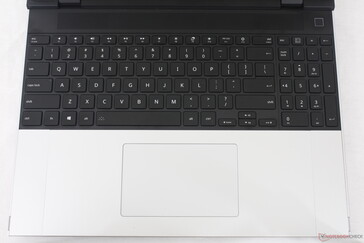
Los módulos del teclado y del teclado numérico pueden colocarse en posiciones inusuales y el sistema seguirá reconociéndolos y funcionando con normalidad. Hay espaciadores disponibles para los usuarios que no deseen ningún teclado numérico

Panel táctil

Con 12,3 x 7,7 cm, el clickpad de Precision es más pequeño que el del MSI Prestige 16 (15 x 9 cm) y aproximadamente del mismo tamaño que el del Inspiron 16 Plus (11,5 x 8 cm). La tracción es suave en la superficie de cristal mate con sólo un poco de adherencia al deslizarse a velocidades más lentas para mejorar la precisión. El clic también se siente bien ya que la retroalimentación no es tan esponjosa como en el Prestige 16, pero el traqueteo es ligeramente más fuerte como resultado.

Un aspecto único del clickpad es que puede desplazarse a izquierda o derecha en el reposamuñecas dependiendo de cómo esté instalado, como muestran las imágenes de abajo. Se trata de una característica interesante para los usuarios que prefieran el clickpad descentrado.

Los módulos de teclado y clickpad son intercambiables en caliente a diferencia del módulo dGPU
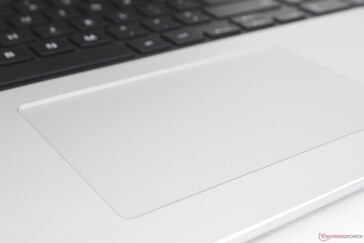
El clickpad de cristal es espacioso, pero una opción con botones de ratón dedicados sería aún mejor
La respuesta de las teclas es uniforme de esquina a esquina para una experiencia de tecleo cómoda
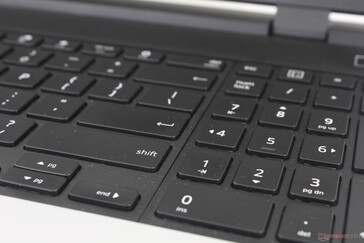
El teclado numérico y las teclas de flecha son más pequeñas que las teclas QWERTY principales

Pantalla - Lo sentimos amigos, no hay OLED

Sin absolutamente ninguna otra opción de pantalla para elegir en el momento de escribir esto, tenemos grandes expectativas para el único panel IPS que viene con cada configuración del Laptop 16. Afortunadamente, podemos decir con seguridad que Framework no ha escatimado en la pantalla en absoluto. El panel de 2560 x 1600 ofrece tiempos de respuesta rápidos, colores DCI-P3, una retroiluminación brillante, una relación de contraste relativamente alta e incluso una frecuencia de actualización variable de 165 Hz con compatibilidad con FreeSync. En consecuencia, el Laptop 16 es uno de los primeros portátiles que se comercializan con el panel BOE NE160QDM-NZ6 VRR.

Como panel IPS, sin embargo, no alcanza los mismos ratios de contraste en negro intenso ni los mismos tiempos de respuesta que una alternativa OLED típica como las del Asus VivoBook 16 de Asus. También carece de soporte HDR adecuado, que se está convirtiendo en una característica cada vez más común en los portátiles multimedia. Para un portátil que presume de ser actualizable por el usuario final, resulta extraño no ver aquí una segunda opción de pantalla. Aun así, sigue siendo una de las mejores pantallas IPS de 16 pulgadas que hemos visto tanto para edición como para juegos.

Sin opciones de cristal de borde a borde ni OLED
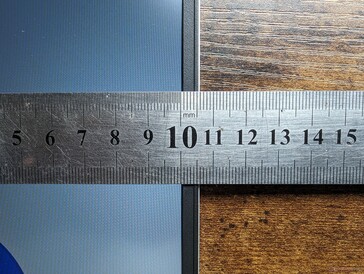
Biseles laterales estrechos con biseles superior e inferior más gruesos
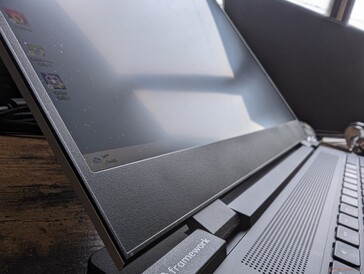
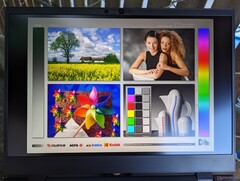
La granulosidad de la superposición mate es notable pero muy leve
Ligero sangrado irregular de la retroiluminación a lo largo de los bordes
527.7
cd/m²
506.9
cd/m²
500.2
cd/m²
479.1
cd/m²
504.8
cd/m²
459.5
cd/m²
485.7
cd/m²
504.4
cd/m²
442.4
cd/m²
Temperatura del cuarto
tested with X-Rite i1Pro 2
Máximo: 527.7 cd/m² (Nits) Médio: 490.1 cd/m² Minimum: 26.1 cd/m²
iluminación: 84 %
Brillo con batería: 504.8 cd/m²
Contraste: 1231:1 (Negro: 0.41 cd/m²)
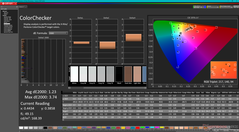
ΔE Color 1.23 | 0.5-29.43 Ø4.9, calibrated: 1.1
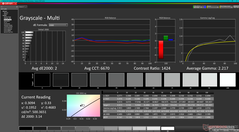
ΔE Greyscale 2 | 0.5-98 Ø5.2
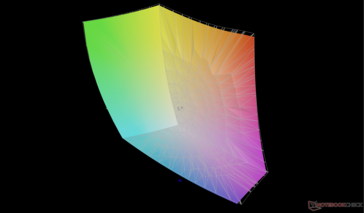
87% AdobeRGB 1998 (Argyll 2.2.0 3D)
99.7% sRGB (Argyll 2.2.0 3D)
97.7% Display P3 (Argyll 2.2.0 3D)
Gamma: 2.22
Framework Laptop 16
2560x1600, 16"
MSI Prestige 16 B1MG-001US
AU Optronics B160QAN03.R, IPS, 2560x1600, 16"
Lenovo ThinkPad Z16 Gen 2
Samsung ATNA60YV04-0, OLED, 3840x2400, 16"
Apple MacBook Pro 16 2023 M3 Max
Mini-LED, 3456x2234, 16"
Dell Inspiron 16 Plus 7630
LG Philips 160WQ2, IPS, 2560x1600, 16"
HP Spectre x360 2-in-1 16-f1075ng
AU Optronics AUO50A3, IPS, 3072x1920, 16"
Display
-1%
4%
2%
-15%
-11%
Display P3 Coverage
97.7
96.7
-1%
99.7
2%
99.2
2%
70.1
-28%
75.6
-23%
sRGB Coverage
99.7
99.8
0%
100
0%
99.6
0%
100.2
1%
AdobeRGB 1998 Coverage
87
84.6
-3%
96.7
11%
72.3
-17%
77.2
-11%
Response Times
-219%
85%
-322%
-127%
-202%
Response Time Grey 50% / Grey 80% *
14.6 ?(7.1, 7.5)
49.4 ?(22.6, 26.8)
-238%
1.86 ?(0.96, 0.9)
87%
66.9 ?(29.4, 37.5)
-358%
35 ?(15.7, 19.3)
-140%
52 ?(23, 29)
-256%
Response Time Black / White *
11.3 ?(6.1, 5.2)
33.9 ?(15.6, 18.3)
-200%
1.89 ?(0.89, 1)
83%
43.6 ?(13.6, 30)
-286%
24.2 ?(10.8, 13.4)
-114%
28 ?(14, 14)
-148%
PWM Frequency
60 ?(100)
14877
Screen
-70%
-6%
15%
-50%
-120%
Brightness middle
504.8
473.6
-6%
390.1
-23%
630
25%
299.4
-41%
425
-16%
Brightness
490
456
-7%
393
-20%
604
23%
290
-41%
406
-17%
Brightness Distribution
84
87
4%
97
15%
94
12%
92
10%
78
-7%
Black Level *
0.41
0.19
54%
0.21
49%
0.24
41%
Contrast
1231
2493
103%
1426
16%
1771
44%
Colorchecker dE 2000 *
1.23
5.9
-380%
1.41
-15%
1.2
2%
4.25
-246%
5.8
-372%
Colorchecker dE 2000 max. *
3.74
9.37
-151%
3.43
8%
2.8
25%
6.71
-79%
11.03
-195%
Colorchecker dE 2000 calibrated *
1.1
0.89
19%
0.52
53%
4.16
-278%
Greyscale dE 2000 *
2
7.3
-265%
2
-0%
1.9
5%
5.5
-175%
7.57
-279%
Gamma
2.22 99%
1.9 116%
2.22 99%
2.29 96%
2.35 94%
6600 0%
CCT
6670 97%
7260 90%
6324 103%
6812 95%
6368 102%
Media total (Programa/Opciones)
-97% / -77%
28% / 13%
-102% / -61%
-64% / -54%
-111% / -108%

* ... más pequeño es mejor

frente a sRGB
frente a sRGB
frente a P3
frente a P3

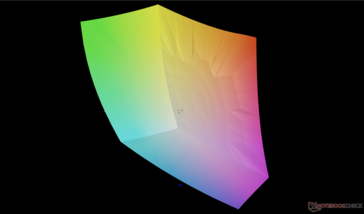
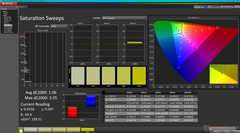
La pantalla viene bien calibrada respecto al estándar sRGB aunque el panel cubre el 100% de DCI-P3. Calibrar la pantalla nosotros mismos no mejoraría sus valores deltaE medios en márgenes apreciables, por lo que una calibración por parte del usuario final no será necesaria para la mayoría.

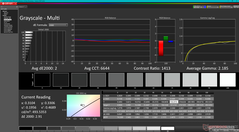
Escala de grises antes de la calibración
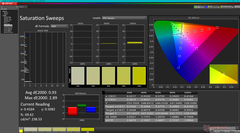
Barridos de saturación antes de la calibración
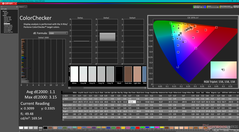
ColorChecker antes de la calibración
Escala de grises tras la calibración
Barridos de saturación tras la calibración
ColorChecker después de la calibración

Tiempos de respuesta del display

Los tiempos de respuesta del display muestran lo rápido que puede cambiar la pantalla de un color al siguiente. Tiempos lentos de respuesta pueden llevar a imágenes persistentes alrededor de objetos en movimiento o a displays borrosos. Particularmente los aficionados a los juegos 3D frenéticos deberían usar una pantalla con tiempos de respuesta rápidos.
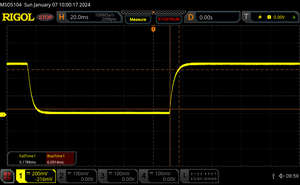
       Tiempo de respuesta de Negro a Blanco
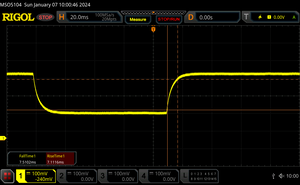
11.3 ms ... subida ↗ y bajada ↘ combinada↗ 6.1 ms subida
↘ 5.2 ms bajada
La pantalla mostró buenos tiempos de respuesta en nuestros tests pero podría ser demasiado lenta para los jugones competitivos.
En comparación, todos los dispositivos de prueba van de ##min### (mínimo) a 240 (máximo) ms. » 28 % de todos los dispositivos son mejores.
Esto quiere decir que el tiempo de respuesta medido es mejor que la media (20.9 ms) de todos los dispositivos testados.
       Tiempo de respuesta 50% Gris a 80% Gris
14.6 ms ... subida ↗ y bajada ↘ combinada↗ 7.1 ms subida
↘ 7.5 ms bajada
La pantalla mostró buenos tiempos de respuesta en nuestros tests pero podría ser demasiado lenta para los jugones competitivos.
En comparación, todos los dispositivos de prueba van de ##min### (mínimo) a 636 (máximo) ms. » 25 % de todos los dispositivos son mejores.
Esto quiere decir que el tiempo de respuesta medido es mejor que la media (32.8 ms) de todos los dispositivos testados.

Parpadeo de Pantalla / PWM (Pulse-Width Modulation)

Para atenuar el brillo de pantalla algunos portátiles están encendiendo y apagando la retroiluminación muy rápidamente. Esto se hace a una frecuencia que no debiera detectarse a simple vista. Si la frecuencia es demasiado lenta, la gente sensible podría experimentar problemas visuales, dolores de cabeza e incluso ver parpadeos.
Parpadeo de Pantalla / PWM no detectado

Comparación: 53 % de todos los dispositivos testados no usaron PWM para atenuar el display. Si se usó, medimos una media de 8684 (mínimo: 5 - máxmo: 343500) Hz.

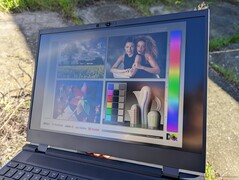
Con 500 nits, la pantalla es más brillante que la de muchos otros portátiles multimedia, incluidos incluso los paneles OLED del ThinkPad Z16 Gen 2 o el MSI Stealth 16. El alto brillo y el panel mate hacen que la pantalla sea más fácil de ver en condiciones exteriores.

Al aire libre bajo la luz del sol
Al aire libre y a la sombra
Al aire libre bajo la luz del sol
Amplios ángulos de visión IPS

Rendimiento - No necesita Intel ni Nvidia


Condiciones de prueba

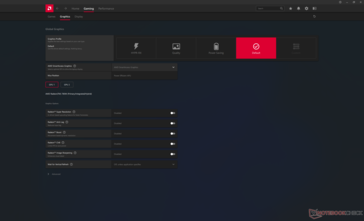
Pusimos Windows en modo Rendimiento y AMD Adrenalin en Predeterminado antes de ejecutar los puntos de referencia que se muestran a continuación. SmartAccess Graphics es la solución MUX de AMD para alternar automáticamente entre la iGPU y la dGPU en función de la aplicación. El problema es que, a diferencia de lo que ocurre en los portátiles equipados con GeForce, SmartAccess Graphics no ofrece un modo "sólo dGPU" o "sólo iGPU", por lo que la experiencia gráfica depende totalmente de la conmutación automática. El sistema debe congelarse durante un par de segundos cada vez que detecta una aplicación que consume mucha GPU, lo que puede resultar molesto cuando se realizan varias tareas a la vez entre distintas ventanas. La implementación de un modo "dGPU-only" habría solucionado este problema.

Ajustes AMD MUX
Ajustes AMD MUX
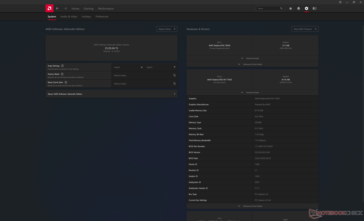
El software Adrenalin muestra las Radeon 780M y 7700S

Procesador

El Ryzen 9 7940HS se encuentra habitualmente en portátiles multimedia o para juegos rápidos como el Asus ROG Zephyrus G14 o TUF Gaming A17. Compite directamente con el 13º gen Core i7-13700H por lo que ambos procesadores son aproximadamente comparables.

Marco ofrece el Ryzen 7 7840HS en configuraciones inferiores del Laptop 16. Basándonos en nuestra experiencia con el Lenovo Legion Slim 7 16APH8sin embargo, el Ryzen 7 7840HS está esencialmente codo con codo con el Ryzen 9 7940HS a pesar de lo que sus diferencias de precio y convención de nomenclatura puedan sugerir. Si no necesita ese 5 por ciento extra de rendimiento del Ryzen 9, entonces puede ahorrarse cientos de dólares decantándose por la opción Ryzen 7.

Es una lástima que Framework no ofrezca el Ryzen 9 Pro 7940HS que habría hecho el portátil 16 más atractivo para los profesionales.

Cinebench R15 Multi Loop

017034051068085010201190136015301700187020402210238025502720289030603230Tooltip
Framework Laptop 16 AMD Ryzen 9 7940HS: Ø2617 (2587.82-2652.52)
MSI Prestige 16 B1MG-001US Intel Core Ultra 7 155H: Ø2289 (2208.24-2361.97)
Lenovo ThinkPad Z16 Gen 2 AMD Ryzen 9 PRO 7940HS: Ø2620 (2534.21-2717.95)
Apple MacBook Pro 16 2023 M3 Max Apple M3 Max 16-Core: Ø3354 (3260.25-3391.27)
Dell Inspiron 16 Plus 7630 Intel Core i7-13700H: Ø2049 (1806.77-2421.45)
HP Spectre x360 2-in-1 16-f1075ng Intel Core i7-12700H: Ø1638 (1589.13-2080.04)
CPU Performance Rating: Percent
Cinebench R23: Multi Core | Single Core
Cinebench R20: CPU (Multi Core) | CPU (Single Core)
Cinebench R15: CPU Multi 64Bit | CPU Single 64Bit
Blender: v2.79 BMW27 CPU
7-Zip 18.03: 7z b 4 | 7z b 4 -mmt1
Geekbench 5.5: Multi-Core | Single-Core
HWBOT x265 Benchmark v2.2: 4k Preset
LibreOffice : 20 Documents To PDF
R Benchmark 2.5: Overall mean
CPU Performance Rating
Asus Zephyrus Duo 16 GX650PY-NM006W
AMD Ryzen 9 7945HX
83.9 pt
Asus Vivobook Pro 16X K6604JV-MX016W
Intel Core i9-13980HX
74.8 pt
Alienware m16 R1 AMD
AMD Ryzen 9 7845HX
74.7 pt
Apple MacBook Pro 16 2023 M3 Max -5!
Apple M3 Max 16-Core
73 pt
Lenovo Legion Pro 5 16ARX8
AMD Ryzen 7 7745HX
64.7 pt
Medio AMD Ryzen 9 7940HS
 
60.4 pt
Framework Laptop 16
AMD Ryzen 9 7940HS
59.5 pt
Lenovo ThinkPad Z16 Gen 2
AMD Ryzen 9 PRO 7940HS
59.2 pt
MSI Stealth 16 Mercedes-AMG Motorsport A13VG
Intel Core i9-13900H
58.5 pt
Dell Inspiron 16 Plus 7630
Intel Core i7-13700H
56.4 pt
Lenovo Legion Slim 7 16APH8
AMD Ryzen 7 7840HS
56.3 pt
MSI Prestige 16 B1MG-001US
Intel Core Ultra 7 155H
53.7 pt
HP Spectre x360 2-in-1 16-f1075ng
Intel Core i7-12700H
49.9 pt
Acer Swift Edge SFE16-42-R1GM
AMD Ryzen 7 7735U
40.6 pt
Cinebench R23 / Multi Core
Asus Zephyrus Duo 16 GX650PY-NM006W
AMD Ryzen 9 7945HX
34521 (32987.6min - 34521.3max) Points +109%
Asus Vivobook Pro 16X K6604JV-MX016W
Intel Core i9-13980HX
28963 Points +75%
Alienware m16 R1 AMD
AMD Ryzen 9 7845HX
26876 (25414.3min - 26876.4max) Points +63%
Apple MacBook Pro 16 2023 M3 Max
Apple M3 Max 16-Core
24024 Points +45%
MSI Stealth 16 Mercedes-AMG Motorsport A13VG
Intel Core i9-13900H
19907 Points +21%
Lenovo Legion Pro 5 16ARX8
AMD Ryzen 7 7745HX
18060 (17729.5min - 18059.9max) Points +9%
Lenovo ThinkPad Z16 Gen 2
AMD Ryzen 9 PRO 7940HS
16938 (16164.3min - 16938.4max) Points +3%
Medio AMD Ryzen 9 7940HS
  (15556 - 18131, n=10)
16867 Points +2%
Framework Laptop 16
AMD Ryzen 9 7940HS
16519 (16352.4min - 16518.9max) Points
Lenovo Legion Slim 7 16APH8
AMD Ryzen 7 7840HS
16364 Points -1%
Dell Inspiron 16 Plus 7630
Intel Core i7-13700H
15922 (13533.8min - 15922.1max) Points -4%
MSI Prestige 16 B1MG-001US
Intel Core Ultra 7 155H
15013 (14365.6min - 15012.9max) Points -9%
HP Spectre x360 2-in-1 16-f1075ng
Intel Core i7-12700H
12071 Points -27%
Acer Swift Edge SFE16-42-R1GM
AMD Ryzen 7 7735U
10085 Points -39%
Cinebench R23 / Single Core
MSI Stealth 16 Mercedes-AMG Motorsport A13VG
Intel Core i9-13900H
2023 Points +17%
Apple MacBook Pro 16 2023 M3 Max
Apple M3 Max 16-Core
1968 Points +14%
Asus Zephyrus Duo 16 GX650PY-NM006W
AMD Ryzen 9 7945HX
1940 Points +12%
Dell Inspiron 16 Plus 7630
Intel Core i7-13700H
1874 Points +8%
Alienware m16 R1 AMD
AMD Ryzen 9 7845HX
1852 Points +7%
Lenovo Legion Pro 5 16ARX8
AMD Ryzen 7 7745HX
1846 Points +7%
Asus Vivobook Pro 16X K6604JV-MX016W
Intel Core i9-13980HX
1825 Points +5%
HP Spectre x360 2-in-1 16-f1075ng
Intel Core i7-12700H
1808 Points +4%
Lenovo ThinkPad Z16 Gen 2
AMD Ryzen 9 PRO 7940HS
1794 Points +4%
Medio AMD Ryzen 9 7940HS
  (1733 - 1832, n=10)
1788 Points +3%
Lenovo Legion Slim 7 16APH8
AMD Ryzen 7 7840HS
1754 Points +1%
MSI Prestige 16 B1MG-001US
Intel Core Ultra 7 155H
1749 Points +1%
Framework Laptop 16
AMD Ryzen 9 7940HS
1733 Points
Acer Swift Edge SFE16-42-R1GM
AMD Ryzen 7 7735U
1490 Points -14%
Cinebench R20 / CPU (Multi Core)
Asus Zephyrus Duo 16 GX650PY-NM006W
AMD Ryzen 9 7945HX
13457 Points +110%
Asus Vivobook Pro 16X K6604JV-MX016W
Intel Core i9-13980HX
11260 Points +76%
Alienware m16 R1 AMD
AMD Ryzen 9 7845HX
10492 Points +64%
MSI Stealth 16 Mercedes-AMG Motorsport A13VG
Intel Core i9-13900H
7659 Points +20%
Lenovo Legion Pro 5 16ARX8
AMD Ryzen 7 7745HX
7072 Points +10%
Medio AMD Ryzen 9 7940HS
  (6277 - 7111, n=10)
6604 Points +3%
Lenovo ThinkPad Z16 Gen 2
AMD Ryzen 9 PRO 7940HS
6601 Points +3%
Framework Laptop 16
AMD Ryzen 9 7940HS
6402 Points
Lenovo Legion Slim 7 16APH8
AMD Ryzen 7 7840HS
6379 Points 0%
Apple MacBook Pro 16 2023 M3 Max
Apple M3 Max 16-Core
6327 Points -1%
Dell Inspiron 16 Plus 7630
Intel Core i7-13700H
6162 Points -4%
MSI Prestige 16 B1MG-001US
Intel Core Ultra 7 155H
5741 Points -10%
HP Spectre x360 2-in-1 16-f1075ng
Intel Core i7-12700H
4693 Points -27%
Acer Swift Edge SFE16-42-R1GM
AMD Ryzen 7 7735U
3895 Points -39%
Cinebench R20 / CPU (Single Core)
MSI Stealth 16 Mercedes-AMG Motorsport A13VG
Intel Core i9-13900H
776 Points +14%
Asus Zephyrus Duo 16 GX650PY-NM006W
AMD Ryzen 9 7945HX
756 Points +11%
Dell Inspiron 16 Plus 7630
Intel Core i7-13700H
725 Points +7%
Alienware m16 R1 AMD
AMD Ryzen 9 7845HX
719 Points +6%
Lenovo Legion Pro 5 16ARX8
AMD Ryzen 7 7745HX
717 Points +5%
Asus Vivobook Pro 16X K6604JV-MX016W
Intel Core i9-13980HX
717 Points +5%
Medio AMD Ryzen 9 7940HS
  (680 - 714, n=10)
701 Points +3%
HP Spectre x360 2-in-1 16-f1075ng
Intel Core i7-12700H
697 Points +3%
Lenovo ThinkPad Z16 Gen 2
AMD Ryzen 9 PRO 7940HS
695 Points +2%
Framework Laptop 16
AMD Ryzen 9 7940HS
680 Points
Lenovo Legion Slim 7 16APH8
AMD Ryzen 7 7840HS
672 Points -1%
MSI Prestige 16 B1MG-001US
Intel Core Ultra 7 155H
669 Points -2%
Acer Swift Edge SFE16-42-R1GM
AMD Ryzen 7 7735U
524 Points -23%
Apple MacBook Pro 16 2023 M3 Max
Apple M3 Max 16-Core
497 Points -27%
Cinebench R15 / CPU Multi 64Bit
Asus Zephyrus Duo 16 GX650PY-NM006W
AMD Ryzen 9 7945HX
5554 (5255.55min - 5554.01max) Points +109%
Asus Vivobook Pro 16X K6604JV-MX016W
Intel Core i9-13980HX
4703 (3529.2min - 4703.12max) Points +77%
Alienware m16 R1 AMD
AMD Ryzen 9 7845HX
4320 (4198.59min - 4320.12max) Points +63%
Apple MacBook Pro 16 2023 M3 Max
Apple M3 Max 16-Core
3401 (3260min - 3401max) Points +28%
MSI Stealth 16 Mercedes-AMG Motorsport A13VG
Intel Core i9-13900H
3026 (1537.87min - 3026.18max) Points +14%
Lenovo Legion Pro 5 16ARX8
AMD Ryzen 7 7745HX
2978 (2861.03min - 2977.96max) Points +12%
Lenovo ThinkPad Z16 Gen 2
AMD Ryzen 9 PRO 7940HS
2718 (2534.21min - 2717.95max) Points +2%
Medio AMD Ryzen 9 7940HS
  (2470 - 2848, n=10)
2673 Points +1%
Framework Laptop 16
AMD Ryzen 9 7940HS
2653 (2587.82min - 2652.52max) Points
Lenovo Legion Slim 7 16APH8
AMD Ryzen 7 7840HS
2564 (2422.77min - 2563.77max) Points -3%
Dell Inspiron 16 Plus 7630
Intel Core i7-13700H
2421 (1806.77min - 2421.45max) Points -9%
MSI Prestige 16 B1MG-001US
Intel Core Ultra 7 155H
2362 (2208.24min - 2361.97max) Points -11%
HP Spectre x360 2-in-1 16-f1075ng
Intel Core i7-12700H
2080 Points -22%
Acer Swift Edge SFE16-42-R1GM
AMD Ryzen 7 7735U
1698 Points -36%
Cinebench R15 / CPU Single 64Bit
Asus Zephyrus Duo 16 GX650PY-NM006W
AMD Ryzen 9 7945HX
307 Points +11%
Alienware m16 R1 AMD
AMD Ryzen 9 7845HX
295 Points +6%
Lenovo Legion Pro 5 16ARX8
AMD Ryzen 7 7745HX
294 Points +6%
Asus Vivobook Pro 16X K6604JV-MX016W
Intel Core i9-13980HX
289 Points +4%
Medio AMD Ryzen 9 7940HS
  (277 - 288, n=10)
283 Points +2%
MSI Stealth 16 Mercedes-AMG Motorsport A13VG
Intel Core i9-13900H
280 Points +1%
Lenovo ThinkPad Z16 Gen 2
AMD Ryzen 9 PRO 7940HS
280 Points +1%
Framework Laptop 16
AMD Ryzen 9 7940HS
277 Points
Lenovo Legion Slim 7 16APH8
AMD Ryzen 7 7840HS
273 Points -1%
Apple MacBook Pro 16 2023 M3 Max
Apple M3 Max 16-Core
269 Points -3%
Dell Inspiron 16 Plus 7630
Intel Core i7-13700H
265 Points -4%
HP Spectre x360 2-in-1 16-f1075ng
Intel Core i7-12700H
262 Points -5%
MSI Prestige 16 B1MG-001US
Intel Core Ultra 7 155H
257 Points -7%
Acer Swift Edge SFE16-42-R1GM
AMD Ryzen 7 7735U
234 Points -16%
Blender / v2.79 BMW27 CPU
Acer Swift Edge SFE16-42-R1GM
AMD Ryzen 7 7735U
308 Seconds * -58%
HP Spectre x360 2-in-1 16-f1075ng
Intel Core i7-12700H
273 Seconds * -40%
MSI Stealth 16 Mercedes-AMG Motorsport A13VG
Intel Core i9-13900H
231 Seconds * -18%
Dell Inspiron 16 Plus 7630
Intel Core i7-13700H
221 Seconds * -13%
Apple MacBook Pro 16 2023 M3 Max
Apple M3 Max 16-Core
215 Seconds * -10%
MSI Prestige 16 B1MG-001US
Intel Core Ultra 7 155H
214 Seconds * -10%
Lenovo Legion Slim 7 16APH8
AMD Ryzen 7 7840HS
195 Seconds * -0%
Framework Laptop 16
AMD Ryzen 9 7940HS
195 Seconds *
Medio AMD Ryzen 9 7940HS
  (182 - 202, n=9)
191.1 Seconds * +2%
Lenovo ThinkPad Z16 Gen 2
AMD Ryzen 9 PRO 7940HS
191 Seconds * +2%
Lenovo Legion Pro 5 16ARX8
AMD Ryzen 7 7745HX
174 Seconds * +11%
Asus Vivobook Pro 16X K6604JV-MX016W
Intel Core i9-13980HX
136 Seconds * +30%
Alienware m16 R1 AMD
AMD Ryzen 9 7845HX
117 Seconds * +40%
Asus Zephyrus Duo 16 GX650PY-NM006W
AMD Ryzen 9 7945HX
93 Seconds * +52%
7-Zip 18.03 / 7z b 4
Asus Zephyrus Duo 16 GX650PY-NM006W
AMD Ryzen 9 7945HX
135927 MIPS +90%
Alienware m16 R1 AMD
AMD Ryzen 9 7845HX
106033 MIPS +48%
Asus Vivobook Pro 16X K6604JV-MX016W
Intel Core i9-13980HX
104616 MIPS +46%
Lenovo Legion Pro 5 16ARX8
AMD Ryzen 7 7745HX
75557 MIPS +6%
Framework Laptop 16
AMD Ryzen 9 7940HS
71464 MIPS
Medio AMD Ryzen 9 7940HS
  (66408 - 73434, n=10)
70912 MIPS -1%
Lenovo Legion Slim 7 16APH8
AMD Ryzen 7 7840HS
70243 MIPS -2%
Lenovo ThinkPad Z16 Gen 2
AMD Ryzen 9 PRO 7940HS
67813 MIPS -5%
MSI Prestige 16 B1MG-001US
Intel Core Ultra 7 155H
64527 MIPS -10%
Dell Inspiron 16 Plus 7630
Intel Core i7-13700H
59433 MIPS -17%
MSI Stealth 16 Mercedes-AMG Motorsport A13VG
Intel Core i9-13900H
57625 MIPS -19%
Acer Swift Edge SFE16-42-R1GM
AMD Ryzen 7 7735U
48972 MIPS -31%
HP Spectre x360 2-in-1 16-f1075ng
Intel Core i7-12700H
46548 MIPS -35%
7-Zip 18.03 / 7z b 4 -mmt1
Asus Zephyrus Duo 16 GX650PY-NM006W
AMD Ryzen 9 7945HX
7319 MIPS +11%
Lenovo Legion Pro 5 16ARX8
AMD Ryzen 7 7745HX
7244 MIPS +10%
Alienware m16 R1 AMD
AMD Ryzen 9 7845HX
7018 MIPS +6%
Asus Vivobook Pro 16X K6604JV-MX016W
Intel Core i9-13980HX
6972 MIPS +6%
Medio AMD Ryzen 9 7940HS
  (6417 - 6776, n=10)
6645 MIPS +1%
Lenovo Legion Slim 7 16APH8
AMD Ryzen 7 7840HS
6604 MIPS 0%
Framework Laptop 16
AMD Ryzen 9 7940HS
6599 MIPS
MSI Stealth 16 Mercedes-AMG Motorsport A13VG
Intel Core i9-13900H
6305 MIPS -4%
Lenovo ThinkPad Z16 Gen 2
AMD Ryzen 9 PRO 7940HS
6215 MIPS -6%
HP Spectre x360 2-in-1 16-f1075ng
Intel Core i7-12700H
5897 MIPS -11%
Dell Inspiron 16 Plus 7630
Intel Core i7-13700H
5703 MIPS -14%
Acer Swift Edge SFE16-42-R1GM
AMD Ryzen 7 7735U
5579 MIPS -15%
MSI Prestige 16 B1MG-001US
Intel Core Ultra 7 155H
5291 MIPS -20%
Geekbench 5.5 / Multi-Core
Apple MacBook Pro 16 2023 M3 Max
Apple M3 Max 16-Core
22816 Points +84%
Asus Zephyrus Duo 16 GX650PY-NM006W
AMD Ryzen 9 7945HX
19583 Points +58%
Asus Vivobook Pro 16X K6604JV-MX016W
Intel Core i9-13980HX
18475 Points +49%
Alienware m16 R1 AMD
AMD Ryzen 9 7845HX
15068 Points +22%
Dell Inspiron 16 Plus 7630
Intel Core i7-13700H
12805 Points +3%
MSI Prestige 16 B1MG-001US
Intel Core Ultra 7 155H
12499 Points +1%
Framework Laptop 16
AMD Ryzen 9 7940HS
12379 Points
Lenovo Legion Pro 5 16ARX8
AMD Ryzen 7 7745HX
12378 Points 0%
Lenovo ThinkPad Z16 Gen 2
AMD Ryzen 9 PRO 7940HS
12038 Points -3%
Medio AMD Ryzen 9 7940HS
  (11207 - 12500, n=11)
11902 Points -4%
Lenovo Legion Slim 7 16APH8
AMD Ryzen 7 7840HS
11872 Points -4%
MSI Stealth 16 Mercedes-AMG Motorsport A13VG
Intel Core i9-13900H
10600 Points -14%
HP Spectre x360 2-in-1 16-f1075ng
Intel Core i7-12700H
8946 Points -28%
Acer Swift Edge SFE16-42-R1GM
AMD Ryzen 7 7735U
8203 Points -34%
Geekbench 5.5 / Single-Core
Apple MacBook Pro 16 2023 M3 Max
Apple M3 Max 16-Core
2331 Points +19%
Asus Zephyrus Duo 16 GX650PY-NM006W
AMD Ryzen 9 7945HX
2132 Points +9%
Lenovo Legion Pro 5 16ARX8
AMD Ryzen 7 7745HX
2040 Points +4%
Alienware m16 R1 AMD
AMD Ryzen 9 7845HX
2008 Points +2%
Asus Vivobook Pro 16X K6604JV-MX016W
Intel Core i9-13980HX
2001 Points +2%
MSI Stealth 16 Mercedes-AMG Motorsport A13VG
Intel Core i9-13900H
1986 Points +1%
Medio AMD Ryzen 9 7940HS
  (1823 - 2032, n=11)
1983 Points +1%
Framework Laptop 16
AMD Ryzen 9 7940HS
1963 Points
Lenovo ThinkPad Z16 Gen 2
AMD Ryzen 9 PRO 7940HS
1956 Points 0%
Lenovo Legion Slim 7 16APH8
AMD Ryzen 7 7840HS
1943 Points -1%
Dell Inspiron 16 Plus 7630
Intel Core i7-13700H
1906 Points -3%
HP Spectre x360 2-in-1 16-f1075ng
Intel Core i7-12700H
1754 Points -11%
MSI Prestige 16 B1MG-001US
Intel Core Ultra 7 155H
1749 Points -11%
Acer Swift Edge SFE16-42-R1GM
AMD Ryzen 7 7735U
1522 Points -22%
HWBOT x265 Benchmark v2.2 / 4k Preset
Asus Zephyrus Duo 16 GX650PY-NM006W
AMD Ryzen 9 7945HX
34.8 fps +66%
Alienware m16 R1 AMD
AMD Ryzen 9 7845HX
29.7 fps +41%
Asus Vivobook Pro 16X K6604JV-MX016W
Intel Core i9-13980HX
27 fps +29%
Lenovo Legion Pro 5 16ARX8
AMD Ryzen 7 7745HX
23.2 fps +10%
Medio AMD Ryzen 9 7940HS
  (20.1 - 22.6, n=9)
21.1 fps 0%
Framework Laptop 16
AMD Ryzen 9 7940HS
21 fps
Lenovo ThinkPad Z16 Gen 2
AMD Ryzen 9 PRO 7940HS
20.4 fps -3%
Lenovo Legion Slim 7 16APH8
AMD Ryzen 7 7840HS
20.1 fps -4%
MSI Prestige 16 B1MG-001US
Intel Core Ultra 7 155H
16.9 fps -20%
Dell Inspiron 16 Plus 7630
Intel Core i7-13700H
15.9 fps -24%
MSI Stealth 16 Mercedes-AMG Motorsport A13VG
Intel Core i9-13900H
14.7 fps -30%
HP Spectre x360 2-in-1 16-f1075ng
Intel Core i7-12700H
13.4 fps -36%
Acer Swift Edge SFE16-42-R1GM
AMD Ryzen 7 7735U
12.5 fps -40%
LibreOffice / 20 Documents To PDF
Lenovo Legion Slim 7 16APH8
AMD Ryzen 7 7840HS
68.3 s * -57%
Asus Zephyrus Duo 16 GX650PY-NM006W
AMD Ryzen 9 7945HX
60.4 s * -39%
Acer Swift Edge SFE16-42-R1GM
AMD Ryzen 7 7735U
59.7 s * -37%
MSI Stealth 16 Mercedes-AMG Motorsport A13VG
Intel Core i9-13900H
57.5 s * -32%
Asus Vivobook Pro 16X K6604JV-MX016W
Intel Core i9-13980HX
51.4 s * -18%
MSI Prestige 16 B1MG-001US
Intel Core Ultra 7 155H
46.9 s * -8%
Lenovo ThinkPad Z16 Gen 2
AMD Ryzen 9 PRO 7940HS
46.1 s * -6%
Medio AMD Ryzen 9 7940HS
  (36.9 - 54.8, n=10)
45.4 s * -4%
Dell Inspiron 16 Plus 7630
Intel Core i7-13700H
45.1 s * -3%
Framework Laptop 16
AMD Ryzen 9 7940HS
43.6 s *
HP Spectre x360 2-in-1 16-f1075ng
Intel Core i7-12700H
42 s * +4%
Alienware m16 R1 AMD
AMD Ryzen 9 7845HX
39.4 s * +10%
Lenovo Legion Pro 5 16ARX8
AMD Ryzen 7 7745HX
37.9 s * +13%
R Benchmark 2.5 / Overall mean
Acer Swift Edge SFE16-42-R1GM
AMD Ryzen 7 7735U
0.51 sec * -14%
MSI Prestige 16 B1MG-001US
Intel Core Ultra 7 155H
0.4723 sec * -6%
HP Spectre x360 2-in-1 16-f1075ng
Intel Core i7-12700H
0.4632 sec * -4%
Lenovo ThinkPad Z16 Gen 2
AMD Ryzen 9 PRO 7940HS
0.4514 sec * -1%
Framework Laptop 16
AMD Ryzen 9 7940HS
0.4467 sec *
Lenovo Legion Slim 7 16APH8
AMD Ryzen 7 7840HS
0.4431 sec * +1%
Dell Inspiron 16 Plus 7630
Intel Core i7-13700H
0.4338 sec * +3%
MSI Stealth 16 Mercedes-AMG Motorsport A13VG
Intel Core i9-13900H
0.4303 sec * +4%
Medio AMD Ryzen 9 7940HS
  (0.4159 - 0.4467, n=10)
0.4297 sec * +4%
Alienware m16 R1 AMD
AMD Ryzen 9 7845HX
0.4255 sec * +5%
Lenovo Legion Pro 5 16ARX8
AMD Ryzen 7 7745HX
0.421 sec * +6%
Asus Vivobook Pro 16X K6604JV-MX016W
Intel Core i9-13980HX
0.4041 sec * +10%
Asus Zephyrus Duo 16 GX650PY-NM006W
AMD Ryzen 9 7945HX
0.3982 sec * +11%
CPU Performance Rating: Percent
Cinebench R23: Multi Core | Single Core
Cinebench R20: CPU (Multi Core) | CPU (Single Core)
Cinebench R15: CPU Multi 64Bit | CPU Single 64Bit
Blender: v2.79 BMW27 CPU
7-Zip 18.03: 7z b 4 | 7z b 4 -mmt1
Geekbench 5.5: Multi-Core | Single-Core
HWBOT x265 Benchmark v2.2: 4k Preset
LibreOffice : 20 Documents To PDF
R Benchmark 2.5: Overall mean

* ... más pequeño es mejor

Cinebench R15 CPU Multi 64Bit
2653 Points
Cinebench R15 OpenGL 64Bit
282 fps
Cinebench R15 Ref. Match 64Bit
97.9 %
Cinebench R15 CPU Single 64Bit
277 Points
Cinebench R20 CPU (Multi Core)
6402 Points
Cinebench R20 CPU (Single Core)
680 Points
Cinebench R23 Single Core
1733 Points
Cinebench R23 Multi Core
16519 Points
Cinebench 2024 CPU Multi Core
953 Points
Cinebench 2024 CPU Single Core
104.5 Points
ayuda
Performance Rating
Framework Laptop 16
AMD Ryzen 9 7940HS, Radeon RX 7700S
95.3 pt
Medio AMD Ryzen 9 7940HS
 
94.1 pt
Lenovo ThinkPad Z16 Gen 2
AMD Ryzen 9 PRO 7940HS, Radeon RX 6550M
93.4 pt
MSI Prestige 16 B1MG-001US
Intel Core Ultra 7 155H, Arc 8-Core
69.7 pt
Dell Inspiron 16 Plus 7630
Intel Core i7-13700H, NVIDIA GeForce RTX 4060 Laptop GPU
61.2 pt
HP Spectre x360 2-in-1 16-f1075ng
Intel Core i7-12700H, Iris Xe G7 96EUs
52.4 pt
AIDA64 / FP32 Ray-Trace
Lenovo ThinkPad Z16 Gen 2
AMD Ryzen 9 PRO 7940HS, Radeon RX 6550M
27411 KRay/s +2%
Medio AMD Ryzen 9 7940HS
  (25226 - 29109, n=8)
27015 KRay/s +1%
Framework Laptop 16
AMD Ryzen 9 7940HS, Radeon RX 7700S
26844 KRay/s
MSI Prestige 16 B1MG-001US
Intel Core Ultra 7 155H, Arc 8-Core
15218 KRay/s -43%
Dell Inspiron 16 Plus 7630
Intel Core i7-13700H, NVIDIA GeForce RTX 4060 Laptop GPU
13648 KRay/s -49%
HP Spectre x360 2-in-1 16-f1075ng
Intel Core i7-12700H, Iris Xe G7 96EUs
11101 KRay/s -59%
AIDA64 / FPU Julia
Lenovo ThinkPad Z16 Gen 2
AMD Ryzen 9 PRO 7940HS, Radeon RX 6550M
116960 Points +4%
Medio AMD Ryzen 9 7940HS
  (106512 - 123214, n=8)
115513 Points +2%
Framework Laptop 16
AMD Ryzen 9 7940HS, Radeon RX 7700S
112922 Points
MSI Prestige 16 B1MG-001US
Intel Core Ultra 7 155H, Arc 8-Core
78381 Points -31%
Dell Inspiron 16 Plus 7630
Intel Core i7-13700H, NVIDIA GeForce RTX 4060 Laptop GPU
68323 Points -39%
HP Spectre x360 2-in-1 16-f1075ng
Intel Core i7-12700H, Iris Xe G7 96EUs
56729 Points -50%
AIDA64 / CPU SHA3
Lenovo ThinkPad Z16 Gen 2
AMD Ryzen 9 PRO 7940HS, Radeon RX 6550M
4944 MB/s 0%
Framework Laptop 16
AMD Ryzen 9 7940HS, Radeon RX 7700S
4927 MB/s
Medio AMD Ryzen 9 7940HS
  (4566 - 5119, n=8)
4877 MB/s -1%
MSI Prestige 16 B1MG-001US
Intel Core Ultra 7 155H, Arc 8-Core
3616 MB/s -27%
Dell Inspiron 16 Plus 7630
Intel Core i7-13700H, NVIDIA GeForce RTX 4060 Laptop GPU
3029 MB/s -39%
HP Spectre x360 2-in-1 16-f1075ng
Intel Core i7-12700H, Iris Xe G7 96EUs
2646 MB/s -46%
AIDA64 / CPU Queen
Lenovo ThinkPad Z16 Gen 2
AMD Ryzen 9 PRO 7940HS, Radeon RX 6550M
124565 Points +3%
Framework Laptop 16
AMD Ryzen 9 7940HS, Radeon RX 7700S
121264 Points
Medio AMD Ryzen 9 7940HS
  (118174 - 124783, n=8)
121129 Points 0%
Dell Inspiron 16 Plus 7630
Intel Core i7-13700H, NVIDIA GeForce RTX 4060 Laptop GPU
105205 Points -13%
MSI Prestige 16 B1MG-001US
Intel Core Ultra 7 155H, Arc 8-Core
93266 Points -23%
HP Spectre x360 2-in-1 16-f1075ng
Intel Core i7-12700H, Iris Xe G7 96EUs
90576 Points -25%
AIDA64 / FPU SinJulia
Lenovo ThinkPad Z16 Gen 2
AMD Ryzen 9 PRO 7940HS, Radeon RX 6550M
15304 Points +2%
Medio AMD Ryzen 9 7940HS
  (14663 - 15551, n=8)
15145 Points +1%
Framework Laptop 16
AMD Ryzen 9 7940HS, Radeon RX 7700S
14935 Points
MSI Prestige 16 B1MG-001US
Intel Core Ultra 7 155H, Arc 8-Core
10170 Points -32%
Dell Inspiron 16 Plus 7630
Intel Core i7-13700H, NVIDIA GeForce RTX 4060 Laptop GPU
8930 Points -40%
HP Spectre x360 2-in-1 16-f1075ng
Intel Core i7-12700H, Iris Xe G7 96EUs
7714 Points -48%
AIDA64 / FPU Mandel
Lenovo ThinkPad Z16 Gen 2
AMD Ryzen 9 PRO 7940HS, Radeon RX 6550M
62357 Points +3%
Medio AMD Ryzen 9 7940HS
  (56839 - 66238, n=8)
61581 Points +2%
Framework Laptop 16
AMD Ryzen 9 7940HS, Radeon RX 7700S
60474 Points
MSI Prestige 16 B1MG-001US
Intel Core Ultra 7 155H, Arc 8-Core
38412 Points -36%
Dell Inspiron 16 Plus 7630
Intel Core i7-13700H, NVIDIA GeForce RTX 4060 Laptop GPU
33737 Points -44%
HP Spectre x360 2-in-1 16-f1075ng
Intel Core i7-12700H, Iris Xe G7 96EUs
27800 Points -54%
AIDA64 / CPU AES
Framework Laptop 16
AMD Ryzen 9 7940HS, Radeon RX 7700S
169946 MB/s
Medio AMD Ryzen 9 7940HS
  (86309 - 169946, n=8)
128009 MB/s -25%
HP Spectre x360 2-in-1 16-f1075ng
Intel Core i7-12700H, Iris Xe G7 96EUs
101332 MB/s -40%
Lenovo ThinkPad Z16 Gen 2
AMD Ryzen 9 PRO 7940HS, Radeon RX 6550M
88705 MB/s -48%
MSI Prestige 16 B1MG-001US
Intel Core Ultra 7 155H, Arc 8-Core
76481 MB/s -55%
Dell Inspiron 16 Plus 7630
Intel Core i7-13700H, NVIDIA GeForce RTX 4060 Laptop GPU
63127 MB/s -63%
AIDA64 / CPU ZLib
Lenovo ThinkPad Z16 Gen 2
AMD Ryzen 9 PRO 7940HS, Radeon RX 6550M
1079 MB/s +25%
Medio AMD Ryzen 9 7940HS
  (866 - 1152, n=8)
1062 MB/s +23%
MSI Prestige 16 B1MG-001US
Intel Core Ultra 7 155H, Arc 8-Core
1058 MB/s +22%
Framework Laptop 16
AMD Ryzen 9 7940HS, Radeon RX 7700S
866 MB/s
Dell Inspiron 16 Plus 7630
Intel Core i7-13700H, NVIDIA GeForce RTX 4060 Laptop GPU
829 MB/s -4%
HP Spectre x360 2-in-1 16-f1075ng
Intel Core i7-12700H, Iris Xe G7 96EUs
752 MB/s -13%
AIDA64 / FP64 Ray-Trace
Lenovo ThinkPad Z16 Gen 2
AMD Ryzen 9 PRO 7940HS, Radeon RX 6550M
14590 KRay/s +3%
Medio AMD Ryzen 9 7940HS
  (13175 - 15675, n=8)
14510 KRay/s +2%
Framework Laptop 16
AMD Ryzen 9 7940HS, Radeon RX 7700S
14231 KRay/s
MSI Prestige 16 B1MG-001US
Intel Core Ultra 7 155H, Arc 8-Core
8102 KRay/s -43%
Dell Inspiron 16 Plus 7630
Intel Core i7-13700H, NVIDIA GeForce RTX 4060 Laptop GPU
7318 KRay/s -49%
HP Spectre x360 2-in-1 16-f1075ng
Intel Core i7-12700H, Iris Xe G7 96EUs
5896 KRay/s -59%
AIDA64 / CPU PhotoWorxx
MSI Prestige 16 B1MG-001US
Intel Core Ultra 7 155H, Arc 8-Core
46208 MPixel/s +13%
Framework Laptop 16
AMD Ryzen 9 7940HS, Radeon RX 7700S
41024 MPixel/s
Dell Inspiron 16 Plus 7630
Intel Core i7-13700H, NVIDIA GeForce RTX 4060 Laptop GPU
37857 MPixel/s -8%
Lenovo ThinkPad Z16 Gen 2
AMD Ryzen 9 PRO 7940HS, Radeon RX 6550M
37800 MPixel/s -8%
Medio AMD Ryzen 9 7940HS
  (29922 - 41024, n=8)
35306 MPixel/s -14%
HP Spectre x360 2-in-1 16-f1075ng
Intel Core i7-12700H, Iris Xe G7 96EUs
20213 MPixel/s -51%

Rendimiento del sistema

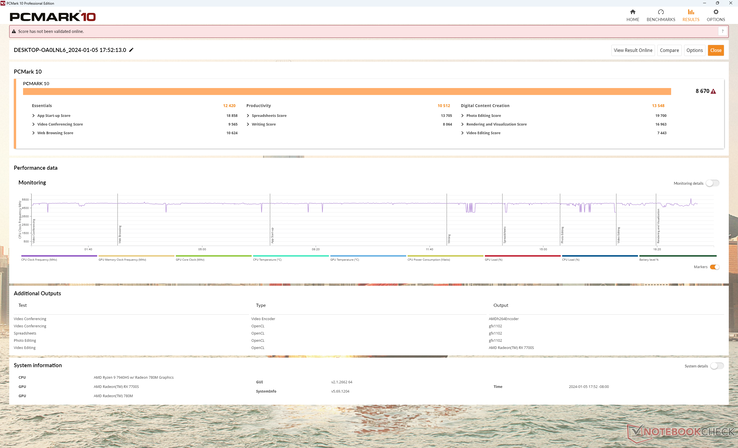
Las puntuaciones PCMark 10 son de las más altas de cualquier portátil multimedia de 16 pulgadas gracias a la rápida CPU Ryzen 9 Zen 4 y a los gráficos Radeon asociados. Las altas puntuaciones en PCMark demuestran que el Framework 16 puede ser tan rápido como otros portátiles de alto rendimiento al ejecutar tareas diarias que van desde navegadores a editores gráficos.

PCMark 10 Estándar
PCMark 10 Estándar
PCMark 10 / Score
Framework Laptop 16
Radeon RX 7700S, R9 7940HS, WDC PC SN810 1TB
8670 Points
Medio AMD Ryzen 9 7940HS, AMD Radeon RX 7700S
  ()
8670 Points 0%
Lenovo ThinkPad Z16 Gen 2
Radeon RX 6550M, R9 PRO 7940HS, Kioxia XG8 KXG8AZNV1T02
7777 Points -10%
Dell Inspiron 16 Plus 7630
NVIDIA GeForce RTX 4060 Laptop GPU, i7-13700H, WD PC SN740 SDDPTQD-1T00
7661 Points -12%
MSI Prestige 16 B1MG-001US
Arc 8-Core, Ultra 7 155H, Samsung PM9A1 MZVL22T0HBLB
7033 Points -19%
HP Spectre x360 2-in-1 16-f1075ng
Iris Xe G7 96EUs, i7-12700H, SK Hynix PC711 1TB HFS001TDE9X073N
5904 Points -32%
PCMark 10 / Essentials
Framework Laptop 16
Radeon RX 7700S, R9 7940HS, WDC PC SN810 1TB
12420 Points
Medio AMD Ryzen 9 7940HS, AMD Radeon RX 7700S
  ()
12420 Points 0%
Lenovo ThinkPad Z16 Gen 2
Radeon RX 6550M, R9 PRO 7940HS, Kioxia XG8 KXG8AZNV1T02
11483 Points -8%
Dell Inspiron 16 Plus 7630
NVIDIA GeForce RTX 4060 Laptop GPU, i7-13700H, WD PC SN740 SDDPTQD-1T00
11200 Points -10%
MSI Prestige 16 B1MG-001US
Arc 8-Core, Ultra 7 155H, Samsung PM9A1 MZVL22T0HBLB
11156 Points -10%
HP Spectre x360 2-in-1 16-f1075ng
Iris Xe G7 96EUs, i7-12700H, SK Hynix PC711 1TB HFS001TDE9X073N
10825 Points -13%
PCMark 10 / Productivity
Framework Laptop 16
Radeon RX 7700S, R9 7940HS, WDC PC SN810 1TB
10512 Points
Medio AMD Ryzen 9 7940HS, AMD Radeon RX 7700S
  ()
10512 Points 0%
Lenovo ThinkPad Z16 Gen 2
Radeon RX 6550M, R9 PRO 7940HS, Kioxia XG8 KXG8AZNV1T02
10046 Points -4%
Dell Inspiron 16 Plus 7630
NVIDIA GeForce RTX 4060 Laptop GPU, i7-13700H, WD PC SN740 SDDPTQD-1T00
9394 Points -11%
MSI Prestige 16 B1MG-001US
Arc 8-Core, Ultra 7 155H, Samsung PM9A1 MZVL22T0HBLB
8705 Points -17%
HP Spectre x360 2-in-1 16-f1075ng
Iris Xe G7 96EUs, i7-12700H, SK Hynix PC711 1TB HFS001TDE9X073N
7239 Points -31%
PCMark 10 / Digital Content Creation
Framework Laptop 16
Radeon RX 7700S, R9 7940HS, WDC PC SN810 1TB
13548 Points
Medio AMD Ryzen 9 7940HS, AMD Radeon RX 7700S
  ()
13548 Points 0%
Dell Inspiron 16 Plus 7630
NVIDIA GeForce RTX 4060 Laptop GPU, i7-13700H, WD PC SN740 SDDPTQD-1T00
11598 Points -14%
Lenovo ThinkPad Z16 Gen 2
Radeon RX 6550M, R9 PRO 7940HS, Kioxia XG8 KXG8AZNV1T02
11064 Points -18%
MSI Prestige 16 B1MG-001US
Arc 8-Core, Ultra 7 155H, Samsung PM9A1 MZVL22T0HBLB
9720 Points -28%
HP Spectre x360 2-in-1 16-f1075ng
Iris Xe G7 96EUs, i7-12700H, SK Hynix PC711 1TB HFS001TDE9X073N
7127 Points -47%
CrossMark / Overall
Apple MacBook Pro 16 2023 M3 Max
M3 Max 40-Core GPU, Apple M3 Max 16-Core, Apple SSD AP8192Z
2051 Points +23%
Dell Inspiron 16 Plus 7630
NVIDIA GeForce RTX 4060 Laptop GPU, i7-13700H, WD PC SN740 SDDPTQD-1T00
1849 Points +10%
MSI Prestige 16 B1MG-001US
Arc 8-Core, Ultra 7 155H, Samsung PM9A1 MZVL22T0HBLB
1769 Points +6%
HP Spectre x360 2-in-1 16-f1075ng
Iris Xe G7 96EUs, i7-12700H, SK Hynix PC711 1TB HFS001TDE9X073N
1701 Points +2%
Framework Laptop 16
Radeon RX 7700S, R9 7940HS, WDC PC SN810 1TB
1674 Points
Medio AMD Ryzen 9 7940HS, AMD Radeon RX 7700S
  ()
1674 Points 0%
Lenovo ThinkPad Z16 Gen 2
Radeon RX 6550M, R9 PRO 7940HS, Kioxia XG8 KXG8AZNV1T02
1555 Points -7%
CrossMark / Productivity
Apple MacBook Pro 16 2023 M3 Max
M3 Max 40-Core GPU, Apple M3 Max 16-Core, Apple SSD AP8192Z
1828 Points +15%
Dell Inspiron 16 Plus 7630
NVIDIA GeForce RTX 4060 Laptop GPU, i7-13700H, WD PC SN740 SDDPTQD-1T00
1743 Points +10%
HP Spectre x360 2-in-1 16-f1075ng
Iris Xe G7 96EUs, i7-12700H, SK Hynix PC711 1TB HFS001TDE9X073N
1717 Points +8%
MSI Prestige 16 B1MG-001US
Arc 8-Core, Ultra 7 155H, Samsung PM9A1 MZVL22T0HBLB
1693 Points +7%
Framework Laptop 16
Radeon RX 7700S, R9 7940HS, WDC PC SN810 1TB
1583 Points
Medio AMD Ryzen 9 7940HS, AMD Radeon RX 7700S
  ()
1583 Points 0%
Lenovo ThinkPad Z16 Gen 2
Radeon RX 6550M, R9 PRO 7940HS, Kioxia XG8 KXG8AZNV1T02
1488 Points -6%
CrossMark / Creativity
Apple MacBook Pro 16 2023 M3 Max
M3 Max 40-Core GPU, Apple M3 Max 16-Core, Apple SSD AP8192Z
2564 Points +37%
Dell Inspiron 16 Plus 7630
NVIDIA GeForce RTX 4060 Laptop GPU, i7-13700H, WD PC SN740 SDDPTQD-1T00
2064 Points +11%
MSI Prestige 16 B1MG-001US
Arc 8-Core, Ultra 7 155H, Samsung PM9A1 MZVL22T0HBLB
1928 Points +3%
Framework Laptop 16
Radeon RX 7700S, R9 7940HS, WDC PC SN810 1TB
1866 Points
Medio AMD Ryzen 9 7940HS, AMD Radeon RX 7700S
  ()
1866 Points 0%
Lenovo ThinkPad Z16 Gen 2
Radeon RX 6550M, R9 PRO 7940HS, Kioxia XG8 KXG8AZNV1T02
1714 Points -8%
HP Spectre x360 2-in-1 16-f1075ng
Iris Xe G7 96EUs, i7-12700H, SK Hynix PC711 1TB HFS001TDE9X073N
1655 Points -11%
CrossMark / Responsiveness
HP Spectre x360 2-in-1 16-f1075ng
Iris Xe G7 96EUs, i7-12700H, SK Hynix PC711 1TB HFS001TDE9X073N
1799 Points +26%
Dell Inspiron 16 Plus 7630
NVIDIA GeForce RTX 4060 Laptop GPU, i7-13700H, WD PC SN740 SDDPTQD-1T00
1589 Points +11%
MSI Prestige 16 B1MG-001US
Arc 8-Core, Ultra 7 155H, Samsung PM9A1 MZVL22T0HBLB
1556 Points +9%
Apple MacBook Pro 16 2023 M3 Max
M3 Max 40-Core GPU, Apple M3 Max 16-Core, Apple SSD AP8192Z
1486 Points +4%
Framework Laptop 16
Radeon RX 7700S, R9 7940HS, WDC PC SN810 1TB
1429 Points
Medio AMD Ryzen 9 7940HS, AMD Radeon RX 7700S
  ()
1429 Points 0%
Lenovo ThinkPad Z16 Gen 2
Radeon RX 6550M, R9 PRO 7940HS, Kioxia XG8 KXG8AZNV1T02
1325 Points -7%
WebXPRT 3 / Overall
Apple MacBook Pro 16 2023 M3 Max
M3 Max 40-Core GPU, Apple M3 Max 16-Core, Apple SSD AP8192Z
426 Points +22%
Framework Laptop 16
Radeon RX 7700S, R9 7940HS, WDC PC SN810 1TB
349 Points
Medio AMD Ryzen 9 7940HS, AMD Radeon RX 7700S
  ()
349 Points 0%
Lenovo ThinkPad Z16 Gen 2
Radeon RX 6550M, R9 PRO 7940HS, Kioxia XG8 KXG8AZNV1T02
315 Points -10%
Dell Inspiron 16 Plus 7630
NVIDIA GeForce RTX 4060 Laptop GPU, i7-13700H, WD PC SN740 SDDPTQD-1T00
314 Points -10%
MSI Prestige 16 B1MG-001US
Arc 8-Core, Ultra 7 155H, Samsung PM9A1 MZVL22T0HBLB
299 Points -14%
HP Spectre x360 2-in-1 16-f1075ng
Iris Xe G7 96EUs, i7-12700H, SK Hynix PC711 1TB HFS001TDE9X073N
271 Points -22%
WebXPRT 4 / Overall
Dell Inspiron 16 Plus 7630
NVIDIA GeForce RTX 4060 Laptop GPU, i7-13700H, WD PC SN740 SDDPTQD-1T00
274 Points +3%
Framework Laptop 16
Radeon RX 7700S, R9 7940HS, WDC PC SN810 1TB
265 Points
Medio AMD Ryzen 9 7940HS, AMD Radeon RX 7700S
  ()
265 Points 0%
MSI Prestige 16 B1MG-001US
Arc 8-Core, Ultra 7 155H, Samsung PM9A1 MZVL22T0HBLB
263 Points -1%
Lenovo ThinkPad Z16 Gen 2
Radeon RX 6550M, R9 PRO 7940HS, Kioxia XG8 KXG8AZNV1T02
255 Points -4%
HP Spectre x360 2-in-1 16-f1075ng
Iris Xe G7 96EUs, i7-12700H, SK Hynix PC711 1TB HFS001TDE9X073N
249 Points -6%
Mozilla Kraken 1.1 / Total
Lenovo ThinkPad Z16 Gen 2
Radeon RX 6550M, R9 PRO 7940HS, Kioxia XG8 KXG8AZNV1T02
546 ms * -11%
MSI Prestige 16 B1MG-001US
Arc 8-Core, Ultra 7 155H, Samsung PM9A1 MZVL22T0HBLB
525 ms * -7%
HP Spectre x360 2-in-1 16-f1075ng
Iris Xe G7 96EUs, i7-12700H, SK Hynix PC711 1TB HFS001TDE9X073N
524 ms * -7%
Dell Inspiron 16 Plus 7630
NVIDIA GeForce RTX 4060 Laptop GPU, i7-13700H, WD PC SN740 SDDPTQD-1T00
500 ms * -2%
Framework Laptop 16
Radeon RX 7700S, R9 7940HS, WDC PC SN810 1TB
490 ms *
Medio AMD Ryzen 9 7940HS, AMD Radeon RX 7700S
  ()
490 ms * -0%
Apple MacBook Pro 16 2023 M3 Max
M3 Max 40-Core GPU, Apple M3 Max 16-Core, Apple SSD AP8192Z
391.7 ms * +20%

* ... más pequeño es mejor

PCMark 10 Score
8670 puntos
ayuda
AIDA64 / Memory Copy
MSI Prestige 16 B1MG-001US
Intel Core Ultra 7 155H, Arc 8-Core
80951 MB/s +3%
Framework Laptop 16
AMD Ryzen 9 7940HS, Radeon RX 7700S
78739 MB/s
Lenovo ThinkPad Z16 Gen 2
AMD Ryzen 9 PRO 7940HS, Radeon RX 6550M
66740 MB/s -15%
Medio AMD Ryzen 9 7940HS
  (59712 - 78739, n=8)
65738 MB/s -17%
Dell Inspiron 16 Plus 7630
Intel Core i7-13700H, NVIDIA GeForce RTX 4060 Laptop GPU
59555 MB/s -24%
HP Spectre x360 2-in-1 16-f1075ng
Intel Core i7-12700H, Iris Xe G7 96EUs
40944 MB/s -48%
AIDA64 / Memory Read
MSI Prestige 16 B1MG-001US
Intel Core Ultra 7 155H, Arc 8-Core
75886 MB/s +23%
Dell Inspiron 16 Plus 7630
Intel Core i7-13700H, NVIDIA GeForce RTX 4060 Laptop GPU
68066 MB/s +10%
Framework Laptop 16
AMD Ryzen 9 7940HS, Radeon RX 7700S
61735 MB/s
Medio AMD Ryzen 9 7940HS
  (50399 - 61836, n=8)
60105 MB/s -3%
Lenovo ThinkPad Z16 Gen 2
AMD Ryzen 9 PRO 7940HS, Radeon RX 6550M
50398 MB/s -18%
HP Spectre x360 2-in-1 16-f1075ng
Intel Core i7-12700H, Iris Xe G7 96EUs
43659 MB/s -29%
AIDA64 / Memory Write
Lenovo ThinkPad Z16 Gen 2
AMD Ryzen 9 PRO 7940HS, Radeon RX 6550M
91516 MB/s +5%
Framework Laptop 16
AMD Ryzen 9 7940HS, Radeon RX 7700S
87033 MB/s
Medio AMD Ryzen 9 7940HS
  (72541 - 91567, n=8)
81839 MB/s -6%
MSI Prestige 16 B1MG-001US
Intel Core Ultra 7 155H, Arc 8-Core
75909 MB/s -13%
Dell Inspiron 16 Plus 7630
Intel Core i7-13700H, NVIDIA GeForce RTX 4060 Laptop GPU
59733 MB/s -31%
HP Spectre x360 2-in-1 16-f1075ng
Intel Core i7-12700H, Iris Xe G7 96EUs
42999 MB/s -51%
AIDA64 / Memory Latency
MSI Prestige 16 B1MG-001US
Intel Core Ultra 7 155H, Arc 8-Core
135.9 ns * -49%
Lenovo ThinkPad Z16 Gen 2
AMD Ryzen 9 PRO 7940HS, Radeon RX 6550M
121.3 ns * -33%
Dell Inspiron 16 Plus 7630
Intel Core i7-13700H, NVIDIA GeForce RTX 4060 Laptop GPU
93.7 ns * -3%
Medio AMD Ryzen 9 7940HS
  (87.6 - 111.1, n=8)
92.7 ns * -1%
Framework Laptop 16
AMD Ryzen 9 7940HS, Radeon RX 7700S
91.4 ns *
HP Spectre x360 2-in-1 16-f1075ng
Intel Core i7-12700H, Iris Xe G7 96EUs
77.8 ns * +15%

* ... más pequeño es mejor

Latencia del CPD

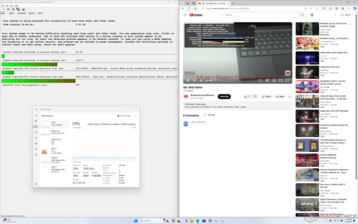
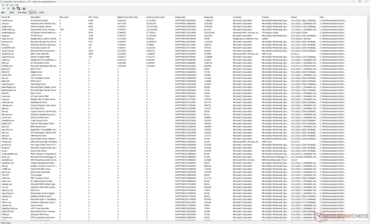
LatencyMon revela problemas de CPD al abrir varias pestañas del navegador de nuestra página principal. Además, somos capaces de registrar 6 fotogramas caídos durante un lapso de tiempo de un minuto al reproducir vídeo 4K60. Cada fotograma caído se producía a intervalos casi regulares, lo que sugiere un problema de controladores subyacente potencialmente relacionado con las GPU AMD. Según nuestra experiencia, la mayoría de los portátiles basados en Intel no sufren problemas similares y es más probable que no caigan fotogramas en absoluto al ejecutar la misma prueba.

LatencyMon
LatencyMon
Lista de conductores
DPC Latencies / LatencyMon - interrupt to process latency (max), Web, Youtube, Prime95
Lenovo ThinkPad Z16 Gen 2
Radeon RX 6550M, R9 PRO 7940HS, Kioxia XG8 KXG8AZNV1T02
1253.5 μs * -8%
Framework Laptop 16
Radeon RX 7700S, R9 7940HS, WDC PC SN810 1TB
1159 μs *
HP Spectre x360 2-in-1 16-f1075ng
Iris Xe G7 96EUs, i7-12700H, SK Hynix PC711 1TB HFS001TDE9X073N
1124.3 μs * +3%
Dell Inspiron 16 Plus 7630
NVIDIA GeForce RTX 4060 Laptop GPU, i7-13700H, WD PC SN740 SDDPTQD-1T00
1020.2 μs * +12%
MSI Prestige 16 B1MG-001US
Arc 8-Core, Ultra 7 155H, Samsung PM9A1 MZVL22T0HBLB
527.2 μs * +55%

* ... más pequeño es mejor

Dispositivos de almacenamiento

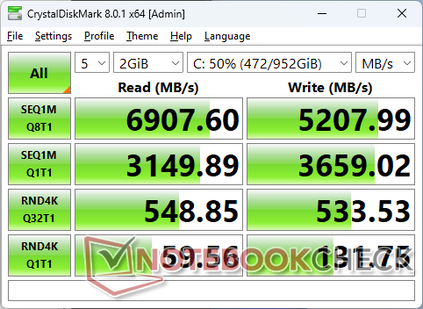
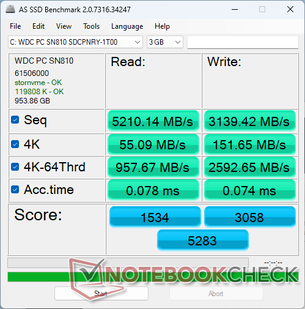
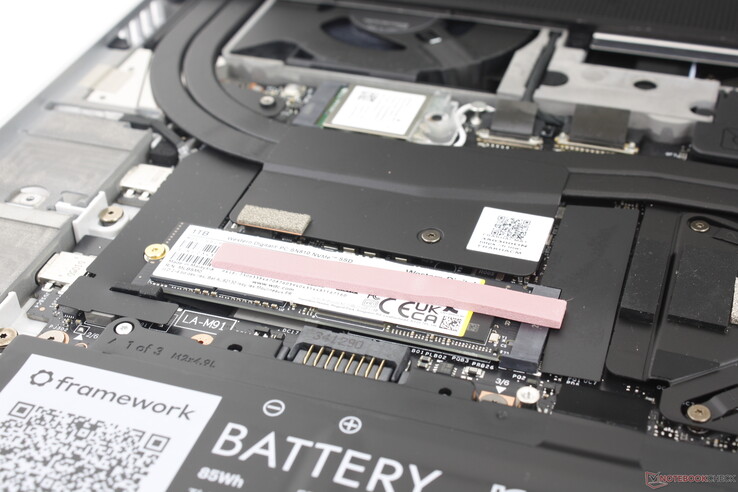
Nuestra unidad de prueba se entrega con el Western Digital SN810 PCIe4 x4 NVMe SSD que es una actualización de la SN740 que está disponible actualmente en el Framework 13.5. La unidad no mostró problemas para mantener una tasa de transferencia de ~7000 MB/s durante periodos prolongados, a diferencia de lo que observamos en el HP Pavilion Plus 14 equipado con la misma unidad SSD de WD. Esto sugiere que el Framework 16 se diseñó teniendo en cuenta una mejor refrigeración de la SSD para evitar el estrangulamiento del rendimiento.

MDL 8
MDL 8
AS SSD
AS SSD
A diferencia de la serie LG Gram 16, el portátil 16 no admite una unidad SSD secundaria interna
WDC PC SN810 1TB
CDM 5/6 Read Seq Q32T1: 6916 MB/s
CDM 5/6 Write Seq Q32T1: 5188 MB/s
CDM 5/6 Read 4K Q32T1: 552.2 MB/s
CDM 5/6 Write 4K Q32T1: 553.2 MB/s
CDM 5 Read Seq: 3144 MB/s
CDM 5 Write Seq: 3661 MB/s
CDM 5/6 Read 4K: 59.81 MB/s
CDM 5/6 Write 4K: 130.4 MB/s
Drive Performance Rating - Percent
MSI Prestige 16 B1MG-001US
Samsung PM9A1 MZVL22T0HBLB
91.1 pt
Medio WDC PC SN810 1TB
 
74.9 pt
Framework Laptop 16
WDC PC SN810 1TB
66.1 pt
HP Spectre x360 2-in-1 16-f1075ng
SK Hynix PC711 1TB HFS001TDE9X073N
64.7 pt
Lenovo ThinkPad Z16 Gen 2
Kioxia XG8 KXG8AZNV1T02
62.2 pt
Dell Inspiron 16 Plus 7630
WD PC SN740 SDDPTQD-1T00
61.1 pt
DiskSpd
seq read
MSI Prestige 16 B1MG-001US
Samsung PM9A1 MZVL22T0HBLB
4432 (4393.32min - 4432.27max) MB/s +19%
Medio WDC PC SN810 1TB
  (3265 - 4224, n=12)
3731 MB/s 0%
Framework Laptop 16
WDC PC SN810 1TB
3713 (3692.83min - 3713.34max) MB/s
Lenovo ThinkPad Z16 Gen 2
Kioxia XG8 KXG8AZNV1T02
3654 (3592.99min - 3653.69max) MB/s -2%
Dell Inspiron 16 Plus 7630
WD PC SN740 SDDPTQD-1T00
3156 (3078.2min - 3156.21max) MB/s -15%
HP Spectre x360 2-in-1 16-f1075ng
SK Hynix PC711 1TB HFS001TDE9X073N
2024 (1944.48min - 2024.11max) MB/s -45%
seq write
MSI Prestige 16 B1MG-001US
Samsung PM9A1 MZVL22T0HBLB
4432 (4395.44min - 4431.7max) MB/s +11%
Framework Laptop 16
WDC PC SN810 1TB
3984 (3947.47min - 3984.38max) MB/s
Lenovo ThinkPad Z16 Gen 2
Kioxia XG8 KXG8AZNV1T02
3877 (3771.73min - 3876.79max) MB/s -3%
Medio WDC PC SN810 1TB
  (2767 - 5015, n=12)
3838 MB/s -4%
Dell Inspiron 16 Plus 7630
WD PC SN740 SDDPTQD-1T00
3503 (3341.99min - 3503.29max) MB/s -12%
HP Spectre x360 2-in-1 16-f1075ng
SK Hynix PC711 1TB HFS001TDE9X073N
1548 (1453.93min - 1548.49max) MB/s -61%
seq q8 t1 read
MSI Prestige 16 B1MG-001US
Samsung PM9A1 MZVL22T0HBLB
7107 (6650.61min - 7107.46max) MB/s +2%
Lenovo ThinkPad Z16 Gen 2
Kioxia XG8 KXG8AZNV1T02
7002 (6363.24min - 7002.18max) MB/s 0%
Framework Laptop 16
WDC PC SN810 1TB
6972 (6567.52min - 6972.09max) MB/s
Medio WDC PC SN810 1TB
  (6674 - 6984, n=12)
6884 MB/s -1%
Dell Inspiron 16 Plus 7630
WD PC SN740 SDDPTQD-1T00
5187 (4478.95min - 5186.89max) MB/s -26%
HP Spectre x360 2-in-1 16-f1075ng
SK Hynix PC711 1TB HFS001TDE9X073N
3544 (2906.02min - 3543.98max) MB/s -49%
seq q8 t1 write
Lenovo ThinkPad Z16 Gen 2
Kioxia XG8 KXG8AZNV1T02
5602 (5479.75min - 5601.7max) MB/s +7%
MSI Prestige 16 B1MG-001US
Samsung PM9A1 MZVL22T0HBLB
5249 (5168.16min - 5248.53max) MB/s +1%
Framework Laptop 16
WDC PC SN810 1TB
5213 (5149.53min - 5212.74max) MB/s
Medio WDC PC SN810 1TB
  (4454 - 5412, n=12)
5121 MB/s -2%
Dell Inspiron 16 Plus 7630
WD PC SN740 SDDPTQD-1T00
4824 (4712.92min - 4824.08max) MB/s -7%
HP Spectre x360 2-in-1 16-f1075ng
SK Hynix PC711 1TB HFS001TDE9X073N
3250 (3167.12min - 3250.17max) MB/s -38%
4k q1 t1 read
MSI Prestige 16 B1MG-001US
Samsung PM9A1 MZVL22T0HBLB
81.5 (81.19min - 81.46max) MB/s +21%
Dell Inspiron 16 Plus 7630
WD PC SN740 SDDPTQD-1T00
73.2 (70.67min - 73.2max) MB/s +9%
Medio WDC PC SN810 1TB
  (52.4 - 88, n=12)
71.3 MB/s +6%
Framework Laptop 16
WDC PC SN810 1TB
67.2 (66.93min - 67.19max) MB/s
HP Spectre x360 2-in-1 16-f1075ng
SK Hynix PC711 1TB HFS001TDE9X073N
60.8 (53.24min - 60.81max) MB/s -10%
Lenovo ThinkPad Z16 Gen 2
Kioxia XG8 KXG8AZNV1T02
57.1 (56.78min - 57.07max) MB/s -15%
4k q1 t1 write
MSI Prestige 16 B1MG-001US
Samsung PM9A1 MZVL22T0HBLB
202 (200.14min - 201.86max) MB/s +21%
Medio WDC PC SN810 1TB
  (85 - 305, n=12)
175.9 MB/s +5%
Framework Laptop 16
WDC PC SN810 1TB
167.4 (166.73min - 167.4max) MB/s
Dell Inspiron 16 Plus 7630
WD PC SN740 SDDPTQD-1T00
158.8 (155.42min - 158.82max) MB/s -5%
Lenovo ThinkPad Z16 Gen 2
Kioxia XG8 KXG8AZNV1T02
151.4 (148.6min - 151.39max) MB/s -10%
HP Spectre x360 2-in-1 16-f1075ng
SK Hynix PC711 1TB HFS001TDE9X073N
133.3 (120.98min - 133.34max) MB/s -20%
4k q32 t16 read
MSI Prestige 16 B1MG-001US
Samsung PM9A1 MZVL22T0HBLB
3839 (3251.93min - 3838.52max) MB/s +119%
Framework Laptop 16
WDC PC SN810 1TB
1754 (1748.82min - 1754.02max) MB/s
Medio WDC PC SN810 1TB
  (417 - 4245, n=12)
1460 MB/s -17%
Lenovo ThinkPad Z16 Gen 2
Kioxia XG8 KXG8AZNV1T02
1105 (1023.06min - 1104.63max) MB/s -37%
Dell Inspiron 16 Plus 7630
WD PC SN740 SDDPTQD-1T00
725 (704.24min - 724.66max) MB/s -59%
HP Spectre x360 2-in-1 16-f1075ng
SK Hynix PC711 1TB HFS001TDE9X073N
715 (657.06min - 714.84max) MB/s -59%
4k q32 t16 write
MSI Prestige 16 B1MG-001US
Samsung PM9A1 MZVL22T0HBLB
3063 (2744.16min - 3062.6max) MB/s +382%
Medio WDC PC SN810 1TB
  (162.3 - 2907, n=12)
859 MB/s +35%
Framework Laptop 16
WDC PC SN810 1TB
636 (609.51min - 636.01max) MB/s
Dell Inspiron 16 Plus 7630
WD PC SN740 SDDPTQD-1T00
513 (490.37min - 513.26max) MB/s -19%
Lenovo ThinkPad Z16 Gen 2
Kioxia XG8 KXG8AZNV1T02
458 (428.82min - 457.64max) MB/s -28%
HP Spectre x360 2-in-1 16-f1075ng
SK Hynix PC711 1TB HFS001TDE9X073N
389 (250.92min - 389.12max) MB/s -39%
AS SSD
Score Total
MSI Prestige 16 B1MG-001US
Samsung PM9A1 MZVL22T0HBLB
7524 Points +42%
HP Spectre x360 2-in-1 16-f1075ng
SK Hynix PC711 1TB HFS001TDE9X073N
6585 Points +25%
Medio WDC PC SN810 1TB
  (4112 - 8556, n=12)
5834 Points +10%
Framework Laptop 16
WDC PC SN810 1TB
5283 Points
Lenovo ThinkPad Z16 Gen 2
Kioxia XG8 KXG8AZNV1T02
4894 Points -7%
Dell Inspiron 16 Plus 7630
WD PC SN740 SDDPTQD-1T00
4383 Points -17%
Score Read
MSI Prestige 16 B1MG-001US
Samsung PM9A1 MZVL22T0HBLB
2677 Points +75%
HP Spectre x360 2-in-1 16-f1075ng
SK Hynix PC711 1TB HFS001TDE9X073N
2260 Points +47%
Medio WDC PC SN810 1TB
  (1211 - 3482, n=12)
1974 Points +29%
Framework Laptop 16
WDC PC SN810 1TB
1534 Points
Lenovo ThinkPad Z16 Gen 2
Kioxia XG8 KXG8AZNV1T02
1487 Points -3%
Dell Inspiron 16 Plus 7630
WD PC SN740 SDDPTQD-1T00
1459 Points -5%
Score Write
MSI Prestige 16 B1MG-001US
Samsung PM9A1 MZVL22T0HBLB
3528 Points +15%
HP Spectre x360 2-in-1 16-f1075ng
SK Hynix PC711 1TB HFS001TDE9X073N
3170 Points +4%
Framework Laptop 16
WDC PC SN810 1TB
3058 Points
Medio WDC PC SN810 1TB
  (2416 - 3341, n=12)
2940 Points -4%
Lenovo ThinkPad Z16 Gen 2
Kioxia XG8 KXG8AZNV1T02
2751 Points -10%
Dell Inspiron 16 Plus 7630
WD PC SN740 SDDPTQD-1T00
2233 Points -27%
Seq Read
MSI Prestige 16 B1MG-001US
Samsung PM9A1 MZVL22T0HBLB
5528.24 MB/s +6%
Framework Laptop 16
WDC PC SN810 1TB
5210.14 MB/s
Medio WDC PC SN810 1TB
  (3823 - 5642, n=12)
5185 MB/s 0%
Lenovo ThinkPad Z16 Gen 2
Kioxia XG8 KXG8AZNV1T02
4846.38 MB/s -7%
Dell Inspiron 16 Plus 7630
WD PC SN740 SDDPTQD-1T00
4349.04 MB/s -17%
HP Spectre x360 2-in-1 16-f1075ng
SK Hynix PC711 1TB HFS001TDE9X073N
2728.52 MB/s -48%
Seq Write
MSI Prestige 16 B1MG-001US
Samsung PM9A1 MZVL22T0HBLB
4449.45 MB/s +42%
Medio WDC PC SN810 1TB
  (2229 - 4795, n=12)
3152 MB/s 0%
Framework Laptop 16
WDC PC SN810 1TB
3139.42 MB/s
Dell Inspiron 16 Plus 7630
WD PC SN740 SDDPTQD-1T00
2904.62 MB/s -7%
HP Spectre x360 2-in-1 16-f1075ng
SK Hynix PC711 1TB HFS001TDE9X073N
2630.48 MB/s -16%
Lenovo ThinkPad Z16 Gen 2
Kioxia XG8 KXG8AZNV1T02
2533.8 MB/s -19%
4K Read
MSI Prestige 16 B1MG-001US
Samsung PM9A1 MZVL22T0HBLB
69.33 MB/s +26%
Medio WDC PC SN810 1TB
  (53 - 81.9, n=12)
67.8 MB/s +23%
Dell Inspiron 16 Plus 7630
WD PC SN740 SDDPTQD-1T00
65.43 MB/s +19%
HP Spectre x360 2-in-1 16-f1075ng
SK Hynix PC711 1TB HFS001TDE9X073N
61.52 MB/s +12%
Framework Laptop 16
WDC PC SN810 1TB
55.09 MB/s
Lenovo ThinkPad Z16 Gen 2
Kioxia XG8 KXG8AZNV1T02
54.93 MB/s 0%
4K Write
HP Spectre x360 2-in-1 16-f1075ng
SK Hynix PC711 1TB HFS001TDE9X073N
239.47 MB/s +58%
Dell Inspiron 16 Plus 7630
WD PC SN740 SDDPTQD-1T00
225.06 MB/s +48%
Medio WDC PC SN810 1TB
  (139 - 303, n=12)
212 MB/s +40%
MSI Prestige 16 B1MG-001US
Samsung PM9A1 MZVL22T0HBLB
178.71 MB/s +18%
Lenovo ThinkPad Z16 Gen 2
Kioxia XG8 KXG8AZNV1T02
168.76 MB/s +11%
Framework Laptop 16
WDC PC SN810 1TB
151.65 MB/s
4K-64 Read
MSI Prestige 16 B1MG-001US
Samsung PM9A1 MZVL22T0HBLB
2054.46 MB/s +115%
HP Spectre x360 2-in-1 16-f1075ng
SK Hynix PC711 1TB HFS001TDE9X073N
1925.49 MB/s +101%
Medio WDC PC SN810 1TB
  (624 - 2855, n=12)
1388 MB/s +45%
Dell Inspiron 16 Plus 7630
WD PC SN740 SDDPTQD-1T00
959.03 MB/s 0%
Framework Laptop 16
WDC PC SN810 1TB
957.67 MB/s
Lenovo ThinkPad Z16 Gen 2
Kioxia XG8 KXG8AZNV1T02
947.86 MB/s -1%
4K-64 Write
MSI Prestige 16 B1MG-001US
Samsung PM9A1 MZVL22T0HBLB
2904.81 MB/s +12%
HP Spectre x360 2-in-1 16-f1075ng
SK Hynix PC711 1TB HFS001TDE9X073N
2667.24 MB/s +3%
Framework Laptop 16
WDC PC SN810 1TB
2592.65 MB/s
Medio WDC PC SN810 1TB
  (2017 - 2749, n=12)
2413 MB/s -7%
Lenovo ThinkPad Z16 Gen 2
Kioxia XG8 KXG8AZNV1T02
2329.29 MB/s -10%
Dell Inspiron 16 Plus 7630
WD PC SN740 SDDPTQD-1T00
1717.85 MB/s -34%
Access Time Read
Lenovo ThinkPad Z16 Gen 2
Kioxia XG8 KXG8AZNV1T02
0.08 ms * -3%
Framework Laptop 16
WDC PC SN810 1TB
0.078 ms *
Medio WDC PC SN810 1TB
  (0.023 - 0.09, n=12)
0.0595 ms * +24%
Dell Inspiron 16 Plus 7630
WD PC SN740 SDDPTQD-1T00
0.057 ms * +27%
HP Spectre x360 2-in-1 16-f1075ng
SK Hynix PC711 1TB HFS001TDE9X073N
0.041 ms * +47%
MSI Prestige 16 B1MG-001US
Samsung PM9A1 MZVL22T0HBLB
0.037 ms * +53%
Access Time Write
Framework Laptop 16
WDC PC SN810 1TB
0.074 ms *
Dell Inspiron 16 Plus 7630
WD PC SN740 SDDPTQD-1T00
0.07 ms * +5%
Lenovo ThinkPad Z16 Gen 2
Kioxia XG8 KXG8AZNV1T02
0.07 ms * +5%
MSI Prestige 16 B1MG-001US
Samsung PM9A1 MZVL22T0HBLB
0.068 ms * +8%
Medio WDC PC SN810 1TB
  (0.012 - 0.074, n=12)
0.02892 ms * +61%
HP Spectre x360 2-in-1 16-f1075ng
SK Hynix PC711 1TB HFS001TDE9X073N
0.018 ms * +76%

* ... más pequeño es mejor

Disk Throttling: DiskSpd Read Loop, Queue Depth 8

035070010501400175021002450280031503500385042004550490052505600595063006650Tooltip
Framework Laptop 16 WDC PC SN810 1TB; diskspd 2.0.17 f: Ø6942 (5968.3-6963.38)
HP Pavilion Plus 14-ey0095cl WDC PC SN810 1TB: Ø4588 (313.32-6954.37)

Rendimiento de la GPU - RDNA 3 al rescate

La RDNA 3 Radeon RX 7700S sucede directamente a la RDNA 2 del año pasado Radeon RX 6700S. Sin embargo, la nueva arquitectura no ha mejorado mucho el rendimiento, a menos que el juego admita DX12; los resultados de 3DMark Fire Strike son casi idénticos entre las dos GPU, mientras que los de Time Spy son entre un 20 y un 25 por ciento más rápidos que antes. Las mayores ganancias se aprecian en el rendimiento RT, ya que éste era un punto débil con la antigua arquitectura RDNA 2. El rendimiento general es más comparable al de un portátil con GeForce RTX 4060 como el Lenovo Legion Slim 7 16.

Incluso con la dGPU eliminada, la Radeon RX 780M iGPU sigue siendo más que capaz de potenciar las tareas multimedia. La GPU de AMD sigue siendo una de las soluciones iGPU más rápidas disponibles, aunque recientemente ha sido superada por la Serie Arc de Intel.

Ejecutar en modo Windows Balanced en lugar de en modo Performance no parece afectar al rendimiento, como muestra nuestra tabla de resultados Fire Strike que aparece a continuación. Ejecutar en batería reduciría el rendimiento en un 15 por ciento aproximadamente.

Perfil de potenciaPuntuación de gráficosPuntuación físicaPuntuación combinada
Rendimiento242462948710294
Equilibrado24125 (-0%)29101 (-0%)10389 (-0%)
Modo batería20380 (-16%)25009 (-15%)6769 (-34%)


3DMark 11
3DMark 11
Time Spy
Time Spy
Port Royal
Port Royal
Fire Strike
Fire Strike
Fire Strike Ultra
Fire Strike Ultra
Vía rápida
Vía rápida
3DMark Performance Rating - Percent
Asus Zephyrus Duo 16 GX650PY-NM006W
NVIDIA GeForce RTX 4090 Laptop GPU, AMD Ryzen 9 7945HX
99.2 pt
Alienware m18 R1 AMD -1!
AMD Radeon RX 7900M, AMD Ryzen 9 7945HX
95.2 pt
Alienware m16 R1 AMD
NVIDIA GeForce RTX 4080 Laptop GPU, AMD Ryzen 9 7845HX
92.9 pt
MSI Stealth 16 Mercedes-AMG Motorsport A13VG -2!
NVIDIA GeForce RTX 4070 Laptop GPU, Intel Core i9-13900H
58.7 pt
Lenovo Legion Slim 7 16APH8 -1!
NVIDIA GeForce RTX 4060 Laptop GPU, AMD Ryzen 7 7840HS
51.3 pt
Framework Laptop 16
AMD Radeon RX 7700S, AMD Ryzen 9 7940HS
48.7 pt
Medio AMD Radeon RX 7700S
 
48.7 pt
Asus ROG Zephyrus G14 GA402RJ -1!
AMD Radeon RX 6700S, AMD Ryzen 7 6800HS
43.6 pt
Dell Inspiron 16 Plus 7630
NVIDIA GeForce RTX 4060 Laptop GPU, Intel Core i7-13700H
41.6 pt
Lenovo ThinkPad Z16 Gen 2 -1!
AMD Radeon RX 6550M, AMD Ryzen 9 PRO 7940HS
24.8 pt
MSI Prestige 16 B1MG-001US -2!
Intel Arc 8-Core iGPU, Intel Core Ultra 7 155H
19 pt
Acer Swift Edge SFE16-42-R1GM -2!
AMD Radeon 680M, AMD Ryzen 7 7735U
13.5 pt
Acer Swift Edge SFE16 Ryzen 7 7840U -1!
AMD Radeon 780M, AMD Ryzen 7 7840U
13 pt
HP Spectre x360 2-in-1 16-f1075ng -2!
Intel Iris Xe Graphics G7 96EUs, Intel Core i7-12700H
9 pt
3DMark
1920x1080 Fire Strike Graphics
Alienware m18 R1 AMD
AMD Radeon RX 7900M, AMD Ryzen 9 7945HX
50241 Points +107%
Asus Zephyrus Duo 16 GX650PY-NM006W
NVIDIA GeForce RTX 4090 Laptop GPU, AMD Ryzen 9 7945HX
47798 Points +97%
Alienware m16 R1 AMD
NVIDIA GeForce RTX 4080 Laptop GPU, AMD Ryzen 9 7845HX
44782 Points +85%
MSI Stealth 16 Mercedes-AMG Motorsport A13VG
NVIDIA GeForce RTX 4070 Laptop GPU, Intel Core i9-13900H
28723 Points +18%
Lenovo Legion Slim 7 16APH8
NVIDIA GeForce RTX 4060 Laptop GPU, AMD Ryzen 7 7840HS
26480 Points +9%
Framework Laptop 16
AMD Radeon RX 7700S, AMD Ryzen 9 7940HS
24246 Points
Medio AMD Radeon RX 7700S
  ()
24246 Points 0%
Asus ROG Zephyrus G14 GA402RJ
AMD Radeon RX 6700S, AMD Ryzen 7 6800HS
24135 Points 0%
Dell Inspiron 16 Plus 7630
NVIDIA GeForce RTX 4060 Laptop GPU, Intel Core i7-13700H
21600 Points -11%
Lenovo ThinkPad Z16 Gen 2
AMD Radeon RX 6550M, AMD Ryzen 9 PRO 7940HS
14696 Points -39%
MSI Prestige 16 B1MG-001US
Intel Arc 8-Core iGPU, Intel Core Ultra 7 155H
8796 Points -64%
Acer Swift Edge SFE16 Ryzen 7 7840U
AMD Radeon 780M, AMD Ryzen 7 7840U
7156 Points -70%
Acer Swift Edge SFE16-42-R1GM
AMD Radeon 680M, AMD Ryzen 7 7735U
6777 Points -72%
HP Spectre x360 2-in-1 16-f1075ng
Intel Iris Xe Graphics G7 96EUs, Intel Core i7-12700H
4629 Points -81%
2560x1440 Time Spy Graphics
Asus Zephyrus Duo 16 GX650PY-NM006W
NVIDIA GeForce RTX 4090 Laptop GPU, AMD Ryzen 9 7945HX
20033 Points +96%
Alienware m18 R1 AMD
AMD Radeon RX 7900M, AMD Ryzen 9 7945HX
19434 Points +90%
Alienware m16 R1 AMD
NVIDIA GeForce RTX 4080 Laptop GPU, AMD Ryzen 9 7845HX
19365 Points +90%
MSI Stealth 16 Mercedes-AMG Motorsport A13VG
NVIDIA GeForce RTX 4070 Laptop GPU, Intel Core i9-13900H
11717 Points +15%
Framework Laptop 16
AMD Radeon RX 7700S, AMD Ryzen 9 7940HS
10206 Points
Medio AMD Radeon RX 7700S
  ()
10206 Points 0%
Lenovo Legion Slim 7 16APH8
NVIDIA GeForce RTX 4060 Laptop GPU, AMD Ryzen 7 7840HS
9783 Points -4%
Asus ROG Zephyrus G14 GA402RJ
AMD Radeon RX 6700S, AMD Ryzen 7 6800HS
8316 Points -19%
Dell Inspiron 16 Plus 7630
NVIDIA GeForce RTX 4060 Laptop GPU, Intel Core i7-13700H
7877 Points -23%
Lenovo ThinkPad Z16 Gen 2
AMD Radeon RX 6550M, AMD Ryzen 9 PRO 7940HS
4546 Points -55%
MSI Prestige 16 B1MG-001US
Intel Arc 8-Core iGPU, Intel Core Ultra 7 155H
3511 Points -66%
Acer Swift Edge SFE16 Ryzen 7 7840U
AMD Radeon 780M, AMD Ryzen 7 7840U
2363 Points -77%
Acer Swift Edge SFE16-42-R1GM
AMD Radeon 680M, AMD Ryzen 7 7735U
2276 Points -78%
HP Spectre x360 2-in-1 16-f1075ng
Intel Iris Xe Graphics G7 96EUs, Intel Core i7-12700H
1444 Points -86%
2560x1440 Time Spy Score
Asus Zephyrus Duo 16 GX650PY-NM006W
NVIDIA GeForce RTX 4090 Laptop GPU, AMD Ryzen 9 7945HX
18602 Points +81%
Alienware m18 R1 AMD
AMD Radeon RX 7900M, AMD Ryzen 9 7945HX
18114 Points +76%
Alienware m16 R1 AMD
NVIDIA GeForce RTX 4080 Laptop GPU, AMD Ryzen 9 7845HX
17719 Points +72%
MSI Stealth 16 Mercedes-AMG Motorsport A13VG
NVIDIA GeForce RTX 4070 Laptop GPU, Intel Core i9-13900H
11694 Points +14%
Framework Laptop 16
AMD Radeon RX 7700S, AMD Ryzen 9 7940HS
10294 Points
Medio AMD Radeon RX 7700S
  ()
10294 Points 0%
Lenovo Legion Slim 7 16APH8
NVIDIA GeForce RTX 4060 Laptop GPU, AMD Ryzen 7 7840HS
10032 Points -3%
Asus ROG Zephyrus G14 GA402RJ
AMD Radeon RX 6700S, AMD Ryzen 7 6800HS
8547 Points -17%
Dell Inspiron 16 Plus 7630
NVIDIA GeForce RTX 4060 Laptop GPU, Intel Core i7-13700H
8240 Points -20%
Lenovo ThinkPad Z16 Gen 2
AMD Radeon RX 6550M, AMD Ryzen 9 PRO 7940HS
4955 Points -52%
MSI Prestige 16 B1MG-001US
Intel Arc 8-Core iGPU, Intel Core Ultra 7 155H
3906 Points -62%
Acer Swift Edge SFE16 Ryzen 7 7840U
AMD Radeon 780M, AMD Ryzen 7 7840U
2613 Points -75%
Acer Swift Edge SFE16-42-R1GM
AMD Radeon 680M, AMD Ryzen 7 7735U
2532 Points -75%
HP Spectre x360 2-in-1 16-f1075ng
Intel Iris Xe Graphics G7 96EUs, Intel Core i7-12700H
1645 Points -84%
2560x1440 Speed Way Score
Asus Zephyrus Duo 16 GX650PY-NM006W
NVIDIA GeForce RTX 4090 Laptop GPU, AMD Ryzen 9 7945HX
5208 Points +179%
Alienware m16 R1 AMD
NVIDIA GeForce RTX 4080 Laptop GPU, AMD Ryzen 9 7845HX
4739 Points +154%
Dell Inspiron 16 Plus 7630
NVIDIA GeForce RTX 4060 Laptop GPU, Intel Core i7-13700H
2041 Points +9%
Framework Laptop 16
AMD Radeon RX 7700S, AMD Ryzen 9 7940HS
1869 Points
Medio AMD Radeon RX 7700S
  ()
1869 Points 0%
Acer Swift Edge SFE16 Ryzen 7 7840U
AMD Radeon 780M, AMD Ryzen 7 7840U
329 Points -82%
2560x1440 Port Royal Graphics
Asus Zephyrus Duo 16 GX650PY-NM006W
NVIDIA GeForce RTX 4090 Laptop GPU, AMD Ryzen 9 7945HX
12649 Points +144%
Alienware m16 R1 AMD
NVIDIA GeForce RTX 4080 Laptop GPU, AMD Ryzen 9 7845HX
11979 Points +131%
Alienware m18 R1 AMD
AMD Radeon RX 7900M, AMD Ryzen 9 7945HX
10814 Points +109%
MSI Stealth 16 Mercedes-AMG Motorsport A13VG
NVIDIA GeForce RTX 4070 Laptop GPU, Intel Core i9-13900H
7121 Points +37%
Lenovo Legion Slim 7 16APH8
NVIDIA GeForce RTX 4060 Laptop GPU, AMD Ryzen 7 7840HS
5528 Points +7%
Framework Laptop 16
AMD Radeon RX 7700S, AMD Ryzen 9 7940HS
5184 Points
Medio AMD Radeon RX 7700S
  ()
5184 Points 0%
Dell Inspiron 16 Plus 7630
NVIDIA GeForce RTX 4060 Laptop GPU, Intel Core i7-13700H
4806 Points -7%
Asus ROG Zephyrus G14 GA402RJ
AMD Radeon RX 6700S, AMD Ryzen 7 6800HS
3803 Points -27%
Lenovo ThinkPad Z16 Gen 2
AMD Radeon RX 6550M, AMD Ryzen 9 PRO 7940HS
1572 Points -70%
3DMark 11 - 1280x720 Performance GPU
Asus Zephyrus Duo 16 GX650PY-NM006W
NVIDIA GeForce RTX 4090 Laptop GPU, AMD Ryzen 9 7945HX
62240 Points +64%
Alienware m18 R1 AMD
AMD Radeon RX 7900M, AMD Ryzen 9 7945HX
59943 Points +58%
Alienware m16 R1 AMD
NVIDIA GeForce RTX 4080 Laptop GPU, AMD Ryzen 9 7845HX
56373 Points +49%
Framework Laptop 16
AMD Radeon RX 7700S, AMD Ryzen 9 7940HS
37918 Points
Medio AMD Radeon RX 7700S
  ()
37918 Points 0%
Lenovo Legion Slim 7 16APH8
NVIDIA GeForce RTX 4060 Laptop GPU, AMD Ryzen 7 7840HS
35602 Points -6%
Asus ROG Zephyrus G14 GA402RJ
AMD Radeon RX 6700S, AMD Ryzen 7 6800HS
32662 Points -14%
Dell Inspiron 16 Plus 7630
NVIDIA GeForce RTX 4060 Laptop GPU, Intel Core i7-13700H
28621 Points -25%
Lenovo ThinkPad Z16 Gen 2
AMD Radeon RX 6550M, AMD Ryzen 9 PRO 7940HS
20506 Points -46%
MSI Prestige 16 B1MG-001US
Intel Arc 8-Core iGPU, Intel Core Ultra 7 155H
12520 Points -67%
Acer Swift Edge SFE16 Ryzen 7 7840U
AMD Radeon 780M, AMD Ryzen 7 7840U
11636 Points -69%
Acer Swift Edge SFE16-42-R1GM
AMD Radeon 680M, AMD Ryzen 7 7735U
9702 Points -74%
HP Spectre x360 2-in-1 16-f1075ng
Intel Iris Xe Graphics G7 96EUs, Intel Core i7-12700H
6582 Points -83%
3DMark 11 Performance
32427 puntos
3DMark Fire Strike Score
21865 puntos
3DMark Time Spy Score
10294 puntos
ayuda
Blender
v3.3 Classroom METAL
Apple MacBook Pro 16 2023 M3 Max
Apple M3 Max 40-Core GPU, Apple M3 Max 16-Core
32 Seconds *
v3.3 Classroom HIP/AMD
Acer Swift Edge SFE16-42-R1GM
AMD Radeon 680M, AMD Ryzen 7 7735U
347 Seconds *
v3.3 Classroom OPTIX/RTX
Dell Inspiron 16 Plus 7630
NVIDIA GeForce RTX 4060 Laptop GPU, Intel Core i7-13700H
27 Seconds *
Lenovo Legion Slim 7 16APH8
NVIDIA GeForce RTX 4060 Laptop GPU, AMD Ryzen 7 7840HS
24 Seconds *
MSI Stealth 16 Mercedes-AMG Motorsport A13VG
NVIDIA GeForce RTX 4070 Laptop GPU, Intel Core i9-13900H
23 Seconds *
Alienware m16 R1 AMD
NVIDIA GeForce RTX 4080 Laptop GPU, AMD Ryzen 9 7845HX
16 Seconds *
Asus Zephyrus Duo 16 GX650PY-NM006W
NVIDIA GeForce RTX 4090 Laptop GPU, AMD Ryzen 9 7945HX
13 Seconds *
v3.3 Classroom CUDA
Dell Inspiron 16 Plus 7630
NVIDIA GeForce RTX 4060 Laptop GPU, Intel Core i7-13700H
49 Seconds *
Lenovo Legion Slim 7 16APH8
NVIDIA GeForce RTX 4060 Laptop GPU, AMD Ryzen 7 7840HS
44 Seconds *
MSI Stealth 16 Mercedes-AMG Motorsport A13VG
NVIDIA GeForce RTX 4070 Laptop GPU, Intel Core i9-13900H
36 Seconds *
Alienware m16 R1 AMD
NVIDIA GeForce RTX 4080 Laptop GPU, AMD Ryzen 9 7845HX
23 Seconds *
Asus Zephyrus Duo 16 GX650PY-NM006W
NVIDIA GeForce RTX 4090 Laptop GPU, AMD Ryzen 9 7945HX
20 Seconds *
v3.3 Classroom CPU
Acer Swift Edge SFE16-42-R1GM
AMD Radeon 680M, AMD Ryzen 7 7735U
540 Seconds * -74%
HP Spectre x360 2-in-1 16-f1075ng
Intel Iris Xe Graphics G7 96EUs, Intel Core i7-12700H
487 Seconds * -57%
Dell Inspiron 16 Plus 7630
NVIDIA GeForce RTX 4060 Laptop GPU, Intel Core i7-13700H
400 Seconds * -29%
MSI Stealth 16 Mercedes-AMG Motorsport A13VG
NVIDIA GeForce RTX 4070 Laptop GPU, Intel Core i9-13900H
399 Seconds * -28%
MSI Prestige 16 B1MG-001US
Intel Arc 8-Core iGPU, Intel Core Ultra 7 155H
374 Seconds * -20%
Lenovo Legion Slim 7 16APH8
NVIDIA GeForce RTX 4060 Laptop GPU, AMD Ryzen 7 7840HS
315 Seconds * -1%
Framework Laptop 16
AMD Radeon RX 7700S, AMD Ryzen 9 7940HS
311 Seconds *
Lenovo ThinkPad Z16 Gen 2
AMD Radeon RX 6550M, AMD Ryzen 9 PRO 7940HS
305 Seconds * +2%
Apple MacBook Pro 16 2023 M3 Max
Apple M3 Max 40-Core GPU, Apple M3 Max 16-Core
194 Seconds * +38%
Alienware m16 R1 AMD
NVIDIA GeForce RTX 4080 Laptop GPU, AMD Ryzen 9 7845HX
185 Seconds * +41%
Asus Zephyrus Duo 16 GX650PY-NM006W
NVIDIA GeForce RTX 4090 Laptop GPU, AMD Ryzen 9 7945HX
147 Seconds * +53%
Alienware m18 R1 AMD
AMD Radeon RX 7900M, AMD Ryzen 9 7945HX
138 Seconds * +56%

* ... más pequeño es mejor

Rendimiento en juegos

El rendimiento en juegos de la Radeon RX 7700S de 100 W está entre un 10 y un 30 por ciento por detrás de la GeForce RTX 4060 móvil, dependiendo del TDP. Por ejemplo, el rendimiento está mucho más cerca del de la RTX 4060 de 60 W del Dell Inspiron 16 Plus 7630 mientras que la RTX 4060 de 140 W superaría a nuestra Radeon por márgenes más amplios. Por tanto, espere que el rendimiento en juegos se sitúe entre la rTX 4050 móvil y la RTX 4060 móvil.

El rendimiento también sería sólo ligeramente superior al de la Radeon RX 6700S del año pasado en la mayoría de los títulos probados. Las mayores ganancias se aprecian cuando se activa RT, tal y como predice 3DMark. F1 22, por ejemplo, se ejecutaría entre un 30 y un 40 por ciento más rápido que antes cuando su configuración RT está activa, en comparación con las ganancias más leves de entre un 5 y un 15 por ciento cuando la configuración RT está desactivada.

Performance Rating - Percent
Asus Zephyrus Duo 16 GX650PY-NM006W
AMD Ryzen 9 7945HX, NVIDIA GeForce RTX 4090 Laptop GPU
98.9 pt
Alienware m16 R1 AMD -1!
AMD Ryzen 9 7845HX, NVIDIA GeForce RTX 4080 Laptop GPU
96.3 pt
Alienware m18 R1 AMD
AMD Ryzen 9 7945HX, AMD Radeon RX 7900M
85.2 pt
MSI Stealth 16 Mercedes-AMG Motorsport A13VG
Intel Core i9-13900H, NVIDIA GeForce RTX 4070 Laptop GPU
67.2 pt
Lenovo Legion Slim 7 16APH8 -1!
AMD Ryzen 7 7840HS, NVIDIA GeForce RTX 4060 Laptop GPU
65.4 pt
Dell Inspiron 16 Plus 7630 -1!
Intel Core i7-13700H, NVIDIA GeForce RTX 4060 Laptop GPU
64.6 pt
Framework Laptop 16
AMD Ryzen 9 7940HS, AMD Radeon RX 7700S
55.7 pt
Asus ROG Zephyrus G14 GA402RJ
AMD Ryzen 7 6800HS, AMD Radeon RX 6700S
49 pt
Apple MacBook Pro 16 2023 M3 Max -4!
Apple M3 Max 16-Core, Apple M3 Max 40-Core GPU
39.1 pt
Lenovo ThinkPad Z16 Gen 2 -1!
AMD Ryzen 9 PRO 7940HS, AMD Radeon RX 6550M
33.2 pt
MSI Prestige 16 B1MG-001US -1!
Intel Core Ultra 7 155H, Intel Arc 8-Core iGPU
23.1 pt
Acer Swift Edge SFE16 Ryzen 7 7840U
AMD Ryzen 7 7840U, AMD Radeon 780M
18.5 pt
Acer Swift Edge SFE16-42-R1GM
AMD Ryzen 7 7735U, AMD Radeon 680M
17.8 pt
HP Spectre x360 2-in-1 16-f1075ng
Intel Core i7-12700H, Intel Iris Xe Graphics G7 96EUs
14.8 pt
The Witcher 3 - 1920x1080 Ultra Graphics & Postprocessing (HBAO+)
Asus Zephyrus Duo 16 GX650PY-NM006W
AMD Ryzen 9 7945HX, NVIDIA GeForce RTX 4090 Laptop GPU
178.6 (172min, 173P1) fps +113%
Alienware m16 R1 AMD
AMD Ryzen 9 7845HX, NVIDIA GeForce RTX 4080 Laptop GPU
169.7 (161min) fps +102%
Alienware m18 R1 AMD
AMD Ryzen 9 7945HX, AMD Radeon RX 7900M
167.7 (134min) fps +100%
MSI Stealth 16 Mercedes-AMG Motorsport A13VG
Intel Core i9-13900H, NVIDIA GeForce RTX 4070 Laptop GPU
110 fps +31%
Lenovo Legion Slim 7 16APH8
AMD Ryzen 7 7840HS, NVIDIA GeForce RTX 4060 Laptop GPU
98 fps +17%
Dell Inspiron 16 Plus 7630
Intel Core i7-13700H, NVIDIA GeForce RTX 4060 Laptop GPU
90.9 (85min) fps +8%
Asus ROG Zephyrus G14 GA402RJ
AMD Ryzen 7 6800HS, AMD Radeon RX 6700S
84.3 (69min) fps 0%
Framework Laptop 16
AMD Ryzen 9 7940HS, AMD Radeon RX 7700S
84 (79min) fps
Apple MacBook Pro 16 2023 M3 Max
Apple M3 Max 16-Core, Apple M3 Max 40-Core GPU
69 fps -18%
Lenovo ThinkPad Z16 Gen 2
AMD Ryzen 9 PRO 7940HS, AMD Radeon RX 6550M
49.4 (42min) fps -41%
MSI Prestige 16 B1MG-001US
Intel Core Ultra 7 155H, Intel Arc 8-Core iGPU
25.2 (22min) fps -70%
Acer Swift Edge SFE16 Ryzen 7 7840U
AMD Ryzen 7 7840U, AMD Radeon 780M
20.4 (18min) fps -76%
Acer Swift Edge SFE16-42-R1GM
AMD Ryzen 7 7735U, AMD Radeon 680M
20.3 fps -76%
HP Spectre x360 2-in-1 16-f1075ng
Intel Core i7-12700H, Intel Iris Xe Graphics G7 96EUs
12.8 (4.76min, 5.9P0.1, 7.32P1) fps -85%
GTA V - 1920x1080 Highest Settings possible AA:4xMSAA + FX AF:16x
Asus Zephyrus Duo 16 GX650PY-NM006W
AMD Ryzen 9 7945HX, NVIDIA GeForce RTX 4090 Laptop GPU
134 (7.27min, 90.9P1) fps +40%
Alienware m18 R1 AMD
AMD Ryzen 9 7945HX, AMD Radeon RX 7900M
105 (4.76min, 62.5P1) fps +10%
Lenovo Legion Slim 7 16APH8
AMD Ryzen 7 7840HS, NVIDIA GeForce RTX 4060 Laptop GPU
103.2 (16.4min, 71.4P1) fps +8%
MSI Stealth 16 Mercedes-AMG Motorsport A13VG
Intel Core i9-13900H, NVIDIA GeForce RTX 4070 Laptop GPU
100.3 (24.9min, 71.4P1) fps +5%
Framework Laptop 16
AMD Ryzen 9 7940HS, AMD Radeon RX 7700S
95.8 (13min, 58.8P1) fps
Asus ROG Zephyrus G14 GA402RJ
AMD Ryzen 7 6800HS, AMD Radeon RX 6700S
81.3 (9.16min, 55.6P1) fps -15%
Apple MacBook Pro 16 2023 M3 Max
Apple M3 Max 16-Core, Apple M3 Max 40-Core GPU
53 fps -45%
Acer Swift Edge SFE16 Ryzen 7 7840U
AMD Ryzen 7 7840U, AMD Radeon 780M
21 (3.16min, 14.5P1) fps -78%
Acer Swift Edge SFE16-42-R1GM
AMD Ryzen 7 7735U, AMD Radeon 680M
19.4 (3.62min, 14.1P1) fps -80%
HP Spectre x360 2-in-1 16-f1075ng
Intel Core i7-12700H, Intel Iris Xe Graphics G7 96EUs
7.07 (3.18min, 4.26P1) fps -93%
Final Fantasy XV Benchmark - 1920x1080 High Quality
Asus Zephyrus Duo 16 GX650PY-NM006W
AMD Ryzen 9 7945HX, NVIDIA GeForce RTX 4090 Laptop GPU
169.6 fps +127%
Alienware m16 R1 AMD
AMD Ryzen 9 7845HX, NVIDIA GeForce RTX 4080 Laptop GPU
167.6 fps +124%
Alienware m18 R1 AMD
AMD Ryzen 9 7945HX, AMD Radeon RX 7900M
152.8 fps +104%
MSI Stealth 16 Mercedes-AMG Motorsport A13VG
Intel Core i9-13900H, NVIDIA GeForce RTX 4070 Laptop GPU
101.4 fps +36%
Dell Inspiron 16 Plus 7630
Intel Core i7-13700H, NVIDIA GeForce RTX 4060 Laptop GPU
88.9 fps +19%
Asus ROG Zephyrus G14 GA402RJ
AMD Ryzen 7 6800HS, AMD Radeon RX 6700S
78.6 fps +5%
Framework Laptop 16
AMD Ryzen 9 7940HS, AMD Radeon RX 7700S
74.8 fps
Lenovo ThinkPad Z16 Gen 2
AMD Ryzen 9 PRO 7940HS, AMD Radeon RX 6550M
47.8 fps -36%
MSI Prestige 16 B1MG-001US
Intel Core Ultra 7 155H, Intel Arc 8-Core iGPU
24.6 fps -67%
Acer Swift Edge SFE16 Ryzen 7 7840U
AMD Ryzen 7 7840U, AMD Radeon 780M
21.2 fps -72%
Acer Swift Edge SFE16-42-R1GM
AMD Ryzen 7 7735U, AMD Radeon 680M
19.3 fps -74%
HP Spectre x360 2-in-1 16-f1075ng
Intel Core i7-12700H, Intel Iris Xe Graphics G7 96EUs
14.6 fps -80%
Strange Brigade - 1920x1080 ultra AA:ultra AF:16
Alienware m16 R1 AMD
AMD Ryzen 9 7845HX, NVIDIA GeForce RTX 4080 Laptop GPU
357 (82.8min, 253P1) fps +148%
Alienware m18 R1 AMD
AMD Ryzen 9 7945HX, AMD Radeon RX 7900M
344 (145.8min, 227P1) fps +139%
Asus Zephyrus Duo 16 GX650PY-NM006W
AMD Ryzen 9 7945HX, NVIDIA GeForce RTX 4090 Laptop GPU
333 (38min, 227P1) fps +131%
MSI Stealth 16 Mercedes-AMG Motorsport A13VG
Intel Core i9-13900H, NVIDIA GeForce RTX 4070 Laptop GPU
190.6 (88.3min, 142.9P1) fps +32%
Lenovo Legion Slim 7 16APH8
AMD Ryzen 7 7840HS, NVIDIA GeForce RTX 4060 Laptop GPU
180.8 (22.8min, 134P1) fps +26%
Dell Inspiron 16 Plus 7630
Intel Core i7-13700H, NVIDIA GeForce RTX 4060 Laptop GPU
161 (79.8min, 120.7P1) fps +12%
Asus ROG Zephyrus G14 GA402RJ
AMD Ryzen 7 6800HS, AMD Radeon RX 6700S
157.3 (108.2min, 113.2P1) fps +9%
Framework Laptop 16
AMD Ryzen 9 7940HS, AMD Radeon RX 7700S
143.9 (84.9min, 104.3P1) fps
Lenovo ThinkPad Z16 Gen 2
AMD Ryzen 9 PRO 7940HS, AMD Radeon RX 6550M
88.4 (66.9min, 70.8P1) fps -39%
MSI Prestige 16 B1MG-001US
Intel Core Ultra 7 155H, Intel Arc 8-Core iGPU
46.1 (5min, 20.8P1) fps -68%
Acer Swift Edge SFE16 Ryzen 7 7840U
AMD Ryzen 7 7840U, AMD Radeon 780M
41.3 (7.5min, 9.37P1) fps -71%
Acer Swift Edge SFE16-42-R1GM
AMD Ryzen 7 7735U, AMD Radeon 680M
36.4 (6.6min, 8.1P1) fps -75%
HP Spectre x360 2-in-1 16-f1075ng
Intel Core i7-12700H, Intel Iris Xe Graphics G7 96EUs
23.7 (7.7min, 9.06P1) fps -84%
Dota 2 Reborn - 1920x1080 ultra (3/3) best looking
Asus Zephyrus Duo 16 GX650PY-NM006W
AMD Ryzen 9 7945HX, NVIDIA GeForce RTX 4090 Laptop GPU
179.7 (153.7min) fps +31%
Alienware m16 R1 AMD
AMD Ryzen 9 7845HX, NVIDIA GeForce RTX 4080 Laptop GPU
164.7 (138.5min) fps +20%
Alienware m18 R1 AMD
AMD Ryzen 9 7945HX, AMD Radeon RX 7900M
146.2 (121.3min) fps +7%
Dell Inspiron 16 Plus 7630
Intel Core i7-13700H, NVIDIA GeForce RTX 4060 Laptop GPU
146.1 (126.2min) fps +7%
Framework Laptop 16
AMD Ryzen 9 7940HS, AMD Radeon RX 7700S
136.8 (116min) fps
Lenovo Legion Slim 7 16APH8
AMD Ryzen 7 7840HS, NVIDIA GeForce RTX 4060 Laptop GPU
134.7 (118.5min) fps -2%
MSI Stealth 16 Mercedes-AMG Motorsport A13VG
Intel Core i9-13900H, NVIDIA GeForce RTX 4070 Laptop GPU
126.9 (109.4min) fps -7%
Asus ROG Zephyrus G14 GA402RJ
AMD Ryzen 7 6800HS, AMD Radeon RX 6700S
103 (86.9min) fps -25%
Lenovo ThinkPad Z16 Gen 2
AMD Ryzen 9 PRO 7940HS, AMD Radeon RX 6550M
103 (86.2min) fps -25%
MSI Prestige 16 B1MG-001US
Intel Core Ultra 7 155H, Intel Arc 8-Core iGPU
75.6 (49.1min) fps -45%
Acer Swift Edge SFE16 Ryzen 7 7840U
AMD Ryzen 7 7840U, AMD Radeon 780M
61.4 (52min) fps -55%
Acer Swift Edge SFE16-42-R1GM
AMD Ryzen 7 7735U, AMD Radeon 680M
61 (52.3min) fps -55%
HP Spectre x360 2-in-1 16-f1075ng
Intel Core i7-12700H, Intel Iris Xe Graphics G7 96EUs
48.8 (44.1min) fps -64%
X-Plane 11.11 - 1920x1080 high (fps_test=3)
Asus Zephyrus Duo 16 GX650PY-NM006W
AMD Ryzen 9 7945HX, NVIDIA GeForce RTX 4090 Laptop GPU
117.8 fps +81%
Alienware m16 R1 AMD
AMD Ryzen 9 7845HX, NVIDIA GeForce RTX 4080 Laptop GPU
113.1 fps +74%
Dell Inspiron 16 Plus 7630
Intel Core i7-13700H, NVIDIA GeForce RTX 4060 Laptop GPU
109.7 fps +69%
MSI Stealth 16 Mercedes-AMG Motorsport A13VG
Intel Core i9-13900H, NVIDIA GeForce RTX 4070 Laptop GPU
98 fps +51%
Alienware m18 R1 AMD
AMD Ryzen 9 7945HX, AMD Radeon RX 7900M
83.7 fps +29%
Lenovo Legion Slim 7 16APH8
AMD Ryzen 7 7840HS, NVIDIA GeForce RTX 4060 Laptop GPU
81.6 fps +26%
Framework Laptop 16
AMD Ryzen 9 7940HS, AMD Radeon RX 7700S
65 fps
Asus ROG Zephyrus G14 GA402RJ
AMD Ryzen 7 6800HS, AMD Radeon RX 6700S
45.2 fps -30%
HP Spectre x360 2-in-1 16-f1075ng
Intel Core i7-12700H, Intel Iris Xe Graphics G7 96EUs
40.1 fps -38%
MSI Prestige 16 B1MG-001US
Intel Core Ultra 7 155H, Intel Arc 8-Core iGPU
37.8 fps -42%
Lenovo ThinkPad Z16 Gen 2
AMD Ryzen 9 PRO 7940HS, AMD Radeon RX 6550M
33 fps -49%
Acer Swift Edge SFE16 Ryzen 7 7840U
AMD Ryzen 7 7840U, AMD Radeon 780M
30.3 fps -53%
Acer Swift Edge SFE16-42-R1GM
AMD Ryzen 7 7735U, AMD Radeon 680M
30.2 fps -54%
Baldur's Gate 3
1920x1080 High Preset
Alienware m18 R1 AMD
AMD Ryzen 9 7945HX, AMD Radeon RX 7900M
152.4 fps +99%
Lenovo Legion Slim 7 16APH8
AMD Ryzen 7 7840HS, NVIDIA GeForce RTX 4060 Laptop GPU
84.8 (24.5min, 32.2P0.1, 65.5P1) fps +11%
Framework Laptop 16
AMD Ryzen 9 7940HS, AMD Radeon RX 7700S
76.4 fps
Medio AMD Radeon RX 7700S
  ()
76.4 fps 0%
Lenovo ThinkPad Z16 Gen 2
AMD Ryzen 9 PRO 7940HS, AMD Radeon RX 6550M
44.7 fps -41%
MSI Prestige 16 B1MG-001US
Intel Core Ultra 7 155H, Intel Arc 8-Core iGPU
24.1 fps -68%
1920x1080 Ultra Preset
Alienware m18 R1 AMD
AMD Ryzen 9 7945HX, AMD Radeon RX 7900M
152.6 fps +107%
Lenovo Legion Slim 7 16APH8
AMD Ryzen 7 7840HS, NVIDIA GeForce RTX 4060 Laptop GPU
82.6 (21.9min, 32.5P0.1, 59.4P1) fps +12%
Framework Laptop 16
AMD Ryzen 9 7940HS, AMD Radeon RX 7700S
73.6 fps
Medio AMD Radeon RX 7700S
  ()
73.6 fps 0%
Lenovo ThinkPad Z16 Gen 2
AMD Ryzen 9 PRO 7940HS, AMD Radeon RX 6550M
43 fps -42%
MSI Prestige 16 B1MG-001US
Intel Core Ultra 7 155H, Intel Arc 8-Core iGPU
23.4 fps -68%
2560x1440 Ultra Preset
Alienware m18 R1 AMD
AMD Ryzen 9 7945HX, AMD Radeon RX 7900M
118.5 fps +132%
Lenovo Legion Slim 7 16APH8
AMD Ryzen 7 7840HS, NVIDIA GeForce RTX 4060 Laptop GPU
55.8 (23.7min, 27P0.1, 38.9P1) fps +9%
Framework Laptop 16
AMD Ryzen 9 7940HS, AMD Radeon RX 7700S
51.1 fps
Medio AMD Radeon RX 7700S
  ()
51.1 fps 0%
Lenovo ThinkPad Z16 Gen 2
AMD Ryzen 9 PRO 7940HS, AMD Radeon RX 6550M
29 fps -43%
3840x2160 Ultra Preset
Alienware m18 R1 AMD
AMD Ryzen 9 7945HX, AMD Radeon RX 7900M
65.8 fps +166%
Framework Laptop 16
AMD Ryzen 9 7940HS, AMD Radeon RX 7700S
24.7 fps
Medio AMD Radeon RX 7700S
  ()
24.7 fps 0%
F1 22
1920x1080 High Preset AA:T AF:16x
Alienware m18 R1 AMD
AMD Ryzen 9 7945HX, AMD Radeon RX 7900M
296 (178min, 58P1) fps +76%
Alienware m16 R1 AMD
AMD Ryzen 9 7845HX, NVIDIA GeForce RTX 4080 Laptop GPU
285 (194min, 152P1) fps +70%
Asus Zephyrus Duo 16 GX650PY-NM006W
AMD Ryzen 9 7945HX, NVIDIA GeForce RTX 4090 Laptop GPU
265 (193min, 148P1) fps +58%
Framework Laptop 16
AMD Ryzen 9 7940HS, AMD Radeon RX 7700S
168 (142min, 123P1) fps
Medio AMD Radeon RX 7700S
  ()
168 fps 0%
Asus ROG Zephyrus G14 GA402RJ
AMD Ryzen 7 6800HS, AMD Radeon RX 6700S
161 (140min) fps -4%
Dell Inspiron 16 Plus 7630
Intel Core i7-13700H, NVIDIA GeForce RTX 4060 Laptop GPU
148.4 (129min, 89P1) fps -12%
Lenovo ThinkPad Z16 Gen 2
AMD Ryzen 9 PRO 7940HS, AMD Radeon RX 6550M
87.5 (71min, 69P1) fps -48%
MSI Prestige 16 B1MG-001US
Intel Core Ultra 7 155H, Intel Arc 8-Core iGPU
53.3 (38min, 38P1) fps -68%
Acer Swift Edge SFE16 Ryzen 7 7840U
AMD Ryzen 7 7840U, AMD Radeon 780M
42.6 (31min, 27P1) fps -75%
Acer Swift Edge SFE16-42-R1GM
AMD Ryzen 7 7735U, AMD Radeon 680M
36.9 (26min, 24P1) fps -78%
HP Spectre x360 2-in-1 16-f1075ng
Intel Core i7-12700H, Intel Iris Xe Graphics G7 96EUs
27.2 (23min, 21P1) fps -84%
1920x1080 Ultra High Preset AA:T AF:16x
Alienware m16 R1 AMD
AMD Ryzen 9 7845HX, NVIDIA GeForce RTX 4080 Laptop GPU
124.2 (106min, 80P1) fps +160%
Asus Zephyrus Duo 16 GX650PY-NM006W
AMD Ryzen 9 7945HX, NVIDIA GeForce RTX 4090 Laptop GPU
114.3 (92min, 71P1) fps +140%
Alienware m18 R1 AMD
AMD Ryzen 9 7945HX, AMD Radeon RX 7900M
102.8 (73min, 73P1) fps +116%
Dell Inspiron 16 Plus 7630
Intel Core i7-13700H, NVIDIA GeForce RTX 4060 Laptop GPU
53.8 (46min, 45P1) fps +13%
Framework Laptop 16
AMD Ryzen 9 7940HS, AMD Radeon RX 7700S
47.7 (32min, 34P1) fps
Medio AMD Radeon RX 7700S
  ()
47.7 fps 0%
Asus ROG Zephyrus G14 GA402RJ
AMD Ryzen 7 6800HS, AMD Radeon RX 6700S
37 (27min) fps -22%
HP Spectre x360 2-in-1 16-f1075ng
Intel Core i7-12700H, Intel Iris Xe Graphics G7 96EUs
21.5 (18min, 17P1) fps -55%
Lenovo ThinkPad Z16 Gen 2
AMD Ryzen 9 PRO 7940HS, AMD Radeon RX 6550M
19.3 (13min, 13P1) fps -60%
MSI Prestige 16 B1MG-001US
Intel Core Ultra 7 155H, Intel Arc 8-Core iGPU
15.3 (9min, 12P1) fps -68%
Acer Swift Edge SFE16 Ryzen 7 7840U
AMD Ryzen 7 7840U, AMD Radeon 780M
9.92 (7min, 7P1) fps -79%
Acer Swift Edge SFE16-42-R1GM
AMD Ryzen 7 7735U, AMD Radeon 680M
7.85 (5P1) fps -84%
2560x1440 Ultra High Preset AA:T AF:16x
Asus Zephyrus Duo 16 GX650PY-NM006W
AMD Ryzen 9 7945HX, NVIDIA GeForce RTX 4090 Laptop GPU
80.3 (70min, 58P1) fps +169%
Alienware m16 R1 AMD
AMD Ryzen 9 7845HX, NVIDIA GeForce RTX 4080 Laptop GPU
78.1 (67min, 65P1) fps +161%
Alienware m18 R1 AMD
AMD Ryzen 9 7945HX, AMD Radeon RX 7900M
69.3 (37min, 49P1) fps +132%
Dell Inspiron 16 Plus 7630
Intel Core i7-13700H, NVIDIA GeForce RTX 4060 Laptop GPU
34.1 (28min, 28P1) fps +14%
Framework Laptop 16
AMD Ryzen 9 7940HS, AMD Radeon RX 7700S
29.9 (20min, 21P1) fps
Medio AMD Radeon RX 7700S
  ()
29.9 fps 0%
Asus ROG Zephyrus G14 GA402RJ
AMD Ryzen 7 6800HS, AMD Radeon RX 6700S
21 (16min) fps -30%
HP Spectre x360 2-in-1 16-f1075ng
Intel Core i7-12700H, Intel Iris Xe Graphics G7 96EUs
15 (12min, 12P1) fps -50%
Lenovo ThinkPad Z16 Gen 2
AMD Ryzen 9 PRO 7940HS, AMD Radeon RX 6550M
11.3 (7min, 7P1) fps -62%
3840x2160 Ultra High Preset AA:T AF:16x
Alienware m16 R1 AMD
AMD Ryzen 9 7845HX, NVIDIA GeForce RTX 4080 Laptop GPU
39.5 (34min, 33P1) fps +250%
Alienware m18 R1 AMD
AMD Ryzen 9 7945HX, AMD Radeon RX 7900M
36.1 (24min, 25P1) fps +219%
Framework Laptop 16
AMD Ryzen 9 7940HS, AMD Radeon RX 7700S
11.3 (8min, 8P1) fps
Medio AMD Radeon RX 7700S
  ()
11.3 fps 0%
The Witcher 3
1920x1080 High Graphics & Postprocessing (Nvidia HairWorks Off)
Asus Zephyrus Duo 16 GX650PY-NM006W
AMD Ryzen 9 7945HX, NVIDIA GeForce RTX 4090 Laptop GPU
361 fps +145%
Alienware m16 R1 AMD
AMD Ryzen 9 7845HX, NVIDIA GeForce RTX 4080 Laptop GPU
349.3 (321min) fps +137%
MSI Stealth 16 Mercedes-AMG Motorsport A13VG
Intel Core i9-13900H, NVIDIA GeForce RTX 4070 Laptop GPU
205 (157min) fps +39%
Dell Inspiron 16 Plus 7630
Intel Core i7-13700H, NVIDIA GeForce RTX 4060 Laptop GPU
169.5 (158min) fps +15%
Framework Laptop 16
AMD Ryzen 9 7940HS, AMD Radeon RX 7700S
147.1 (136min) fps
Medio AMD Radeon RX 7700S
  ()
147.1 fps 0%
Asus ROG Zephyrus G14 GA402RJ
AMD Ryzen 7 6800HS, AMD Radeon RX 6700S
144 (124min) fps -2%
Apple MacBook Pro 16 2023 M3 Max
Apple M3 Max 16-Core, Apple M3 Max 40-Core GPU
87 fps -41%
Lenovo ThinkPad Z16 Gen 2
AMD Ryzen 9 PRO 7940HS, AMD Radeon RX 6550M
83.2 (78min) fps -43%
MSI Prestige 16 B1MG-001US
Intel Core Ultra 7 155H, Intel Arc 8-Core iGPU
54.1 (48min) fps -63%
Acer Swift Edge SFE16 Ryzen 7 7840U
AMD Ryzen 7 7840U, AMD Radeon 780M
36.1 (27min) fps -75%
Acer Swift Edge SFE16-42-R1GM
AMD Ryzen 7 7735U, AMD Radeon 680M
32.7 fps -78%
HP Spectre x360 2-in-1 16-f1075ng
Intel Core i7-12700H, Intel Iris Xe Graphics G7 96EUs
25.6 (12.6min, 13.1P0.1, 15.9P1) fps -83%
1920x1080 Ultra Graphics & Postprocessing (HBAO+)
Asus Zephyrus Duo 16 GX650PY-NM006W
AMD Ryzen 9 7945HX, NVIDIA GeForce RTX 4090 Laptop GPU
178.6 (172min, 173P1) fps +113%
Alienware m16 R1 AMD
AMD Ryzen 9 7845HX, NVIDIA GeForce RTX 4080 Laptop GPU
169.7 (161min) fps +102%
Alienware m18 R1 AMD
AMD Ryzen 9 7945HX, AMD Radeon RX 7900M
167.7 (134min) fps +100%
MSI Stealth 16 Mercedes-AMG Motorsport A13VG
Intel Core i9-13900H, NVIDIA GeForce RTX 4070 Laptop GPU
110 fps +31%
Lenovo Legion Slim 7 16APH8
AMD Ryzen 7 7840HS, NVIDIA GeForce RTX 4060 Laptop GPU
98 fps +17%
Dell Inspiron 16 Plus 7630
Intel Core i7-13700H, NVIDIA GeForce RTX 4060 Laptop GPU
90.9 (85min) fps +8%
Asus ROG Zephyrus G14 GA402RJ
AMD Ryzen 7 6800HS, AMD Radeon RX 6700S
84.3 (69min) fps 0%
Framework Laptop 16
AMD Ryzen 9 7940HS, AMD Radeon RX 7700S
84 (79min) fps
Medio AMD Radeon RX 7700S
  ()
84 fps 0%
Apple MacBook Pro 16 2023 M3 Max
Apple M3 Max 16-Core, Apple M3 Max 40-Core GPU
69 fps -18%
Lenovo ThinkPad Z16 Gen 2
AMD Ryzen 9 PRO 7940HS, AMD Radeon RX 6550M
49.4 (42min) fps -41%
MSI Prestige 16 B1MG-001US
Intel Core Ultra 7 155H, Intel Arc 8-Core iGPU
25.2 (22min) fps -70%
Acer Swift Edge SFE16 Ryzen 7 7840U
AMD Ryzen 7 7840U, AMD Radeon 780M
20.4 (18min) fps -76%
Acer Swift Edge SFE16-42-R1GM
AMD Ryzen 7 7735U, AMD Radeon 680M
20.3 fps -76%
HP Spectre x360 2-in-1 16-f1075ng
Intel Core i7-12700H, Intel Iris Xe Graphics G7 96EUs
12.8 (4.76min, 5.9P0.1, 7.32P1) fps -85%
3840x2160 High Graphics & Postprocessing (Nvidia HairWorks Off)
Alienware m16 R1 AMD
AMD Ryzen 9 7845HX, NVIDIA GeForce RTX 4080 Laptop GPU
121.5 (112min) fps +183%
Alienware m18 R1 AMD
AMD Ryzen 9 7945HX, AMD Radeon RX 7900M
116 (107min) fps +170%
Framework Laptop 16
AMD Ryzen 9 7940HS, AMD Radeon RX 7700S
43 (38min) fps
Medio AMD Radeon RX 7700S
  ()
43 fps 0%
Dota 2 Reborn
3840x2160 ultra (3/3) best looking
Alienware m16 R1 AMD
AMD Ryzen 9 7845HX, NVIDIA GeForce RTX 4080 Laptop GPU
161 (135.2min) fps +89%
Alienware m18 R1 AMD
AMD Ryzen 9 7945HX, AMD Radeon RX 7900M
122.5 (105.6min) fps +44%
Framework Laptop 16
AMD Ryzen 9 7940HS, AMD Radeon RX 7700S
85.3 (77.8min) fps
Medio AMD Radeon RX 7700S
  ()
85.3 fps 0%
1920x1080 ultra (3/3) best looking
Asus Zephyrus Duo 16 GX650PY-NM006W
AMD Ryzen 9 7945HX, NVIDIA GeForce RTX 4090 Laptop GPU
179.7 (153.7min) fps +31%
Alienware m16 R1 AMD
AMD Ryzen 9 7845HX, NVIDIA GeForce RTX 4080 Laptop GPU
164.7 (138.5min) fps +20%
Alienware m18 R1 AMD
AMD Ryzen 9 7945HX, AMD Radeon RX 7900M
146.2 (121.3min) fps +7%
Dell Inspiron 16 Plus 7630
Intel Core i7-13700H, NVIDIA GeForce RTX 4060 Laptop GPU
146.1 (126.2min) fps +7%
Framework Laptop 16
AMD Ryzen 9 7940HS, AMD Radeon RX 7700S
136.8 (116min) fps
Medio AMD Radeon RX 7700S
  ()
136.8 fps 0%
Lenovo Legion Slim 7 16APH8
AMD Ryzen 7 7840HS, NVIDIA GeForce RTX 4060 Laptop GPU
134.7 (118.5min) fps -2%
MSI Stealth 16 Mercedes-AMG Motorsport A13VG
Intel Core i9-13900H, NVIDIA GeForce RTX 4070 Laptop GPU
126.9 (109.4min) fps -7%
Asus ROG Zephyrus G14 GA402RJ
AMD Ryzen 7 6800HS, AMD Radeon RX 6700S
103 (86.9min) fps -25%
Lenovo ThinkPad Z16 Gen 2
AMD Ryzen 9 PRO 7940HS, AMD Radeon RX 6550M
103 (86.2min) fps -25%
MSI Prestige 16 B1MG-001US
Intel Core Ultra 7 155H, Intel Arc 8-Core iGPU
75.6 (49.1min) fps -45%
Acer Swift Edge SFE16 Ryzen 7 7840U
AMD Ryzen 7 7840U, AMD Radeon 780M
61.4 (52min) fps -55%
Acer Swift Edge SFE16-42-R1GM
AMD Ryzen 7 7735U, AMD Radeon 680M
61 (52.3min) fps -55%
HP Spectre x360 2-in-1 16-f1075ng
Intel Core i7-12700H, Intel Iris Xe Graphics G7 96EUs
48.8 (44.1min) fps -64%
1920x1080 high (2/3)
Asus Zephyrus Duo 16 GX650PY-NM006W
AMD Ryzen 9 7945HX, NVIDIA GeForce RTX 4090 Laptop GPU
196.1 (167.3min) fps +25%
Alienware m16 R1 AMD
AMD Ryzen 9 7845HX, NVIDIA GeForce RTX 4080 Laptop GPU
180.4 (144.4min) fps +15%
Alienware m18 R1 AMD
AMD Ryzen 9 7945HX, AMD Radeon RX 7900M
162.8 (140.2min) fps +4%
Dell Inspiron 16 Plus 7630
Intel Core i7-13700H, NVIDIA GeForce RTX 4060 Laptop GPU
157.9 (135min) fps +1%
Framework Laptop 16
AMD Ryzen 9 7940HS, AMD Radeon RX 7700S
156.5 (129.7min) fps
Medio AMD Radeon RX 7700S
  ()
156.5 fps 0%
Lenovo Legion Slim 7 16APH8
AMD Ryzen 7 7840HS, NVIDIA GeForce RTX 4060 Laptop GPU
140.6 (123.7min) fps -10%
MSI Stealth 16 Mercedes-AMG Motorsport A13VG
Intel Core i9-13900H, NVIDIA GeForce RTX 4070 Laptop GPU
135.9 (117.6min) fps -13%
Asus ROG Zephyrus G14 GA402RJ
AMD Ryzen 7 6800HS, AMD Radeon RX 6700S
114.7 (96.5min) fps -27%
Lenovo ThinkPad Z16 Gen 2
AMD Ryzen 9 PRO 7940HS, AMD Radeon RX 6550M
112.3 (96.6min) fps -28%
MSI Prestige 16 B1MG-001US
Intel Core Ultra 7 155H, Intel Arc 8-Core iGPU
79.1 (49.9min) fps -49%
Acer Swift Edge SFE16-42-R1GM
AMD Ryzen 7 7735U, AMD Radeon 680M
69.7 (60min) fps -55%
Acer Swift Edge SFE16 Ryzen 7 7840U
AMD Ryzen 7 7840U, AMD Radeon 780M
66.8 (55.4min) fps -57%
HP Spectre x360 2-in-1 16-f1075ng
Intel Core i7-12700H, Intel Iris Xe Graphics G7 96EUs
53 (48.5min) fps -66%
Final Fantasy XV Benchmark
1920x1080 High Quality
Asus Zephyrus Duo 16 GX650PY-NM006W
AMD Ryzen 9 7945HX, NVIDIA GeForce RTX 4090 Laptop GPU
169.6 fps +127%
Alienware m16 R1 AMD
AMD Ryzen 9 7845HX, NVIDIA GeForce RTX 4080 Laptop GPU
167.6 fps +124%
Alienware m18 R1 AMD
AMD Ryzen 9 7945HX, AMD Radeon RX 7900M
152.8 fps +104%
MSI Stealth 16 Mercedes-AMG Motorsport A13VG
Intel Core i9-13900H, NVIDIA GeForce RTX 4070 Laptop GPU
101.4 fps +36%
Dell Inspiron 16 Plus 7630
Intel Core i7-13700H, NVIDIA GeForce RTX 4060 Laptop GPU
88.9 fps +19%
Asus ROG Zephyrus G14 GA402RJ
AMD Ryzen 7 6800HS, AMD Radeon RX 6700S
78.6 fps +5%
Framework Laptop 16
AMD Ryzen 9 7940HS, AMD Radeon RX 7700S
74.8 fps
Medio AMD Radeon RX 7700S
  ()
74.8 fps 0%
Lenovo ThinkPad Z16 Gen 2
AMD Ryzen 9 PRO 7940HS, AMD Radeon RX 6550M
47.8 fps -36%
MSI Prestige 16 B1MG-001US
Intel Core Ultra 7 155H, Intel Arc 8-Core iGPU
24.6 fps -67%
Acer Swift Edge SFE16 Ryzen 7 7840U
AMD Ryzen 7 7840U, AMD Radeon 780M
21.2 fps -72%
Acer Swift Edge SFE16-42-R1GM
AMD Ryzen 7 7735U, AMD Radeon 680M
19.3 fps -74%
HP Spectre x360 2-in-1 16-f1075ng
Intel Core i7-12700H, Intel Iris Xe Graphics G7 96EUs
14.6 fps -80%
2560x1440 High Quality
Asus Zephyrus Duo 16 GX650PY-NM006W
AMD Ryzen 9 7945HX, NVIDIA GeForce RTX 4090 Laptop GPU
142.1 fps +161%
Alienware m16 R1 AMD
AMD Ryzen 9 7845HX, NVIDIA GeForce RTX 4080 Laptop GPU
131.6 fps +141%
Alienware m18 R1 AMD
AMD Ryzen 9 7945HX, AMD Radeon RX 7900M
114.6 fps +110%
MSI Stealth 16 Mercedes-AMG Motorsport A13VG
Intel Core i9-13900H, NVIDIA GeForce RTX 4070 Laptop GPU
74.1 fps +36%
Dell Inspiron 16 Plus 7630
Intel Core i7-13700H, NVIDIA GeForce RTX 4060 Laptop GPU
64.4 fps +18%
Framework Laptop 16
AMD Ryzen 9 7940HS, AMD Radeon RX 7700S
54.5 fps
Medio AMD Radeon RX 7700S
  ()
54.5 fps 0%
Lenovo ThinkPad Z16 Gen 2
AMD Ryzen 9 PRO 7940HS, AMD Radeon RX 6550M
31.2 fps -43%
HP Spectre x360 2-in-1 16-f1075ng
Intel Core i7-12700H, Intel Iris Xe Graphics G7 96EUs
10.3 fps -81%
3840x2160 High Quality
Alienware m16 R1 AMD
AMD Ryzen 9 7845HX, NVIDIA GeForce RTX 4080 Laptop GPU
76.1 fps +162%
Alienware m18 R1 AMD
AMD Ryzen 9 7945HX, AMD Radeon RX 7900M
69.3 fps +139%
Framework Laptop 16
AMD Ryzen 9 7940HS, AMD Radeon RX 7700S
29 fps
Medio AMD Radeon RX 7700S
  ()
29 fps 0%
X-Plane 11.11
1920x1080 med (fps_test=2)
Asus Zephyrus Duo 16 GX650PY-NM006W
AMD Ryzen 9 7945HX, NVIDIA GeForce RTX 4090 Laptop GPU
155.7 fps +96%
Alienware m16 R1 AMD
AMD Ryzen 9 7845HX, NVIDIA GeForce RTX 4080 Laptop GPU
149 fps +88%
Dell Inspiron 16 Plus 7630
Intel Core i7-13700H, NVIDIA GeForce RTX 4060 Laptop GPU
135.7 fps +71%
MSI Stealth 16 Mercedes-AMG Motorsport A13VG
Intel Core i9-13900H, NVIDIA GeForce RTX 4070 Laptop GPU
118.1 fps +49%
Lenovo Legion Slim 7 16APH8
AMD Ryzen 7 7840HS, NVIDIA GeForce RTX 4060 Laptop GPU
103.5 fps +31%
Framework Laptop 16
AMD Ryzen 9 7940HS, AMD Radeon RX 7700S
79.3 fps
Medio AMD Radeon RX 7700S
  ()
79.3 fps 0%
Asus ROG Zephyrus G14 GA402RJ
AMD Ryzen 7 6800HS, AMD Radeon RX 6700S
51.7 fps -35%
MSI Prestige 16 B1MG-001US
Intel Core Ultra 7 155H, Intel Arc 8-Core iGPU
46.7 fps -41%
HP Spectre x360 2-in-1 16-f1075ng
Intel Core i7-12700H, Intel Iris Xe Graphics G7 96EUs
44.4 fps -44%
Lenovo ThinkPad Z16 Gen 2
AMD Ryzen 9 PRO 7940HS, AMD Radeon RX 6550M
41.2 fps -48%
Acer Swift Edge SFE16 Ryzen 7 7840U
AMD Ryzen 7 7840U, AMD Radeon 780M
37 fps -53%
Acer Swift Edge SFE16-42-R1GM
AMD Ryzen 7 7735U, AMD Radeon 680M
36.6 fps -54%
1920x1080 high (fps_test=3)
Asus Zephyrus Duo 16 GX650PY-NM006W
AMD Ryzen 9 7945HX, NVIDIA GeForce RTX 4090 Laptop GPU
117.8 fps +81%
Alienware m16 R1 AMD
AMD Ryzen 9 7845HX, NVIDIA GeForce RTX 4080 Laptop GPU
113.1 fps +74%
Dell Inspiron 16 Plus 7630
Intel Core i7-13700H, NVIDIA GeForce RTX 4060 Laptop GPU
109.7 fps +69%
MSI Stealth 16 Mercedes-AMG Motorsport A13VG
Intel Core i9-13900H, NVIDIA GeForce RTX 4070 Laptop GPU
98 fps +51%
Alienware m18 R1 AMD
AMD Ryzen 9 7945HX, AMD Radeon RX 7900M
83.7 fps +29%
Lenovo Legion Slim 7 16APH8
AMD Ryzen 7 7840HS, NVIDIA GeForce RTX 4060 Laptop GPU
81.6 fps +26%
Framework Laptop 16
AMD Ryzen 9 7940HS, AMD Radeon RX 7700S
65 fps
Medio AMD Radeon RX 7700S
  ()
65 fps 0%
Asus ROG Zephyrus G14 GA402RJ
AMD Ryzen 7 6800HS, AMD Radeon RX 6700S
45.2 fps -30%
HP Spectre x360 2-in-1 16-f1075ng
Intel Core i7-12700H, Intel Iris Xe Graphics G7 96EUs
40.1 fps -38%
MSI Prestige 16 B1MG-001US
Intel Core Ultra 7 155H, Intel Arc 8-Core iGPU
37.8 fps -42%
Lenovo ThinkPad Z16 Gen 2
AMD Ryzen 9 PRO 7940HS, AMD Radeon RX 6550M
33 fps -49%
Acer Swift Edge SFE16 Ryzen 7 7840U
AMD Ryzen 7 7840U, AMD Radeon 780M
30.3 fps -53%
Acer Swift Edge SFE16-42-R1GM
AMD Ryzen 7 7735U, AMD Radeon 680M
30.2 fps -54%
3840x2160 high (fps_test=3)
Alienware m16 R1 AMD
AMD Ryzen 9 7845HX, NVIDIA GeForce RTX 4080 Laptop GPU
95 fps +103%
Alienware m18 R1 AMD
AMD Ryzen 9 7945HX, AMD Radeon RX 7900M
64.3 fps +37%
Framework Laptop 16
AMD Ryzen 9 7940HS, AMD Radeon RX 7700S
46.8 fps
Medio AMD Radeon RX 7700S
  ()
46.8 fps 0%
Far Cry 5
1920x1080 High Preset AA:T
Alienware m16 R1 AMD
AMD Ryzen 9 7845HX, NVIDIA GeForce RTX 4080 Laptop GPU
141 (112min) fps +15%
Framework Laptop 16
AMD Ryzen 9 7940HS, AMD Radeon RX 7700S
123 (106min) fps
Medio AMD Radeon RX 7700S
  ()
123 fps 0%
Dell Inspiron 16 Plus 7630
Intel Core i7-13700H, NVIDIA GeForce RTX 4060 Laptop GPU
115 (74min) fps -7%
Asus ROG Zephyrus G14 GA402RJ
AMD Ryzen 7 6800HS, AMD Radeon RX 6700S
103 (76min) fps -16%
Lenovo ThinkPad Z16 Gen 2
AMD Ryzen 9 PRO 7940HS, AMD Radeon RX 6550M
84 (74min) fps -32%
Apple MacBook Pro 16 2023 M3 Max
Apple M3 Max 16-Core, Apple M3 Max 40-Core GPU
54 fps -56%
MSI Prestige 16 B1MG-001US
Intel Core Ultra 7 155H, Intel Arc 8-Core iGPU
36 (14min) fps -71%
Acer Swift Edge SFE16-42-R1GM
AMD Ryzen 7 7735U, AMD Radeon 680M
31 (10min) fps -75%
Acer Swift Edge SFE16 Ryzen 7 7840U
AMD Ryzen 7 7840U, AMD Radeon 780M
26 (16min) fps -79%
HP Spectre x360 2-in-1 16-f1075ng
Intel Core i7-12700H, Intel Iris Xe Graphics G7 96EUs
22 (20min) fps -82%
1920x1080 Ultra Preset AA:T
Alienware m16 R1 AMD
AMD Ryzen 9 7845HX, NVIDIA GeForce RTX 4080 Laptop GPU
136 (35min) fps +16%
Alienware m18 R1 AMD
AMD Ryzen 9 7945HX, AMD Radeon RX 7900M
128 (92min) fps +9%
Framework Laptop 16
AMD Ryzen 9 7940HS, AMD Radeon RX 7700S
117 (96min) fps
Medio AMD Radeon RX 7700S
  ()
117 fps 0%
Dell Inspiron 16 Plus 7630
Intel Core i7-13700H, NVIDIA GeForce RTX 4060 Laptop GPU
103 (74min) fps -12%
Asus ROG Zephyrus G14 GA402RJ
AMD Ryzen 7 6800HS, AMD Radeon RX 6700S
97 (70min) fps -17%
Lenovo ThinkPad Z16 Gen 2
AMD Ryzen 9 PRO 7940HS, AMD Radeon RX 6550M
79 (70min) fps -32%
Apple MacBook Pro 16 2023 M3 Max
Apple M3 Max 16-Core, Apple M3 Max 40-Core GPU
50 fps -57%
MSI Prestige 16 B1MG-001US
Intel Core Ultra 7 155H, Intel Arc 8-Core iGPU
34 (22min) fps -71%
Acer Swift Edge SFE16-42-R1GM
AMD Ryzen 7 7735U, AMD Radeon 680M
28 (17min) fps -76%
Acer Swift Edge SFE16 Ryzen 7 7840U
AMD Ryzen 7 7840U, AMD Radeon 780M
24 (22min) fps -79%
HP Spectre x360 2-in-1 16-f1075ng
Intel Core i7-12700H, Intel Iris Xe Graphics G7 96EUs
20 (18min) fps -83%
2560x1440 Ultra Preset AA:T
Alienware m16 R1 AMD
AMD Ryzen 9 7845HX, NVIDIA GeForce RTX 4080 Laptop GPU
131 (101min) fps +62%
Alienware m18 R1 AMD
AMD Ryzen 9 7945HX, AMD Radeon RX 7900M
123 (89min) fps +52%
Dell Inspiron 16 Plus 7630
Intel Core i7-13700H, NVIDIA GeForce RTX 4060 Laptop GPU
83 (74min) fps +2%
Framework Laptop 16
AMD Ryzen 9 7940HS, AMD Radeon RX 7700S
81 (65min) fps
Medio AMD Radeon RX 7700S
  ()
81 fps 0%
Asus ROG Zephyrus G14 GA402RJ
AMD Ryzen 7 6800HS, AMD Radeon RX 6700S
79 (69min) fps -2%
Apple MacBook Pro 16 2023 M3 Max
Apple M3 Max 16-Core, Apple M3 Max 40-Core GPU
49 fps -40%
HP Spectre x360 2-in-1 16-f1075ng
Intel Core i7-12700H, Intel Iris Xe Graphics G7 96EUs
13 (11min) fps -84%
3840x2160 Ultra Preset AA:T
Alienware m18 R1 AMD
AMD Ryzen 9 7945HX, AMD Radeon RX 7900M
103 (91min) fps +164%
Alienware m16 R1 AMD
AMD Ryzen 9 7845HX, NVIDIA GeForce RTX 4080 Laptop GPU
91 (80min) fps +133%
Framework Laptop 16
AMD Ryzen 9 7940HS, AMD Radeon RX 7700S
39 (34min) fps
Medio AMD Radeon RX 7700S
  ()
39 fps 0%
Strange Brigade
1920x1080 high AA:high AF:8
Alienware m16 R1 AMD
AMD Ryzen 9 7845HX, NVIDIA GeForce RTX 4080 Laptop GPU
400 (149.3min, 286P1) fps +139%
Asus Zephyrus Duo 16 GX650PY-NM006W
AMD Ryzen 9 7945HX, NVIDIA GeForce RTX 4090 Laptop GPU
370 (58.3min, 253P1) fps +121%
MSI Stealth 16 Mercedes-AMG Motorsport A13VG
Intel Core i9-13900H, NVIDIA GeForce RTX 4070 Laptop GPU
220 (97.6min, 163P1) fps +31%
Lenovo Legion Slim 7 16APH8
AMD Ryzen 7 7840HS, NVIDIA GeForce RTX 4060 Laptop GPU
208 (43.1min, 149.7P1) fps +24%
Dell Inspiron 16 Plus 7630
Intel Core i7-13700H, NVIDIA GeForce RTX 4060 Laptop GPU
185.9 (60.8min, 136.8P1) fps +11%
Asus ROG Zephyrus G14 GA402RJ
AMD Ryzen 7 6800HS, AMD Radeon RX 6700S
182.7 (120.8min, 132.5P1) fps +9%
Framework Laptop 16
AMD Ryzen 9 7940HS, AMD Radeon RX 7700S
167.4 (88.3min, 121P1) fps
Medio AMD Radeon RX 7700S
  ()
167.4 fps 0%
Lenovo ThinkPad Z16 Gen 2
AMD Ryzen 9 PRO 7940HS, AMD Radeon RX 6550M
101.1 (76.4min, 80.5P1) fps -40%
MSI Prestige 16 B1MG-001US
Intel Core Ultra 7 155H, Intel Arc 8-Core iGPU
57.8 (8.4min, 44.7P1) fps -65%
Acer Swift Edge SFE16 Ryzen 7 7840U
AMD Ryzen 7 7840U, AMD Radeon 780M
49.5 (8min, 13.9P1) fps -70%
Acer Swift Edge SFE16-42-R1GM
AMD Ryzen 7 7735U, AMD Radeon 680M
44.9 (7.8min, 12.1P1) fps -73%
HP Spectre x360 2-in-1 16-f1075ng
Intel Core i7-12700H, Intel Iris Xe Graphics G7 96EUs
29.6 (10.8min, 15.8P1) fps -82%
1920x1080 ultra AA:ultra AF:16
Alienware m16 R1 AMD
AMD Ryzen 9 7845HX, NVIDIA GeForce RTX 4080 Laptop GPU
357 (82.8min, 253P1) fps +148%
Alienware m18 R1 AMD
AMD Ryzen 9 7945HX, AMD Radeon RX 7900M
344 (145.8min, 227P1) fps +139%
Asus Zephyrus Duo 16 GX650PY-NM006W
AMD Ryzen 9 7945HX, NVIDIA GeForce RTX 4090 Laptop GPU
333 (38min, 227P1) fps +131%
MSI Stealth 16 Mercedes-AMG Motorsport A13VG
Intel Core i9-13900H, NVIDIA GeForce RTX 4070 Laptop GPU
190.6 (88.3min, 142.9P1) fps +32%
Lenovo Legion Slim 7 16APH8
AMD Ryzen 7 7840HS, NVIDIA GeForce RTX 4060 Laptop GPU
180.8 (22.8min, 134P1) fps +26%
Dell Inspiron 16 Plus 7630
Intel Core i7-13700H, NVIDIA GeForce RTX 4060 Laptop GPU
161 (79.8min, 120.7P1) fps +12%
Asus ROG Zephyrus G14 GA402RJ
AMD Ryzen 7 6800HS, AMD Radeon RX 6700S
157.3 (108.2min, 113.2P1) fps +9%
Framework Laptop 16
AMD Ryzen 9 7940HS, AMD Radeon RX 7700S
143.9 (84.9min, 104.3P1) fps
Medio AMD Radeon RX 7700S
  ()
143.9 fps 0%
Lenovo ThinkPad Z16 Gen 2
AMD Ryzen 9 PRO 7940HS, AMD Radeon RX 6550M
88.4 (66.9min, 70.8P1) fps -39%
MSI Prestige 16 B1MG-001US
Intel Core Ultra 7 155H, Intel Arc 8-Core iGPU
46.1 (5min, 20.8P1) fps -68%
Acer Swift Edge SFE16 Ryzen 7 7840U
AMD Ryzen 7 7840U, AMD Radeon 780M
41.3 (7.5min, 9.37P1) fps -71%
Acer Swift Edge SFE16-42-R1GM
AMD Ryzen 7 7735U, AMD Radeon 680M
36.4 (6.6min, 8.1P1) fps -75%
HP Spectre x360 2-in-1 16-f1075ng
Intel Core i7-12700H, Intel Iris Xe Graphics G7 96EUs
23.7 (7.7min, 9.06P1) fps -84%
2560x1440 ultra AA:ultra AF:16
Asus Zephyrus Duo 16 GX650PY-NM006W
AMD Ryzen 9 7945HX, NVIDIA GeForce RTX 4090 Laptop GPU
257 (110.2min, 192.1P1) fps +180%
Alienware m18 R1 AMD
AMD Ryzen 9 7945HX, AMD Radeon RX 7900M
249 (137.9min, 183.7P1) fps +171%
Alienware m16 R1 AMD
AMD Ryzen 9 7845HX, NVIDIA GeForce RTX 4080 Laptop GPU
248 (25.5min, 194.6P1) fps +170%
MSI Stealth 16 Mercedes-AMG Motorsport A13VG
Intel Core i9-13900H, NVIDIA GeForce RTX 4070 Laptop GPU
126.3 (26min, 103.5P1) fps +37%
Dell Inspiron 16 Plus 7630
Intel Core i7-13700H, NVIDIA GeForce RTX 4060 Laptop GPU
110.9 (68.7min, 89.9P1) fps +21%
Framework Laptop 16
AMD Ryzen 9 7940HS, AMD Radeon RX 7700S
91.9 (66min, 75.1P1) fps
Medio AMD Radeon RX 7700S
  ()
91.9 fps 0%
3840x2160 ultra AA:ultra AF:16
Alienware m18 R1 AMD
AMD Ryzen 9 7945HX, AMD Radeon RX 7900M
130.5 (79.1min, 110.9P1) fps +172%
Alienware m16 R1 AMD
AMD Ryzen 9 7845HX, NVIDIA GeForce RTX 4080 Laptop GPU
123.1 (11.1min, 107.1P1) fps +157%
Framework Laptop 16
AMD Ryzen 9 7940HS, AMD Radeon RX 7700S
47.9 (38.8min, 42.4P1) fps
Medio AMD Radeon RX 7700S
  ()
47.9 fps 0%
Tiny Tina's Wonderlands
1920x1080 High Preset (DX12)
Alienware m16 R1 AMD
AMD Ryzen 9 7845HX, NVIDIA GeForce RTX 4080 Laptop GPU
201.1 fps +119%
Dell Inspiron 16 Plus 7630
Intel Core i7-13700H, NVIDIA GeForce RTX 4060 Laptop GPU
92.1 fps 0%
Framework Laptop 16
AMD Ryzen 9 7940HS, AMD Radeon RX 7700S
92 fps
Medio AMD Radeon RX 7700S
  ()
92 fps 0%
Asus ROG Zephyrus G14 GA402RJ
AMD Ryzen 7 6800HS, AMD Radeon RX 6700S
82.4 fps -10%
Lenovo ThinkPad Z16 Gen 2
AMD Ryzen 9 PRO 7940HS, AMD Radeon RX 6550M
59.7 fps -35%
MSI Prestige 16 B1MG-001US
Intel Core Ultra 7 155H, Intel Arc 8-Core iGPU
30.1 fps -67%
Acer Swift Edge SFE16-42-R1GM
AMD Ryzen 7 7735U, AMD Radeon 680M
19.8 fps -78%
Acer Swift Edge SFE16 Ryzen 7 7840U
AMD Ryzen 7 7840U, AMD Radeon 780M
18.6 fps -80%
1920x1080 Badass Preset (DX12)
Asus Zephyrus Duo 16 GX650PY-NM006W
AMD Ryzen 9 7945HX, NVIDIA GeForce RTX 4090 Laptop GPU
171.5 fps +141%
Alienware m16 R1 AMD
AMD Ryzen 9 7845HX, NVIDIA GeForce RTX 4080 Laptop GPU
160.8 fps +126%
Alienware m18 R1 AMD
AMD Ryzen 9 7945HX, AMD Radeon RX 7900M
150.2 fps +111%
Dell Inspiron 16 Plus 7630
Intel Core i7-13700H, NVIDIA GeForce RTX 4060 Laptop GPU
71.4 fps 0%
Framework Laptop 16
AMD Ryzen 9 7940HS, AMD Radeon RX 7700S
71.2 fps
Medio AMD Radeon RX 7700S
  ()
71.2 fps 0%
Asus ROG Zephyrus G14 GA402RJ
AMD Ryzen 7 6800HS, AMD Radeon RX 6700S
62.4 fps -12%
Lenovo ThinkPad Z16 Gen 2
AMD Ryzen 9 PRO 7940HS, AMD Radeon RX 6550M
30.3 fps -57%
MSI Prestige 16 B1MG-001US
Intel Core Ultra 7 155H, Intel Arc 8-Core iGPU
25.1 fps -65%
Acer Swift Edge SFE16 Ryzen 7 7840U
AMD Ryzen 7 7840U, AMD Radeon 780M
16.5 fps -77%
Acer Swift Edge SFE16-42-R1GM
AMD Ryzen 7 7735U, AMD Radeon 680M
16 fps -78%
2560x1440 Badass Preset (DX12)
Asus Zephyrus Duo 16 GX650PY-NM006W
AMD Ryzen 9 7945HX, NVIDIA GeForce RTX 4090 Laptop GPU
120 fps +154%
Alienware m16 R1 AMD
AMD Ryzen 9 7845HX, NVIDIA GeForce RTX 4080 Laptop GPU
112.9 fps +139%
Alienware m18 R1 AMD
AMD Ryzen 9 7945HX, AMD Radeon RX 7900M
106.8 fps +126%
Dell Inspiron 16 Plus 7630
Intel Core i7-13700H, NVIDIA GeForce RTX 4060 Laptop GPU
48 fps +1%
Framework Laptop 16
AMD Ryzen 9 7940HS, AMD Radeon RX 7700S
47.3 fps
Medio AMD Radeon RX 7700S
  ()
47.3 fps 0%
Asus ROG Zephyrus G14 GA402RJ
AMD Ryzen 7 6800HS, AMD Radeon RX 6700S
39.1 fps -17%
Lenovo ThinkPad Z16 Gen 2
AMD Ryzen 9 PRO 7940HS, AMD Radeon RX 6550M
27.2 fps -42%
3840x2160 Badass Preset (DX12)
Alienware m16 R1 AMD
AMD Ryzen 9 7845HX, NVIDIA GeForce RTX 4080 Laptop GPU
59 fps +155%
Alienware m18 R1 AMD
AMD Ryzen 9 7945HX, AMD Radeon RX 7900M
56 fps +142%
Framework Laptop 16
AMD Ryzen 9 7940HS, AMD Radeon RX 7700S
23.1 fps
Medio AMD Radeon RX 7700S
  ()
23.1 fps 0%
Cyberpunk 2077 2.1 Phantom Liberty
1280x720 Low Preset (FSR off)
Framework Laptop 16
AMD Ryzen 9 7940HS, AMD Radeon RX 7700S
150.2 (73.1min) fps
Medio AMD Radeon RX 7700S
  ()
150.2 fps 0%
Lenovo ThinkPad Z16 Gen 2
AMD Ryzen 9 PRO 7940HS, AMD Radeon RX 6550M
99.1 (61.6min) fps -34%
MSI Prestige 16 B1MG-001US
Intel Core Ultra 7 155H, Intel Arc 8-Core iGPU
53.8 (17.4min) fps -64%
1920x1080 Low Preset (FSR off)
Framework Laptop 16
AMD Ryzen 9 7940HS, AMD Radeon RX 7700S
100.7 (55.4min) fps
Medio AMD Radeon RX 7700S
  ()
100.7 fps 0%
Lenovo ThinkPad Z16 Gen 2
AMD Ryzen 9 PRO 7940HS, AMD Radeon RX 6550M
62.8 (41.5min) fps -38%
Apple MacBook Pro 16 2023 M3 Max
Apple M3 Max 16-Core, Apple M3 Max 40-Core GPU
45 fps -55%
MSI Prestige 16 B1MG-001US
Intel Core Ultra 7 155H, Intel Arc 8-Core iGPU
35.7 (18.6min) fps -65%
1920x1080 Medium Preset (FSR off)
Framework Laptop 16
AMD Ryzen 9 7940HS, AMD Radeon RX 7700S
80.5 (59.6min) fps
Medio AMD Radeon RX 7700S
  ()
80.5 fps 0%
Lenovo ThinkPad Z16 Gen 2
AMD Ryzen 9 PRO 7940HS, AMD Radeon RX 6550M
45.9 (34.5min) fps -43%
Apple MacBook Pro 16 2023 M3 Max
Apple M3 Max 16-Core, Apple M3 Max 40-Core GPU
44 fps -45%
MSI Prestige 16 B1MG-001US
Intel Core Ultra 7 155H, Intel Arc 8-Core iGPU
29.5 (16.9min) fps -63%
1920x1080 High Preset (FSR off)
Alienware m18 R1 AMD
AMD Ryzen 9 7945HX, AMD Radeon RX 7900M
130.7 (21.1min) fps +92%
Framework Laptop 16
AMD Ryzen 9 7940HS, AMD Radeon RX 7700S
68.1 (47.8min) fps
Medio AMD Radeon RX 7700S
  ()
68.1 fps 0%
Apple MacBook Pro 16 2023 M3 Max
Apple M3 Max 16-Core, Apple M3 Max 40-Core GPU
43.7 fps -36%
Lenovo ThinkPad Z16 Gen 2
AMD Ryzen 9 PRO 7940HS, AMD Radeon RX 6550M
34.7 (15.3min) fps -49%
MSI Prestige 16 B1MG-001US
Intel Core Ultra 7 155H, Intel Arc 8-Core iGPU
25.2 (11.7min) fps -63%
1920x1080 Ultra Preset (FSR off)
Alienware m18 R1 AMD
AMD Ryzen 9 7945HX, AMD Radeon RX 7900M
129.6 (54.1min) fps +114%
Framework Laptop 16
AMD Ryzen 9 7940HS, AMD Radeon RX 7700S
60.7 (46.5min) fps
Medio AMD Radeon RX 7700S
  ()
60.7 fps 0%
Apple MacBook Pro 16 2023 M3 Max
Apple M3 Max 16-Core, Apple M3 Max 40-Core GPU
42.8 fps -29%
Lenovo ThinkPad Z16 Gen 2
AMD Ryzen 9 PRO 7940HS, AMD Radeon RX 6550M
28.6 (13.3min) fps -53%
MSI Prestige 16 B1MG-001US
Intel Core Ultra 7 155H, Intel Arc 8-Core iGPU
22.1 (7.2min) fps -64%
2560x1440 Ultra Preset (FSR off)
Alienware m18 R1 AMD
AMD Ryzen 9 7945HX, AMD Radeon RX 7900M
85.2 (59.4min) fps +128%
Apple MacBook Pro 16 2023 M3 Max
Apple M3 Max 16-Core, Apple M3 Max 40-Core GPU
37.4 fps 0%
Framework Laptop 16
AMD Ryzen 9 7940HS, AMD Radeon RX 7700S
37.3 (30.7min) fps
Medio AMD Radeon RX 7700S
  ()
37.3 fps 0%
Lenovo ThinkPad Z16 Gen 2
AMD Ryzen 9 PRO 7940HS, AMD Radeon RX 6550M
17.3 (7.15min) fps -54%
3840x2160 Ultra Preset (FSR off)
Alienware m18 R1 AMD
AMD Ryzen 9 7945HX, AMD Radeon RX 7900M
37.7 (28.5min) fps +139%
Framework Laptop 16
AMD Ryzen 9 7940HS, AMD Radeon RX 7700S
15.8 (12.9min) fps
Medio AMD Radeon RX 7700S
  ()
15.8 fps 0%
1920x1080 Ray Tracing Ultra Preset (DLSS off)
Alienware m18 R1 AMD
AMD Ryzen 9 7945HX, AMD Radeon RX 7900M
42.5 (32.6min) fps +141%
Framework Laptop 16
AMD Ryzen 9 7940HS, AMD Radeon RX 7700S
17.6 (13.5min) fps
Medio AMD Radeon RX 7700S
  ()
17.6 fps 0%
Lenovo ThinkPad Z16 Gen 2
AMD Ryzen 9 PRO 7940HS, AMD Radeon RX 6550M
4.76 (2.99min) fps -73%

Witcher 3 FPS Chart

0102030405060708090100Tooltip
Framework Laptop 16 R9 7940HS, Radeon RX 7700S: Ø99.1 (92-107)
bajomedioaltoultraQHD4K
GTA V (2015) 184 178.6 170.6 95.8 67.1 68.4
The Witcher 3 (2015) 392.2 277.5 147.1 84 43
Dota 2 Reborn (2015) 174 159.8 156.5 136.8 85.3
Final Fantasy XV Benchmark (2018) 206 106 74.8 54.5 29
X-Plane 11.11 (2018) 97.6 79.3 65 46.8
Far Cry 5 (2018) 148 130 123 117 81 39
Strange Brigade (2018) 449 202 167.4 143.9 91.9 47.9
Tiny Tina's Wonderlands (2022) 183.5 140.4 92 71.2 47.3 23.1
F1 22 (2022) 251 221 168 47.7 29.9 11.3
Baldur's Gate 3 (2023) 106.8 88 76.4 73.6 51.1 24.7
Cyberpunk 2077 2.1 Phantom Liberty (2023) 100.7 80.5 68.1 60.7 37.3 15.8

El rendimiento por vatio cuando se ejecuta Witcher 3 en ajustes Ultra es comparable al de una GeForce RTX 4070 Ti o RTX 4080 de sobremesa. Así pues, la GPU RDNA 3 es al menos eficiente aunque no sea ni de lejos tan potente como la más rápida de Nvidia. Mientras tanto, la RTX 4060 móvil, más competitiva, sigue siendo un 30% más eficiente y este margen sólo aumenta a favor de Nvidia cuando se ejecutan juegos compatibles con RT.

Power Consumption - Witcher 3 ultra Efficiency (external Monitor)
NVIDIA GeForce RTX 4090 Laptop GPU
MSI Titan GT77 HX 13VI, i9-13950HX
0.796 fps per Watt +37%
NVIDIA GeForce RTX 4060 Laptop GPU
Dell Inspiron 16 Plus 7630, i7-13700H
0.753 fps per Watt +30%
NVIDIA GeForce RTX 4080 Laptop GPU
Razer Blade 16 Early 2023, i9-13950HX
0.71 fps per Watt +22%
NVIDIA GeForce RTX 3080 Ti Laptop GPU
Alienware x15 R2 P111F, i9-12900H
0.581 fps per Watt 0%
NVIDIA GeForce RTX 4080
KFA2 GeForce RTX 4080 SG, R9 7950X
0.581 fps per Watt 0%
AMD Radeon RX 7700S
Framework Laptop 16, R9 7940HS
0.58 fps per Watt
NVIDIA GeForce RTX 4070 Ti
KFA2 GeForce RTX 4070 Ti SG, R9 7950X
0.548 fps per Watt -6%
NVIDIA GeForce RTX 3080 Ti Laptop GPU
SCHENKER XMG Neo 17 M22, R9 6900HX
0.545 fps per Watt -6%
NVIDIA GeForce RTX 3080 Ti Laptop GPU
MSI Titan GT77 12UHS, i9-12900HX
0.521 fps per Watt -10%
NVIDIA GeForce RTX 3080 Ti Laptop GPU
Alienware x17 R2 P48E, i9-12900HK
0.512 fps per Watt -12%
NVIDIA GeForce RTX 3090
Intel Core i5-13400F, i5-13400F
0.3954 fps per Watt -32%
NVIDIA GeForce RTX 3080 Ti
ASUS TUF Gaming GeForce RTX 3080 Ti OC, R9 7950X
0.3496 fps per Watt -40%
NVIDIA GeForce RTX 3090 Ti
Zotac Gaming GeForce RTX 3090 Ti AMP Extreme Holo, R7 5800X3D
0.345 fps per Watt -41%

Emisiones

Ruido del sistema - Fuerte bajo carga

El ruido del ventilador cubre bastante bien ambos extremos en el sentido de que puede ser muy silencioso cuando se ejecutan cargas poco exigentes y muy alto cuando se ejecutan cargas más exigentes como juegos. Cuando simplemente navega o hace streaming de vídeo, por ejemplo, el ruido del ventilador tendería a rondar los 28,5 dB(A) contra un fondo silencioso de 23,8 dB(A) para ser mayormente inaudible. Cuando se ejecuta Witcher 3, sin embargo, el ruido del ventilador puede alcanzar casi los 52 dB(A) para ser tan ruidoso como el Inspiron 16 Plus de la competencia o algunos portátiles para juegos como el Razer Blade 16.

La solución de refrigeración consta de dos ventiladores de 75 mm, tres tubos de calor y una interfaz térmica líquida desarrollada por Cooler Master
La dGPU se sitúa debajo de las rejillas cuando se inserta el módulo. Las pulsaciones del ventilador se mantienen afortunadamente al mínimo cuando las cargas en pantalla son constantes
2 ranuras SODIMM accesibles
La CPU AMD se sitúa cerca del centro del teclado
Perfil de ruido del ventilador (Blanco: Fondo, Rojo: Sistema en reposo, Azul: 3DMark 06, Naranja: Witcher 3 verde: Prime95+FurMark estrés)

Ruido

Ocioso
23.9 / 23.9 / 23.9 dB(A)
Carga
28.5 / 53.7 dB(A)
  red to green bar
 
 
30 dB
silencioso
40 dB(A)
audible
50 dB(A)
ruidosamente alto
 
min: dark, med: mid, max: light   Earthworks M23R, Arta (15 cm de distancia)   ruido ambiental: 23.8 dB(A)
dB(A) 0102030405060708090Deep BassMiddle BassHigh BassLower RangeMidsHigher MidsLower HighsMid HighsUpper HighsSuper Highs2031.730.934.331.733.22524.42326.125.425.1312222.423.422.522.94022.124.323.220.823.2502426.922.72425.26323.924.321.822.225.58027.925.524.924.128.51002622.322.319.726.412524.918.317.416.726.516027.719.616.415.329.620030.524.116.715.331.725033.721.215.916.535.731534.120.117.81835.840037.521.217.716.238.850037.820.513.41339.463035.417.91112.537.180037.116.51010.439.2100039.115.69.79.940.8125041.215.89.910.142.3160041.816.110.310.243.2200041.818.110.410.343.4250040.314.210.510.642.8315041.314.111.211.143400041.314.711.411.442.850004214.211.511.843.9630038.316.412.111.841800032.71311.911.735.61000030.314.812.612331250025.613.311.711.828.51600022.21311.110.824.2SPL51.928.523.923.853.7N8.11.10.50.59.2median 37.1median 16.4median 11.7median 11.8median 38.8Delta6.32.82.72.46.4hearing rangehide median Fan NoiseFramework Laptop 16
Framework Laptop 16
Radeon RX 7700S, R9 7940HS, WDC PC SN810 1TB
MSI Prestige 16 B1MG-001US
Arc 8-Core, Ultra 7 155H, Samsung PM9A1 MZVL22T0HBLB
Lenovo ThinkPad Z16 Gen 2
Radeon RX 6550M, R9 PRO 7940HS, Kioxia XG8 KXG8AZNV1T02
Apple MacBook Pro 16 2023 M3 Max
M3 Max 40-Core GPU, Apple M3 Max 16-Core, Apple SSD AP8192Z
Dell Inspiron 16 Plus 7630
NVIDIA GeForce RTX 4060 Laptop GPU, i7-13700H, WD PC SN740 SDDPTQD-1T00
HP Spectre x360 2-in-1 16-f1075ng
Iris Xe G7 96EUs, i7-12700H, SK Hynix PC711 1TB HFS001TDE9X073N
Noise
-6%
-5%
-0%
-1%
-6%
apagado / medio ambiente *
23.8
24.5
-3%
22.6
5%
23.7
-0%
23.2
3%
26
-9%
Idle Minimum *
23.9
24.5
-3%
22.9
4%
23.7
1%
23.2
3%
26
-9%
Idle Average *
23.9
26.3
-10%
29.4
-23%
23.7
1%
23.2
3%
26
-9%
Idle Maximum *
23.9
26.3
-10%
29.4
-23%
23.7
1%
23.2
3%
26
-9%
Load Average *
28.5
36.5
-28%
29.5
-4%
40.8
-43%
35.1
-23%
42.9
-51%
Witcher 3 ultra *
51.9
46.3
11%
52
-0%
42.8
18%
52.5
-1%
42.9
17%
Load Maximum *
53.7
52.9
1%
52
3%
42.8
20%
52.5
2%
39.1
27%

* ... más pequeño es mejor

Temperatura

Las temperaturas superficiales son siempre cálidas debido al chasis metálico y a los aletargados ventiladores. Cuando se ejecutan cargas más exigentes como juegos, los puntos calientes pueden alcanzar más de 40 C en los lados superior e inferior de la base del portátil. Los puntos calientes están más cerca del centro del portátil 16, mientras que en la mayoría de los demás portátiles suelen estar hacia la parte trasera. Esto significa que es más probable que note que el sistema Framework se calienta durante el uso en comparación con algo como el HP Spectre x360 16 donde los reposamanos y las zonas frontales tienden a ser más frías. Aún así, nunca encontramos el portátil 16 incómodamente caliente sobre la piel.

Tenga en cuenta que el adaptador de CA USB-C de 180 W es uno de los más pequeños que hemos visto (~11,6 z 5,7 x 2,6 cm) para su potencia de salida. Su tamaño compacto es posible gracias a los transistores GaN, una tecnología que Razer también utiliza para sus propios adaptadores de CA. El inconveniente del GaN es que los propios adaptadores pueden calentarse mucho a más de 60 C según nuestra experiencia. En comparación, los cargadores más grandes que no son de GaN suelen oscilar entre 40 C y 50 C bajo carga.

Cuatro juegos de rejillas de escape
El adaptador de CA puede alcanzar más de 60 C cuando funciona con cargas exigentes
 38 °C35.4 °C33.4 °C 
 42.4 °C41.2 °C38.8 °C 
 32.4 °C33.2 °C30.6 °C 
Máximo: 42.4 °C
Médio: 36.2 °C
34.6 °C39.6 °C38.6 °C
33.4 °C40.8 °C38.6 °C
29.4 °C36.6 °C34.2 °C
Máximo: 40.8 °C
Médio: 36.2 °C
Conector de corriente  52.2 °C | Temperatura del cuarto 20 °C | Fluke 62 Mini IR Thermometer
(±) La temperatura media de la parte superior bajo carga máxima es de 36.2 °C / 97 F, en comparación con la media de 31.3 °C / 88 F de los dispositivos de la clase Multimedia.
(±) La temperatura máxima en la parte superior es de 42.4 °C / 108 F, frente a la media de 36.9 °C / 98 F, que oscila entre 21.1 y 71 °C para la clase Multimedia.
(±) El fondo se calienta hasta un máximo de 40.8 °C / 105 F, frente a la media de 39.2 °C / 103 F
(+) En reposo, la temperatura media de la parte superior es de 28.7 °C / 84# F, frente a la media del dispositivo de 31.3 °C / 88 F.
(+) Jugando a The Witcher 3, la temperatura media de la parte superior es de 30.2 °C / 86 F, frente a la media del dispositivo de 31.3 °C / 88 F.
(+) Los reposamanos y el panel táctil alcanzan como máximo la temperatura de la piel (33.2 °C / 91.8 F) y, por tanto, no están calientes.
(-) La temperatura media de la zona del reposamanos de dispositivos similares fue de 28.8 °C / 83.8 F (-4.4 °C / -8 F).
Sistema inactivo (arriba)
Sistema inactivo (abajo)
Witcher 3 estrés (arriba)
Witcher 3 tensión (abajo)
Tensión Prime95+FurMark (arriba)
Tensión Prime95+FurMark (abajo)
Framework Laptop 16
AMD Ryzen 9 7940HS, AMD Radeon RX 7700S
MSI Prestige 16 B1MG-001US
Intel Core Ultra 7 155H, Intel Arc 8-Core iGPU
Lenovo ThinkPad Z16 Gen 2
AMD Ryzen 9 PRO 7940HS, AMD Radeon RX 6550M
Apple MacBook Pro 16 2023 M3 Max
Apple M3 Max 16-Core, Apple M3 Max 40-Core GPU
Dell Inspiron 16 Plus 7630
Intel Core i7-13700H, NVIDIA GeForce RTX 4060 Laptop GPU
HP Spectre x360 2-in-1 16-f1075ng
Intel Core i7-12700H, Intel Iris Xe Graphics G7 96EUs
Heat
2%
13%
11%
-14%
9%
Maximum Upper Side *
42.4
48.8
-15%
43
-1%
42.3
-0%
47.8
-13%
37.4
12%
Maximum Bottom *
40.8
47.6
-17%
41.6
-2%
42
-3%
42.2
-3%
39.1
4%
Idle Upper Side *
31.4
24.2
23%
21.2
32%
22.5
28%
35.2
-12%
27.1
14%
Idle Bottom *
27.8
23.6
15%
21.4
23%
22.9
18%
35
-26%
26.3
5%

* ... más pequeño es mejor

Prueba de estrés

La CPU aumentaba a 4,6 GHz y 80 W durante el primer par de segundos al iniciar el estrés Prime95 antes de caer rápidamente y estabilizarse en 4,0 GHz, 54 W y unos 96 C más tostados de lo esperado. Repitiendo esta misma prueba en el Lenovo Slim Pro 9i 16 con el Core i9-13905H daría como resultado una temperatura del núcleo más fría de 82 C. Esto sugiere que Framework preferiría aumentar el rendimiento del procesador y limitar la ralentización, incluso si esto significa temperaturas medias del núcleo más altas, lo que los entusiastas podrían apreciar.

La GPU se estabilizaría en 2363 MHz y 99 W en funcionamiento Witcher 3 lo que significa que puede utilizar todo su presupuesto de 100 W al jugar. La temperatura del núcleo se mantendría decentemente baja a 66 C en comparación con los 62 C del Lenovo con motor GeForce antes mencionado.

Sistema inactivo
Sistema inactivo
Witcher 3 estrés
Witcher 3 estrés
Prime95 estrés
Prime95 estrés
Prime95+Tensión FurMark
Reloj dela CPU (GHz) Reloj de la GPU (MHz) Temperatura media dela CPU (°C) Temperatura media de la GPU (°C)
Sistema en reposo -- -- 32 41
Prime95 Stress 4.0 -- 96 30
Estrés Prime95+ FurMark 4,0 1200 100 53
Witcher 3 Tensión ~0,7 2363 56 66

Altavoces

Altavoces estéreo descendentes situados cerca de las esquinas delanteras
El ruido rosa muestra un equilibrio excelente, pero el volumen máximo podría ser un poco más alto
dB(A) 0102030405060708090Deep BassMiddle BassHigh BassLower RangeMidsHigher MidsLower HighsMid HighsUpper HighsSuper Highs2031.834.331.82523.326.123.33123.823.423.84022.923.222.95027.222.727.26330.921.830.98038.724.938.710044.822.344.812547.917.447.916055.916.455.920059.916.759.92506515.96531565.217.865.240067.517.767.550066.113.466.163065.71165.780070.11070.1100067.39.767.3125067.29.967.2160069.310.369.320007210.472250068.910.568.931506511.265400067.111.467.1500067.911.567.9630070.112.170.1800066.611.966.61000063.412.663.41250059.211.759.21600048.711.148.7SPL80.223.980.2N51.10.551.1median 66.1median 11.7median 66.1Delta4.12.74.126.325.821.422.12624.925.127.622.532.523.448.72655.818.860.922.167.2267019.372.317.674.217.774.319.575.31571.711.871.311.27410.574.21072.710.17210.67210.97511.374.811.671.71269.71269.612.371.112.669.61270.111.269.824.784.70.666.6median 12median 71.73.42.2hearing rangehide median Pink NoiseFramework Laptop 16Apple MacBook Pro 16 2021 M1 Pro
Diagrama de frecuencia en comparación (¡las casillas de verificación se pueden marcar y desmarcar!)
Framework Laptop 16 análisis de audio

(±) | la sonoridad del altavoz es media pero buena (80.2 dB)
Graves 100 - 315 Hz
(±) | lubina reducida - en promedio 9.6% inferior a la mediana
(±) | la linealidad de los graves es media (8.1% delta a frecuencia anterior)
Medios 400 - 2000 Hz
(+) | medios equilibrados - a sólo 2.2% de la mediana
(+) | los medios son lineales (3.8% delta a la frecuencia anterior)
Altos 2 - 16 kHz
(+) | máximos equilibrados - a sólo 2% de la mediana
(+) | los máximos son lineales (4.9% delta a la frecuencia anterior)
Total 100 - 16.000 Hz
(+) | el sonido global es lineal (10.5% de diferencia con la mediana)
En comparación con la misma clase
» 11% de todos los dispositivos probados de esta clase eran mejores, 1% similares, 88% peores
» El mejor tuvo un delta de 5%, la media fue 18%, el peor fue ###max##%
En comparación con todos los dispositivos probados
» 4% de todos los dispositivos probados eran mejores, 1% similares, 95% peores
» El mejor tuvo un delta de 4%, la media fue 25%, el peor fue ###max##%

Apple MacBook Pro 16 2021 M1 Pro análisis de audio

(+) | los altavoces pueden reproducir a un volumen relativamente alto (#84.7 dB)
Graves 100 - 315 Hz
(+) | buen bajo - sólo 3.8% lejos de la mediana
(+) | el bajo es lineal (5.2% delta a la frecuencia anterior)
Medios 400 - 2000 Hz
(+) | medios equilibrados - a sólo 1.3% de la mediana
(+) | los medios son lineales (2.1% delta a la frecuencia anterior)
Altos 2 - 16 kHz
(+) | máximos equilibrados - a sólo 1.9% de la mediana
(+) | los máximos son lineales (2.7% delta a la frecuencia anterior)
Total 100 - 16.000 Hz
(+) | el sonido global es lineal (4.6% de diferencia con la mediana)
En comparación con la misma clase
» 0% de todos los dispositivos probados de esta clase eran mejores, 0% similares, 100% peores
» El mejor tuvo un delta de 5%, la media fue 18%, el peor fue ###max##%
En comparación con todos los dispositivos probados
» 0% de todos los dispositivos probados eran mejores, 0% similares, 100% peores
» El mejor tuvo un delta de 4%, la media fue 25%, el peor fue ###max##%

Gestión de la energía

Consumo de energía

El consumo de energía es comparable al del Dell Inspiron 16 Plus o el MacBook Pro 16 2023 cuando está en ralentí o cuando ejecuta cargas poco exigentes. Sin embargo, cuando se ejecutan cargas más altas como juegos, el consumo sería más alto de lo esperado. Ejecutando Witcher 3 demandaría 172 W en comparación con sólo 122 W en el Inspiron 16 Plus con RTX 4060. Si tenemos en cuenta que la RTX 4060 puede superar con frecuencia a la Radeon RX 7700S en muchos juegos, el rendimiento de la GPU por vatio del Laptop 16 no es tan bueno como la alternativa de Nvidia, lo que respalda nuestras afirmaciones anteriores.

La CPU también puede ser bastante exigente con un consumo de todo el sistema de 110 W cuando se ejecuta Prime95 en comparación con sólo 75 W en el MSI Stealth 16 alimentado por el Core i9-13900H.

Podemos registrar un consumo máximo de 176 W desde el pequeño adaptador de CA USB-C de 180 W al ejecutar juegos u otras cargas extremas como Prime95 y FurMark. Esto es importante tenerlo en cuenta porque la sobrecarga limitada del adaptador de CA puede suponer un cuello de botella para el rendimiento o las capacidades de carga del portátil. En este caso, la velocidad de carga se ve afectada cuando se ejecutan cargas exigentes. Por ejemplo, podemos observar el drenaje de la batería del 100% al 85% cuando está conectado a una toma de corriente y funcionando Witcher 3 lo que significa que no es posible cargar la batería a un ritmo decente mientras se ejecutan cargas exigentes simultáneamente. Tal escenario nunca ocurriría en la mayoría de los demás portátiles.

consumo 3DMark 06
consumo 3DMark 06
Witcher 3 1080p Ultra consumo
El consumo se disparaba hasta 149 W al iniciar el Prime95 antes de descender de forma constante y estabilizarse en 110 W
Estrés Prime95+FurMark iniciado en la marca de los 10s. El consumo se mantendría estable en 176 W con el adaptador de CA USB-C de 180 W
Consumo de corriente
Off / Standbydarklight 0.83 / 1.3 Watt
Ociosodarkmidlight 9.5 / 17 / 17.2 Watt
Carga midlight 96.2 / 175.7 Watt
 color bar
Clave: min: dark, med: mid, max: light        Metrahit Energy
Framework Laptop 16
R9 7940HS, Radeon RX 7700S, WDC PC SN810 1TB, , 2560x1600, 16"
MSI Prestige 16 B1MG-001US
Ultra 7 155H, Arc 8-Core, Samsung PM9A1 MZVL22T0HBLB, IPS, 2560x1600, 16"
Lenovo ThinkPad Z16 Gen 2
R9 PRO 7940HS, Radeon RX 6550M, Kioxia XG8 KXG8AZNV1T02, OLED, 3840x2400, 16"
Apple MacBook Pro 16 2023 M3 Max
Apple M3 Max 16-Core, M3 Max 40-Core GPU, Apple SSD AP8192Z, Mini-LED, 3456x2234, 16"
Dell Inspiron 16 Plus 7630
i7-13700H, NVIDIA GeForce RTX 4060 Laptop GPU, WD PC SN740 SDDPTQD-1T00, IPS, 2560x1600, 16"
HP Spectre x360 2-in-1 16-f1075ng
i7-12700H, Iris Xe G7 96EUs, SK Hynix PC711 1TB HFS001TDE9X073N, IPS, 3072x1920, 16"
Power Consumption
46%
26%
18%
-5%
40%
Idle Minimum *
9.5
3
68%
7.5
21%
5.2
45%
15.6
-64%
9
5%
Idle Average *
17
9.5
44%
9.6
44%
16.9
1%
17.7
-4%
11.1
35%
Idle Maximum *
17.2
12
30%
18.5
-8%
17.2
-0%
20.6
-20%
16.4
5%
Load Average *
96.2
68.3
29%
57.1
41%
90.5
6%
87.4
9%
38.3
60%
Witcher 3 ultra *
171.9
59.8
65%
115.8
33%
109
37%
121.7
29%
34.4
80%
Load Maximum *
175.7
104.8
40%
131.7
25%
145.2
17%
138
21%
82.5
53%

* ... más pequeño es mejor

Power Consumption Witcher 3 / Stresstest

0102030405060708090100110120130140150160170Tooltip
Framework Laptop 16 R9 7940HS, Radeon RX 7700S; Witcher 3 ultra: Ø171.9 (168.9-173.3)
Lenovo Legion Slim 7 16APH8 R7 7840HS, NVIDIA GeForce RTX 4060 Laptop GPU; Witcher 3 ultra: Ø131 (121.3-141.9)
Framework Laptop 16 R9 7940HS, Radeon RX 7700S; 1280x720 Prime95 28.10 and Furmark 1.25: Ø174.9 (171.7-176)
Lenovo Legion Slim 7 16APH8 R7 7840HS, NVIDIA GeForce RTX 4060 Laptop GPU; 1280x720 Prime95 28.10 and Furmark 1.25: Ø135.6 (102.3-176.9)
Framework Laptop 16 R9 7940HS, Radeon RX 7700S; Idle 150cd/m2: Ø15.6 (14.7-17.9)
Lenovo Legion Slim 7 16APH8 R7 7840HS, NVIDIA GeForce RTX 4060 Laptop GPU; Idle 150cd/m2: Ø35.5 (33-45)

Power Consumption external Monitor

0102030405060708090100110120130140150160170Tooltip
Framework Laptop 16 R9 7940HS, Radeon RX 7700S; Prime95 V2810 Stress (external Monitor): Ø120.9 (108.6-148.6)
Lenovo Legion Slim 7 16APH8 R7 7840HS, NVIDIA GeForce RTX 4060 Laptop GPU; Prime95 V2810 Stress (external Monitor): Ø93.3 (86.4-103.2)
Framework Laptop 16 R9 7940HS, Radeon RX 7700S; Cinebench R15 Multi (external Monitor): Ø120.9 (113.5-130.2)
Lenovo Legion Slim 7 16APH8 R7 7840HS, NVIDIA GeForce RTX 4060 Laptop GPU; Cinebench R23 Multi (external Monitor): Ø99.8 (88.5-104)
Framework Laptop 16 R9 7940HS, Radeon RX 7700S; 1280x720 FurMark 1.19 GPU Stress Test (external Monitor): Ø167.5 (165.6-169.8)
Lenovo Legion Slim 7 16APH8 R7 7840HS, NVIDIA GeForce RTX 4060 Laptop GPU; 1280x720 FurMark 1.19 GPU Stress Test (external Monitor): Ø117.8 (107.6-120.1)
Framework Laptop 16 R9 7940HS, Radeon RX 7700S; 1920x1080 The Witcher 3 ultra (external Monitor): Ø171.3 (170.7-172)
Lenovo Legion Slim 7 16APH8 R7 7840HS, NVIDIA GeForce RTX 4060 Laptop GPU; 1920x1080 The Witcher 3 ultra (external Monitor): Ø126.8 (116-135.3)
Framework Laptop 16 R9 7940HS, Radeon RX 7700S; Idle 1min (external Monitor): Ø13.9 (13.1-16.5)
Lenovo Legion Slim 7 16APH8 R7 7840HS, NVIDIA GeForce RTX 4060 Laptop GPU; Idle 1min (external Monitor): Ø17.6 (16.9-19.9)

Duración de las pilas

Pequeño cargador GaN USB-C de 180 W

La duración de la batería de 85 Wh es respetable con algo más de 9 horas de navegación WLAN en el mundo real para ser similar a la del Dell Inspiron 16 Plus 7630 o el HP Spectre x360 2 en 1. Recomendamos ajustar la pantalla a una frecuencia de actualización variable en lugar de su fija y predeterminada de 165 Hz para exprimir más la batería. Con el ajuste dinámico de 83 Hz a 165 Hz, por ejemplo, podemos durar 20 minutos más en la misma prueba WLAN. La mayoría de los smartphones emplean esta misma técnica para ahorrar batería.

La carga desde vacío a plena capacidad con el adaptador de CA incluido tarda unas 2 horas si está en reposo en el escritorio o ejecutando cargas poco exigentes. Sin embargo, si se ejecutan cargas más extremas, la batería se cargaría mucho más lentamente, como se ha mencionado anteriormente. Un adaptador de CA USB-C de 240 W más grande podría haber resuelto potencialmente este problema.

Tiempo de Ejecución de la Batería
Ocioso (sin WLAN, min brillo)
14h 50min
WiFi Websurfing
9h 08min
Carga (máximo brillo)
1h 32min
Framework Laptop 16
R9 7940HS, Radeon RX 7700S, 85 Wh
MSI Prestige 16 B1MG-001US
Ultra 7 155H, Arc 8-Core, 99.9 Wh
Lenovo ThinkPad Z16 Gen 2
R9 PRO 7940HS, Radeon RX 6550M, 72 Wh
Apple MacBook Pro 16 2023 M3 Max
Apple M3 Max 16-Core, M3 Max 40-Core GPU, 99.6 Wh
Dell Inspiron 16 Plus 7630
i7-13700H, NVIDIA GeForce RTX 4060 Laptop GPU, 86 Wh
HP Spectre x360 2-in-1 16-f1075ng
i7-12700H, Iris Xe G7 96EUs, 83 Wh
Duración de Batería
83%
-19%
30%
5%
19%
Reader / Idle
890
1506
69%
612
-31%
1055
19%
1233
39%
WiFi v1.3
548
1100
101%
357
-35%
999
82%
566
3%
630
15%
Load
92
166
80%
101
10%
71
-23%
85
-8%
95
3%
H.264
1221
671

Pro

+ pantalla IPS de 165 Hz con VRR y FreeSync de serie
+ piezas reparables y sustituibles por el usuario
+ gran rendimiento de la CPU y la GPU AMD
+ adaptador de CA USB-C extrapequeño de 180 W
+ seis puertos USB-C personalizables

Contra

- el diseño de la dGPU desmontable pierde mucho valor en comparación con las soluciones de dGPU universales
- más grande y pesado que muchos otros portátiles de 16 pulgadas
- velocidad de carga de la batería lenta cuando se juega
- rendimiento por vatio relativamente bajo
- sin soporte HDR ni opciones OLED

Veredicto - Una mayor capacidad de reparación implica un mayor tamaño y peso

En revisión: Framework Laptop 16

La tendencia hacia portátiles más delgados y ligeros es posible gracias a la fusión de cada vez más componentes en la placa base. El principal inconveniente de este enfoque es que limita la reparabilidad, ya que incluso un pequeño fallo puede requerir la sustitución de placas enteras. Framework es uno de los únicos fabricantes que mira hacia otro lado en un intento de mejorar la personalización y el mantenimiento por parte del usuario final. No hay duda de que el portátil 16 es más fácil de reparar que cualquier otra alternativa, pero esta lucrativa característica se consigue a costa del tamaño y el peso, ya que los componentes individuales deben ser fácilmente reemplazables. Si sólo tiene intención de actualizar la RAM o la SSD una o dos veces a lo largo de la vida del portátil, entonces alternativas de 16 pulgadas más compactas y fáciles de transportar como el Inspiron 16 Plus o el Asus VivoBook Pro 16 podrían servirle mejor en este sentido.

La dGPU extraíble también es un esfuerzo arriesgado, ya que históricamente no ha tenido éxito por parte de los OEM más grandes como Dell y Lenovo. El hecho de que existan opciones universales de eGPU basadas en USB4 o Thunderbolt hace que la dGPU especializada del portátil 16 sea mucho menos convincente. Si de verdad desea gráficos discretos en sus desplazamientos, entonces la GeForce RTX 4060 puede ofrecer tanto mejor rendimiento como rendimiento por vatio que la Radeon 7700S. Por tanto, Framework tendrá que respaldar el diseño de la dGPU Laptop 16 durante años con futuras opciones RDNA para que la inversión merezca la pena. Comprar hoy significará confiar en que la empresa hará precisamente eso.

El Framework Laptop 16 es más grande y pesado que otros portátiles de 16 pulgadas en nombre de la reparabilidad y la sostenibilidad. Si actualiza a menudo o prevé reparaciones, el Laptop 16 puede merecer la pena. Si no, las alternativas de los OEM más grandes suelen ser más rápidas y ligeras.

Por las razones anteriores, los compradores interesados deberían valorar las tarjetas de expansión, el ángulo de sostenibilidad y la alta reparabilidad del girthy Laptop 16, ya que las alternativas tienden a ser más delgadas, ligeras y, a veces, más rápidas, especialmente en el rango de los 2.000 dólares. Si Framework puede igualar de algún modo el tamaño del Razer Blade 16 o MacBook Pro manteniendo la reparabilidad, entonces las futuras revisiones pueden convertirse potencialmente en algo muy especial. Por ahora, tendrá que sacrificar un poco de portabilidad para poder disfrutar de todas las características únicas del Framework.

Precio y disponibilidad

Framework ya está aceptando pedidos anticipados para el Laptop 16 comenzando en $1400 USD para la edición base Ryzen 7 DIY hasta más de $2400 cuando se configura con Ryzen 9, gráficos discretos Radeon 7700S y múltiples tarjetas y módulos de expansión.

Framework Laptop 16 - 01/23/2024 v7 (old)
Allen Ngo

Acabado
80 / 98 → 82%
Teclado
90%
Ratón
89%
Conectividad
62 / 80 → 77%
Peso
60 / 20-72 → 78%
Battería
86 / 95 → 91%
Pantalla
92%
Rendimiento de juegos
97 / 90 → 100%
Rendimiento de la Aplicación
97 / 90 → 100%
Temperatura
90%
Ruido
86 / 95 → 91%
Audio
86%
Cámara
47 / 85 → 55%
Médio
82%
90%
Multimedia - media ponderada

Transparencia

La selección de los dispositivos que se van a reseñar corre a cargo de nuestro equipo editorial. La muestra de prueba fue proporcionada al autor en calidad de préstamo por el fabricante o el minorista a los efectos de esta reseña. El prestamista no tuvo ninguna influencia en esta reseña, ni el fabricante recibió una copia de la misma antes de su publicación. No había ninguna obligación de publicar esta reseña. Nunca aceptamos compensaciones o pagos a cambio de nuestras reseñas. Como empresa de medios independiente, Notebookcheck no está sujeta a la autoridad de fabricantes, minoristas o editores.

Así es como prueba Notebookcheck

Cada año, Notebookcheck revisa de forma independiente cientos de portátiles y smartphones utilizando procedimientos estandarizados para asegurar que todos los resultados son comparables. Hemos desarrollado continuamente nuestros métodos de prueba durante unos 20 años y hemos establecido los estándares de la industria en el proceso. En nuestros laboratorios de pruebas, técnicos y editores experimentados utilizan equipos de medición de alta calidad. Estas pruebas implican un proceso de validación en varias fases. Nuestro complejo sistema de clasificación se basa en cientos de mediciones y puntos de referencia bien fundamentados, lo que mantiene la objetividad.

Price comparison

Please share our article, every link counts!
Mail Logo
> Análisis y pruebas de ordenadores portátiles y móviles teléfonos > Análisis > Debut del rendimiento de la Radeon RX 7700S: Análisis del Framework Laptop 16
Allen Ngo, 2024-01-24 (Update: 2024-01-24)