Notebookcheck Logo
Teaser

Análisis del Acer Predator Triton Neo 16: Un portátil premium con una RTX 4070 para jugadores y creadores

Una pantalla brillante.

Mientras que el Nitro V 16 que probamos hace poco solo nos impresionó de forma limitada debido a su escasa pantalla, el Predator Triton Neo 16 nos dejó mucho mejor sabor de boca. Pusimos a prueba al gamer de 16 pulgadas con una CPU Meteor Lake y una GeForce RTX 4070.
Florian Glaser, 👁 Florian Glaser (traducido por DeepL / Ninh Duy) Published 🇺🇸 🇩🇪 ...
Intel Meteor Lake Arc Nvidia Geforce Gaming Laptop / Notebook

Veredicto - Un caramelo para la vista de Acer

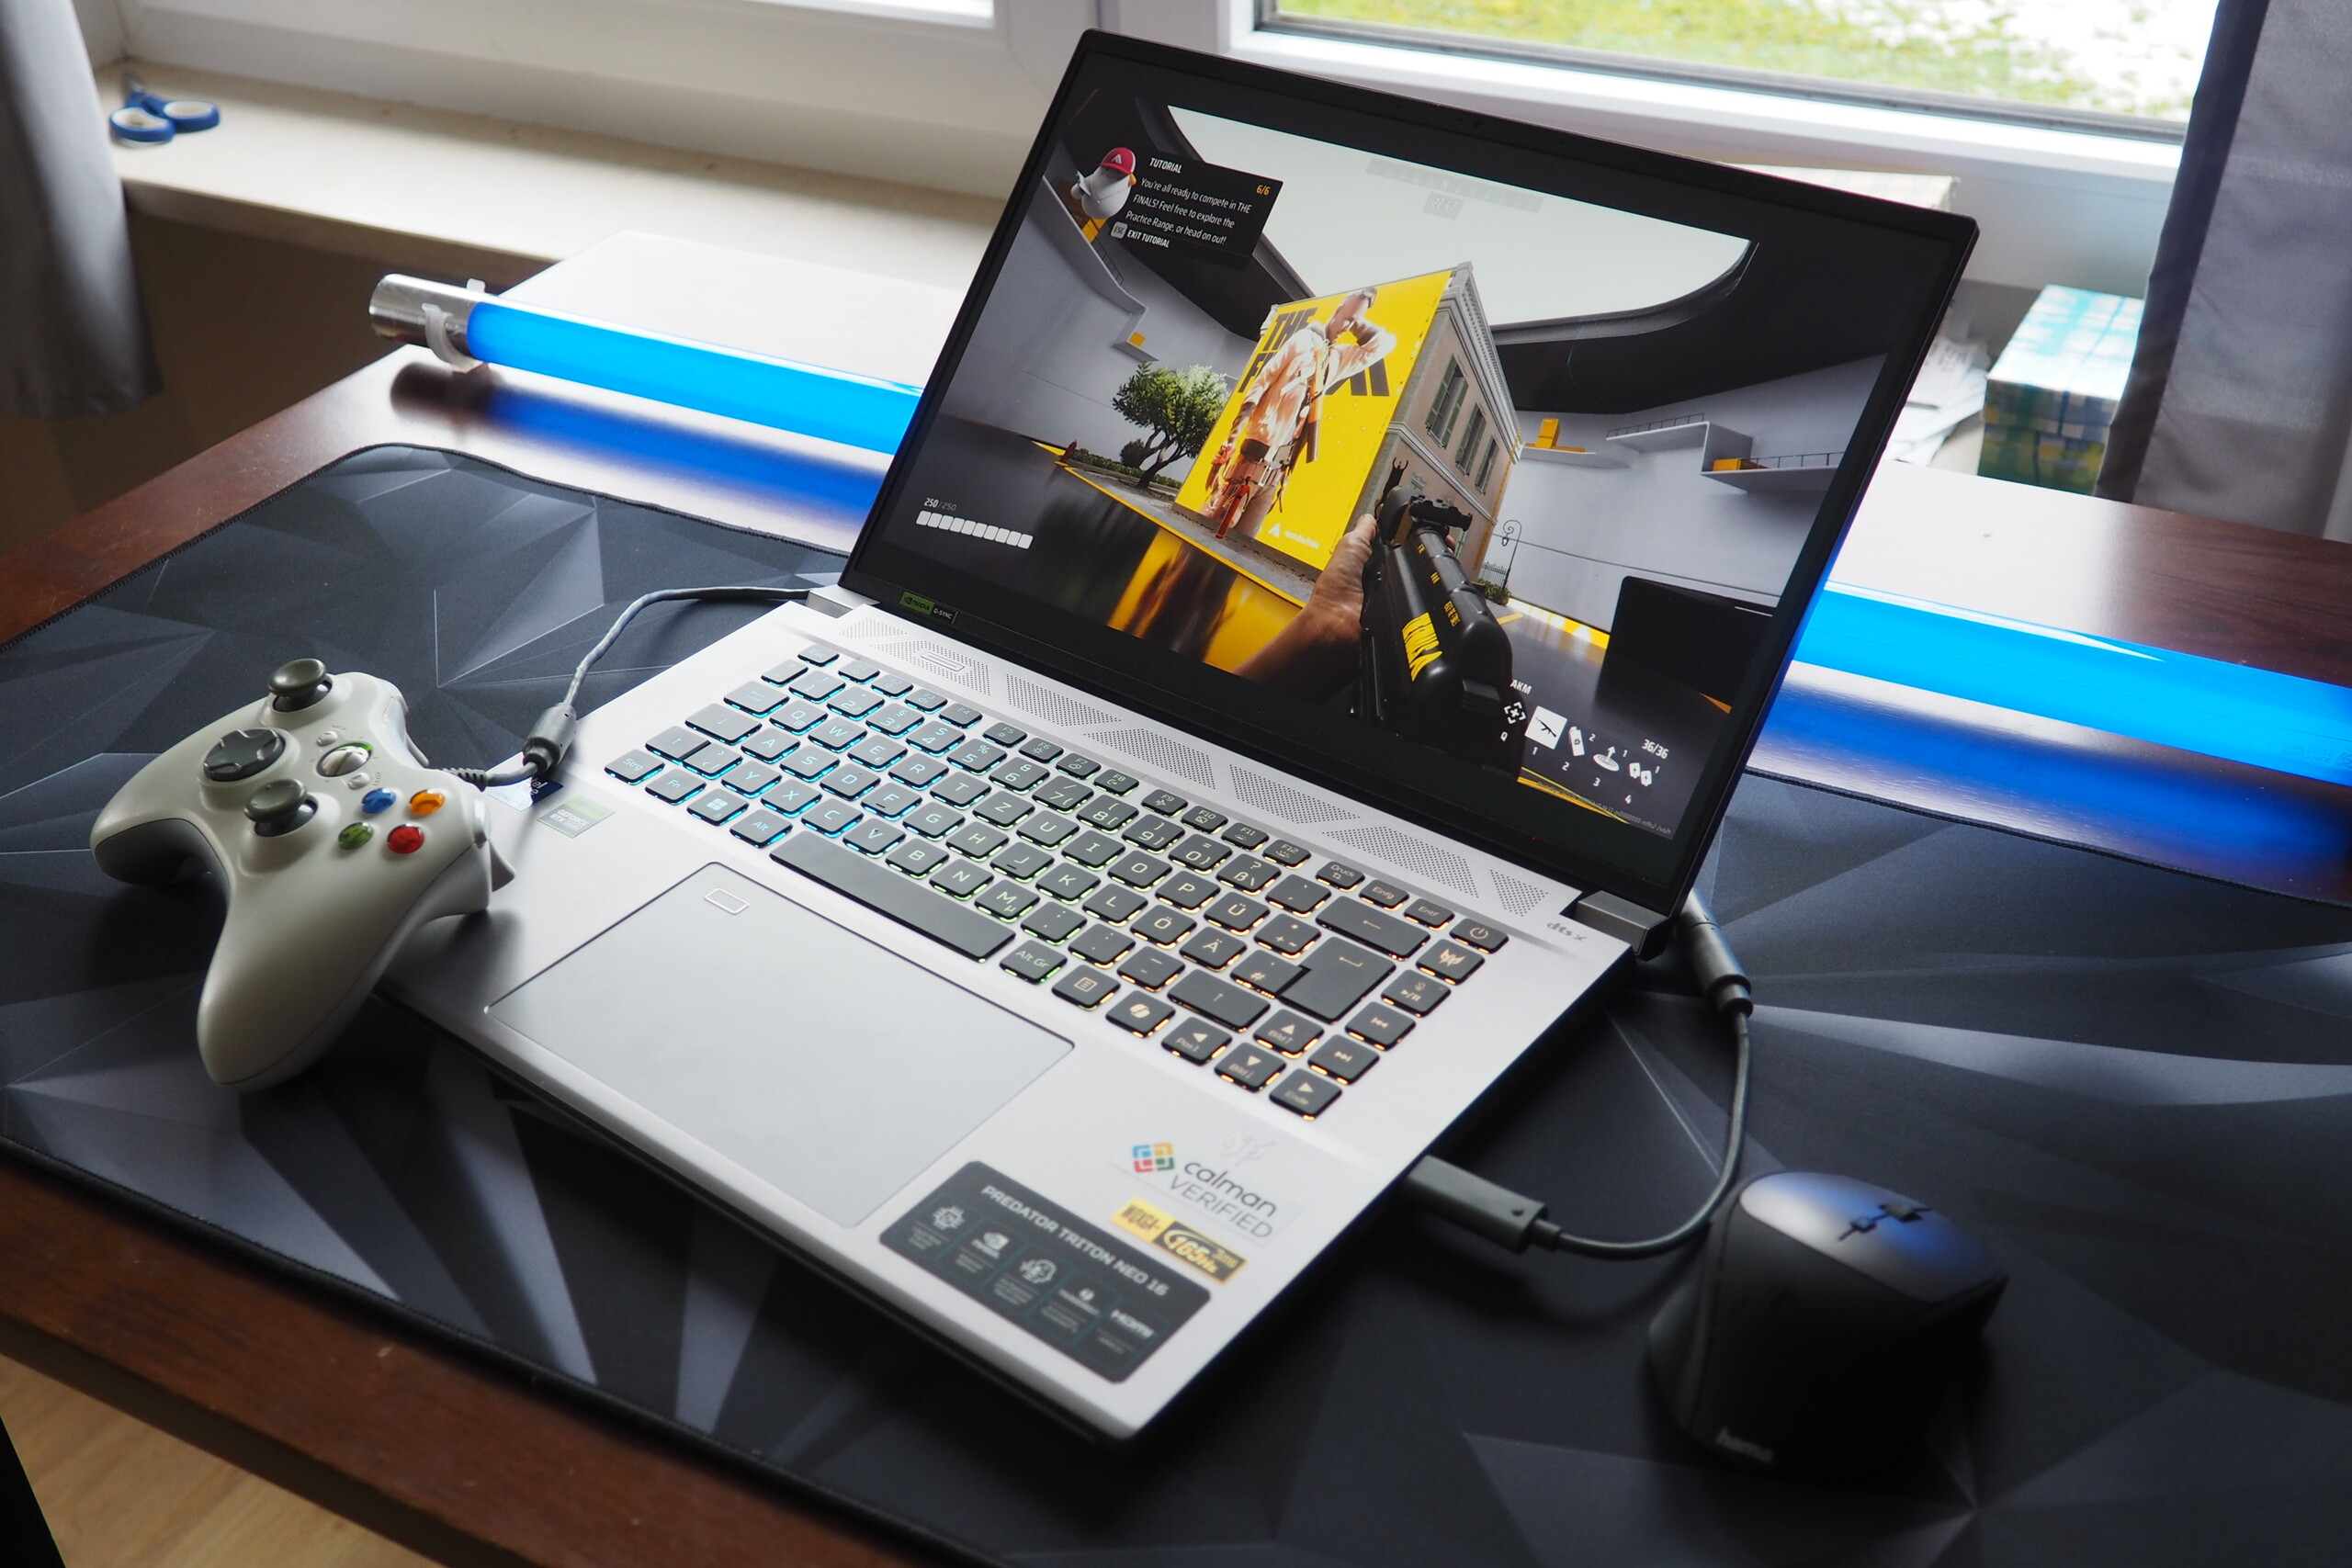
Si está a la caza de un portátil elegante y de alta calidad para crear y jugar, el Predator Triton Neo 16 puede ser el que busca. Acer no sólo ha dado a este dispositivo de 16 pulgadas un nombre absurdamente largo, sino también una carcasa metálica estable cuyas superficies de color gris plateado apenas atraen las marcas de huellas dactilares. Sus opciones de conectividad tampoco están nada mal gracias a su compatibilidad con USB 4. Además, la calidad de imagen del Neo 16 es igualmente impresionante. Su pantalla de 165 Hz basada en la tecnología IPS ofrece buenos niveles de brillo, una alta resolución (3.200 x 2.000 píxeles), una generosa cobertura del espacio de color y, gracias a su certificación Calman, una respetable precisión del color.

El rendimiento de su GPU, en cambio, no es tan impresionante. La GeForce RTX 4070 sólo puede desarrollar una parte limitada de su rendimiento potencial y se sitúa por debajo de nuestra media previamente determinada. Además, no hay muchas opciones de mantenimiento y actualización. Aunque el dispositivo de 16 pulgadas cuenta con dos ranuras M.2 (una de las cuales aún está libre), su memoria RAM ha sido soldada, por lo que los 32 GB que incorpora nuestro dispositivo de prueba probablemente sean suficientes para la mayoría de los usuarios por el momento. En conjunto, calificaríamos el Predator Triton Neo 16 como un portátil bueno pero no sobresaliente para crear y jugar.

La competencia incluye otros dispositivos de 16 pulgadas con una RTX 4070 como el Asus ProArt P16 H7606WI, el Lenovo Yoga Pro 9 16IMH9, el Asus ROG Zephyrus G16 GU605M y el Alienware m16 R2, que, sin embargo, suelen ser más caros.

Pro

+ carcasa elegante y de alta calidad
+ pantalla brillante y viva
+ dos ranuras M.2 (una desocupada)
+ sólida duración de la batería
+ buenos dispositivos de entrada
+ USB 4

Contra

- RTX 4070 rinde por debajo de sus posibilidades
- el control del ventilador podría ser mejor
- La RAM no se puede intercambiar
- sonido mediocre
- SSD se estrangula

Precio y disponibilidad

Actualmente, el Acer Predator Triton Neo 16 PTN16-51-978P está disponible a través de los principales minoristas en línea como Amazon, donde cuesta 1.399 dólares.

Posibles contendientes en la comparación

Image
Modelo
Price
Peso
Altura
Display
1.
81.1%
Acer Predator Triton Neo 16 PTN16-51-978P
Intel Core Ultra 9 185H ⎘
NVIDIA GeForce RTX 4070 Laptop GPU ⎘
32 GB Memoría, 1024 GB SSD
Amazon:
1. $1,088.49
Acer Predator Triton Neo 16 ...
2. $1,089.00
Acer Predator Triton Neo 16 ...
3. $2,058.01
acer Predator Triton Neo 16 ...
List Price: 1900 EUR
2 kg21 mm16.00"
3200x2000
236 PPI
IPS
2.
87.8%
Asus ProArt P16 H7606WI
AMD Ryzen AI 9 HX 370 ⎘
NVIDIA GeForce RTX 4070 Laptop GPU ⎘
64 GB Memoría, 1024 GB SSD
Amazon:
1. $2,879.00
HIDevolution [2024] ASUS Pro...
2. $2,239.00
ASUS ProArt P16 Laptop, AMD ...
3. $93.99
20V 10A 200W Laptop Charger ...
List Price: 4000€
1.8 kg17.3 mm16.00"
3840x2400
283 PPI
OLED
3.
88.7% v7 (old)
Lenovo Yoga Pro 9 16IMH9
Intel Core Ultra 9 185H ⎘
NVIDIA GeForce RTX 4070 Laptop GPU ⎘
32 GB Memoría, 1024 GB SSD
Amazon:
1. $2,099.99
Lenovo Yoga Pro 9i 16"" Lapt...
2. $38.99
170W Charger Fit for Lenovo ...
3. $38.00
Laptop Keyboard for Lenovo Y...
List Price: 2700€
2.1 kg18.3 mm16.00"
3200x2000
236 PPI
Mini-LED
4.
92.3% v7 (old)
Asus ROG Zephyrus G16 2024 GU605M
Intel Core Ultra 7 155H ⎘
NVIDIA GeForce RTX 4070 Laptop GPU ⎘
16 GB Memoría, 1024 GB SSD
Amazon: $1,888.86
List Price: 3000€
1.8 kg16.4 mm16.00"
2560x1600
189 PPI
OLED
5.
90.2% v7 (old)
Alienware m16 R2
Alienware m16 R2
Intel Core Ultra 7 155H ⎘
NVIDIA GeForce RTX 4070 Laptop GPU ⎘
16 GB Memoría, 1024 GB SSD
Amazon: $1,899.00
List Price: 1850 USD
2.5 kg23.5 mm16.00"
2560x1600
189 PPI
IPS

Acer ha equipado nuestra configuración de prueba con un Core Ultra 9 185H de la serie Meteor Lake y -como ya hemos mencionado- con una GeForce RTX 4070. También cuenta con unos impresionantes 32 GB de RAM LPDDR5X. La unidad SSD NVMe instalada tiene una capacidad de 1 TB. La pantalla del portátil tiene una relación de aspecto 16:10 y su sistema operativo es Windows 11 Home. La capacidad de su batería, de 76 Wh, no es ni baja ni especialmente generosa.

Especificaciones

Acer Predator Triton Neo 16 PTN16-51-978P (Predator Triton Neo 16 Serie)
Procesador
Intel Core Ultra 9 185H 16 x 3.8 - 5.1 GHz, 85 W PL2 / Short Burst, 65 W PL1 / Sustained, Meteor Lake-H
Adaptador gráfico
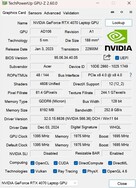
NVIDIA GeForce RTX 4070 Laptop GPU - 8 GB VRAM, Núcleo: 1695 MHz, Memoría: 1975 MHz, 110 W TDP, GDDR6, ForceWare 566.36, Optimus
Memoría
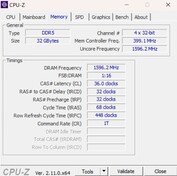
32 GB 
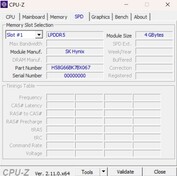
, LPDDR5X soldered (no expansion)
pantalla
16.00 pulgadas 16:10, 3200 x 2000 pixels 236 PPI, AU Optronics B160QAN04.S, IPS, Calman Verified, lustroso: no, 165 Hz, Adaptive Sync
Placa base
Intel Meteor Lake-U/P/H PCH
Disco duro
SK Hynix PC801 HFS001TEJ9X125N, 1024 GB 
, NVMe-SSD, two M.2 slots (one empty)
Tarjeta de sonido
Intel Meteor Lake-U/P/H PCH - cAVS (Audio, Voice, Speech)
Conexiones
3 USB 3.1 Gen2, 1 USB 4.0 40 Gbps, 1 Thunderbolt, USB-C Power Delivery (PD), 1 HDMI, 1 DisplayPort, Audio Conexiones: Combined (Line-In/Out), Card Reader: microSD, 1 Lector de Huellas Digitales
Equipamento de red
Intel Killer Wi-Fi 6E AX1675x (210NGW) (b/g/n = Wi-Fi 4/ac = Wi-Fi 5/ax = Wi-Fi 6/ Wi-Fi 6E 6 GHz), Bluetooth 5.3
Tamaño
Alto x ancho x profundidad (en mm): 21 x 356 x 249
Battería
76 Wh
Sistema Operativo
Microsoft Windows 11 Home
Camera
Webcam: 2 MP
Características adicionales
Altavoces: 2.0, Teclado: Chiclet RGB, Luz de Teclado: si, 230 W Power Supply, Predator Sense, 24 Meses Garantía
Peso
2.032 kg, Suministro de Electricidad: 795 g
Precio
1900 EUR
Note: The manufacturer may use components from different suppliers including display panels, drives or memory sticks with similar specifications.


Caso

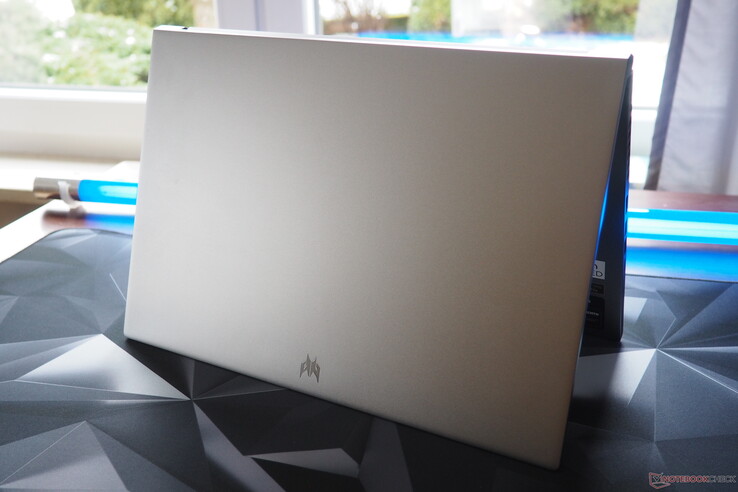
Uno de los aspectos más destacados del Predator Triton es su carcasa elegante y de aspecto agradable. Sus superficies metálicas dejan una impresión de alta calidad y apenas atraen las huellas dactilares gracias a su color claro. La estabilidad de la carcasa es igualmente buena, a excepción de algunos detalles (el touchpad cede bastante en algunos puntos). Acer también merece elogios por el buen funcionamiento de las bisagras del dispositivo, aunque su ángulo máximo de apertura de unos 135° podría ser un poco más amplio. Por otro lado, no tenemos nada que criticar sobre su calidad de construcción.

Acer Predator Triton Neo 16

Con su peso de alrededor de 2 kg, el dispositivo de 16 pulgadas se sitúa entre sus competidores, que pesan todos entre 1,8 y 2,5 kg. Su altura y dimensiones básicas son similares: aquí también, el portátil Acer se hace cómodo en el centro del campo.

Comparación de tamaños

363.9 mm 249.4 mm 23.5 mm 2.5 kg362.72 mm 253.69 mm 18.3 mm 2.1 kg356 mm 249 mm 21 mm 2 kg354.9 mm 246.9 mm 17.3 mm 1.8 kg354 mm 246 mm 16.4 mm 1.8 kg297 mm 210 mm 1 mm 5.7 g

Conectividad

Puertos

El Neo 16 ofrece una amplia gama de puertos. Mientras que el lado izquierdo alberga la conexión de alimentación, una toma de audio y dos puertos USB-C (1x USB 4 con DisplayPort 1.4 y PowerDelivery), el lado derecho está equipado con un lector de tarjetas micro SD, dos puertos USB-A (3.1 Gen 2), HDMI 2.1 y una abertura para candados Kensington. Aún así, Acer debería haber añadido un puerto RJ45 al dispositivo para asegurarle una muy buena calificación en conectividad.

Lado izquierdo: Alimentación, USB-C 4 (incl. DisplayPort 1.4 y PowerDelivery), USB-C 3.1 Gen 2, audio
Lado derecho: microSD, 2x USB-A 3.1 Gen 2, HDMI 2.1, bloqueo Kensington

Lector de tarjetas SD

El lector de tarjetas del portátil alcanzó velocidades mediocres de unos 90 MB/s durante nuestra prueba. El Alienware m16 y el Asus ProArt P16 lo hicieron mucho mejor en lo que respecta a la lectura secuencial.

SD Card Reader
average JPG Copy Test (av. of 3 runs)
Asus ProArt P16 H7606WI
AMD Ryzen AI 9 HX 370 (Angelbird AV Pro V60)
127 MB/s +46%
Average of class Gaming
  (19 - 202, n=87, last 2 years)
96 MB/s +10%
Acer Predator Triton Neo 16 PTN16-51-978P
Intel Core Ultra 9 185H (AV PRO microSD 128 GB V60)
87 MB/s
Asus ROG Zephyrus G16 2024 GU605M
Intel Core Ultra 7 155H
78.7 MB/s -10%
Lenovo Yoga Pro 9 16IMH9
Intel Core Ultra 9 185H (Angelbird AV Pro V60)
78.3 MB/s -10%
Alienware m16 R2
Intel Core Ultra 7 155H (AV PRO microSD 128 GB V60)
75.3 MB/s -13%
maximum AS SSD Seq Read Test (1GB)
Asus ProArt P16 H7606WI
AMD Ryzen AI 9 HX 370 (Angelbird AV Pro V60)
254.4 MB/s +183%
Alienware m16 R2
Intel Core Ultra 7 155H (AV PRO microSD 128 GB V60)
205.32 MB/s +128%
Average of class Gaming
  (25.8 - 269, n=87, last 2 years)
120.4 MB/s +34%
Acer Predator Triton Neo 16 PTN16-51-978P
Intel Core Ultra 9 185H (AV PRO microSD 128 GB V60)
90 MB/s
Asus ROG Zephyrus G16 2024 GU605M
Intel Core Ultra 7 155H
89.9 MB/s 0%
Lenovo Yoga Pro 9 16IMH9
Intel Core Ultra 9 185H (Angelbird AV Pro V60)
89.9 MB/s 0%

Comunicación

Su módulo inalámbrico responde al nombre de Killer Wi-Fi 6E AX1675x y tuvo un rendimiento de sólido (transmitiendo) a muy bueno (recibiendo) durante nuestra prueba de alcance a una distancia de 1 metro del enrutador de referencia.

Networking
iperf3 transmit AXE11000
Asus ProArt P16 H7606WI
Mediatek Wi-Fi 7 MT7925 Wireless LAN Card
1788 (1649min - 1890max) MBit/s +108%
Asus ROG Zephyrus G16 2024 GU605M
Intel Wi-Fi 6E AX211
1654 (1599min, 1600.16P1 - 1713max) MBit/s +93%
Lenovo Yoga Pro 9 16IMH9
Intel Wi-Fi 6E AX211
1650 (1445min - 1723max) MBit/s +92%
Average of class Gaming
  (469 - 1843, n=147, last 2 years)
1228 MBit/s +43%
Alienware m16 R2
Intel Wi-Fi 7 BE202
1205 (875min - 1438max) MBit/s +40%
Acer Predator Triton Neo 16 PTN16-51-978P
Intel Killer Wi-Fi 6E AX1675x (210NGW)
859 (707min - 1085max) MBit/s
Average Intel Killer Wi-Fi 6E AX1675x (210NGW)
  (703 - 859, n=5)
779 MBit/s -9%
iperf3 receive AXE11000
Acer Predator Triton Neo 16 PTN16-51-978P
Intel Killer Wi-Fi 6E AX1675x (210NGW)
1711 (1658min - 1732max) MBit/s
Asus ProArt P16 H7606WI
Mediatek Wi-Fi 7 MT7925 Wireless LAN Card
1699 (1607min - 1729max) MBit/s -1%
Lenovo Yoga Pro 9 16IMH9
Intel Wi-Fi 6E AX211
1654 (1568min - 1702max) MBit/s -3%
Asus ROG Zephyrus G16 2024 GU605M
Intel Wi-Fi 6E AX211
1600 (1564min, 1564.87P1 - 1627max) MBit/s -6%
Average of class Gaming
  (680 - 1890, n=147, last 2 years)
1397 MBit/s -18%
Alienware m16 R2
Intel Wi-Fi 7 BE202
1227 (1074min - 1317max) MBit/s -28%
Average Intel Killer Wi-Fi 6E AX1675x (210NGW)
  (774 - 1711, n=5)
1021 MBit/s -40%
050100150200250300350400450500550600650700750800850900950100010501100115012001250130013501400145015001550160016501700175018001850Tooltip
Acer Predator Triton Neo 16 PTN16-51-978P Intel Killer Wi-Fi 6E AX1675x (210NGW); iperf3 transmit AXE11000; iperf 3.1.3: Ø859 (707-1085)
Asus ProArt P16 H7606WI Mediatek Wi-Fi 7 MT7925 Wireless LAN Card; iperf3 transmit AXE11000; iperf 3.1.3: Ø1788 (1649-1890)
Lenovo Yoga Pro 9 16IMH9 Intel Wi-Fi 6E AX211; iperf3 transmit AXE11000; iperf 3.1.3: Ø1650 (1445-1723)
Asus ROG Zephyrus G16 2024 GU605M Intel Wi-Fi 6E AX211; iperf3 transmit AXE11000: Ø1654 (1599-1713)
Alienware m16 R2 Intel Wi-Fi 7 BE202; iperf3 transmit AXE11000; iperf 3.1.3: Ø1205 (875-1438)
Acer Predator Triton Neo 16 PTN16-51-978P Intel Killer Wi-Fi 6E AX1675x (210NGW); iperf3 receive AXE11000; iperf 3.1.3: Ø1711 (1658-1732)
Asus ProArt P16 H7606WI Mediatek Wi-Fi 7 MT7925 Wireless LAN Card; iperf3 receive AXE11000; iperf 3.1.3: Ø1698 (1607-1729)
Lenovo Yoga Pro 9 16IMH9 Intel Wi-Fi 6E AX211; iperf3 receive AXE11000; iperf 3.1.3: Ø1654 (1568-1702)
Asus ROG Zephyrus G16 2024 GU605M Intel Wi-Fi 6E AX211; iperf3 receive AXE11000: Ø1600 (1564-1627)
Alienware m16 R2 Intel Wi-Fi 7 BE202; iperf3 receive AXE11000; iperf 3.1.3: Ø1227 (1074-1317)

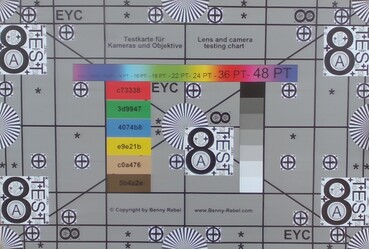
Cámara web

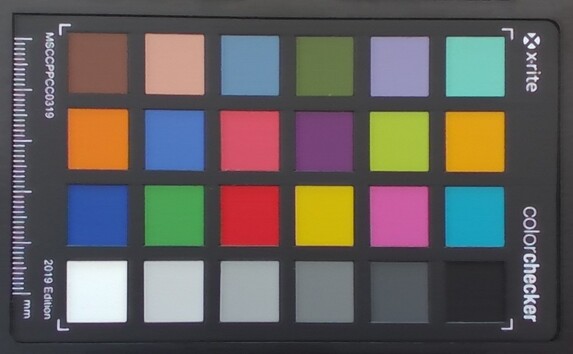
La webcam de 2MP del dispositivo es ligeramente más nítida y con mayor precisión de color que en la mayoría de portátiles para juegos, pero no puede esperar ningún milagro. No dispone de cubierta para mayor privacidad.
ColorChecker
4.8 ∆E
3.7 ∆E
8.2 ∆E
5.2 ∆E
6.9 ∆E
4.7 ∆E
2.4 ∆E
10.7 ∆E
4.2 ∆E
6.2 ∆E
2.6 ∆E
1.8 ∆E
8 ∆E
4.7 ∆E
6 ∆E
5.2 ∆E
4.1 ∆E
9.5 ∆E
4.8 ∆E
3.9 ∆E
5.4 ∆E
5 ∆E
4 ∆E
5.2 ∆E
ColorChecker Acer Predator Triton Neo 16 PTN16-51-978P: 5.29 ∆E min: 1.77 - max: 10.67 ∆E

Accesorios

El portátil Acer viene con una fuente de alimentación de 230 vatios y varios folletos informativos.

Mantenimiento

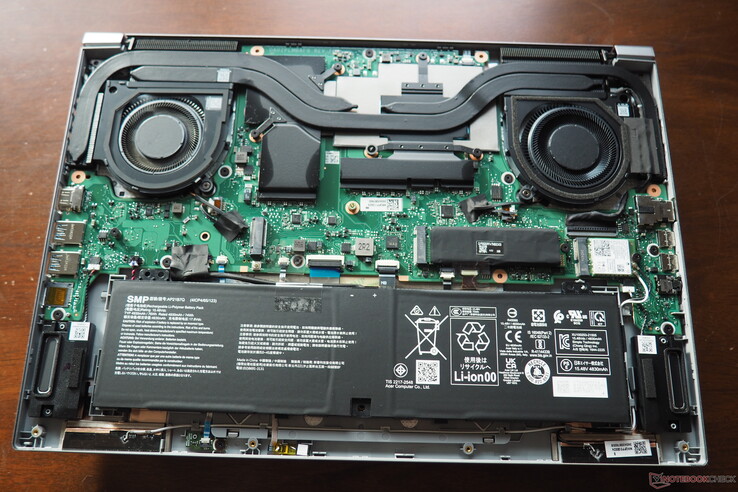
La placa base, bastante ajustada, se fija con 11 tornillos Torx. En el interior, el cuadro es bastante ordenado y sencillo. Aparte del módulo inalámbrico, sólo se pueden extraer la unidad SSD y la batería. El sistema de refrigeración del portátil (que, según Acer, utiliza metal líquido) consta de dos ventiladores y varios tubos de calor.

Acer Predator Triton Neo 16

Sostenibilidad

Acer hace referencia a "Post Consumer Recycled" en una de las pegatinas de la caja. El material de embalaje consiste principalmente en cartón. El portátil está embalado en una bolsa de tela y la fuente de alimentación en una película de plástico (cada tipo está etiquetado).

Garantía

El portátil está cubierto por una garantía estándar de 12 meses en Estados Unidos.

Dispositivos de entrada

Teclado

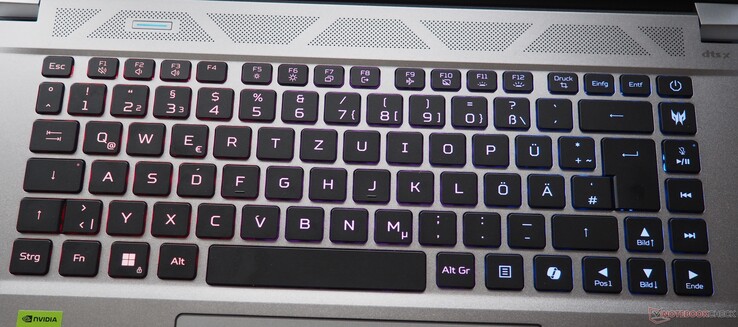
Para tratarse de un modelo con cúpula de goma, el teclado ofrece una respuesta y una sensación de escritura más que decentes. Acer ha optado por una disposición bastante clásica, en la que el fabricante se ha ahorrado un teclado numérico y se ha limitado a una sola columna a la derecha del "bloque principal", que está destinado al control multimedia y a abrir el software del sistema Predator Sense. A excepción de la fila de funciones, todas las teclas tienen un tamaño razonable, incluidas las flechas de dirección. Los jugadores pueden esperar una iluminación RGB ajustable en varios niveles dividida en tres zonas.

Acer Predator Triton Neo 16

Panel táctil

Con un tamaño de 15 x 9 cm, el touchpad del dispositivo tiene unas dimensiones muy generosas, pero en nuestra opinión podría haber sido un poco más estable, ya que los clics con el botón izquierdo, en particular, provocan cierto ceder perceptible. Describiríamos su superficie como agradable y suave. Tampoco tenemos nada que criticar sobre su soporte gestual y multitáctil.

Mostrar

A diferencia del Nitro V 16que tiene que conformarse con un espacio de color limitado y un brillo relativamente bajo, el Predator Triton Neo 16 presume de un panel IPS de alta calidad.
483
cd/m²
475
cd/m²
439
cd/m²
455
cd/m²
458
cd/m²
437
cd/m²
438
cd/m²
442
cd/m²
452
cd/m²
Temperatura del cuarto
AU Optronics B160QAN04.S tested with X-Rite i1Pro 2
Máximo: 483 cd/m² (Nits) Médio: 453.2 cd/m² Minimum: 20 cd/m²
iluminación: 90 %
Brillo con batería: 458 cd/m²
Contraste: 1090:1 (Negro: 0.42 cd/m²)
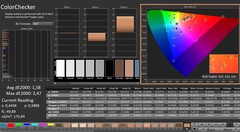
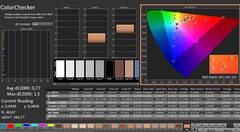
ΔE Color 1.58 | 0.5-29.43 Ø4.91, calibrated: 0.77
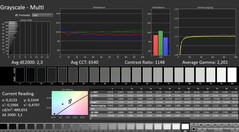
ΔE Greyscale 2.3 | 0.5-98 Ø5.2
85.3% AdobeRGB 1998 (Argyll 2.2.0 3D)
99.7% sRGB (Argyll 2.2.0 3D)
94.2% Display P3 (Argyll 2.2.0 3D)
Gamma: 2.201
Acer Predator Triton Neo 16 PTN16-51-978P
AU Optronics B160QAN04.S, IPS, 3200x2000, 16", 165 Hz
Asus ProArt P16 H7606WI
ATNA60YV02-0, OLED, 3840x2400, 16", 60 Hz
Lenovo Yoga Pro 9 16IMH9
LEN160-3.2K, Mini-LED, 3200x2000, 16", 165 Hz
Asus ROG Zephyrus G16 2024 GU605M
ATNA60DL01-0, OLED, 2560x1600, 16", 240 Hz
Alienware m16 R2
BOE NE16NYH, IPS, 2560x1600, 16", 240 Hz
Display
7%
2%
7%
-14%
Display P3 Coverage
94.2
99.9
6%
97
3%
99.9
6%
71
-25%
sRGB Coverage
99.7
100
0%
99.9
0%
100
0%
100
0%
AdobeRGB 1998 Coverage
85.3
99.1
16%
86.6
2%
96.9
14%
71.4
-16%
Response Times
83%
-137%
97%
2%
Response Time Grey 50% / Grey 80% *
12.3 ?(5.9, 6.4)
1.58 ?(0.84, 0.74)
87%
22.2 ?(9.6, 12.6)
-80%
0.22 ?(0.11, 0.11)
98%
5.7 ?(2.6, 3.1)
54%
Response Time Black / White *
5.8 ?(2.2, 3.6)
1.25 ?(0.67, 0.58)
78%
17 ?(8.2, 8.8)
-193%
0.25 ?(0.13, 0.12)
96%
8.7 ?(4.6, 4.1)
-50%
PWM Frequency
240 ?(52, 93)
4840 ?(100)
960 ?(60)
Screen
11%
29%
2%
-2%
Brightness middle
458
355
-22%
651
42%
416
-9%
345.8
-24%
Brightness
453
360
-21%
673
49%
418
-8%
337
-26%
Brightness Distribution
90
98
9%
93
3%
96
7%
87
-3%
Black Level *
0.42
0.22
48%
0.3
29%
Contrast
1090
2959
171%
1153
6%
Colorchecker dE 2000 *
1.58
1.2
24%
1.9
-20%
1.6
-1%
1.99
-26%
Colorchecker dE 2000 max. *
3.47
2.6
25%
4.2
-21%
2.1
39%
3.52
-1%
Colorchecker dE 2000 calibrated *
0.77
0.6
22%
0.62
19%
Greyscale dE 2000 *
2.3
1.2
48%
3
-30%
2.7
-17%
2.1
9%
Gamma
2.201 100%
2.14 103%
2.18 101%
2.16 102%
2.32 95%
CCT
6540 99%
6526 100%
6738 96%
6331 103%
6369 102%
Media total (Programa/Opciones)
34% / 23%
-35% / -0%
35% / 20%
-5% / -4%

* ... más pequeño es mejor

Su brillo medio de 453 cd/m² no sólo es suficiente para su uso en interiores, sino -dependiendo de las condiciones de iluminación- también para exteriores. Mientras tanto, su relación de contraste sólo es sólida con algo menos de 1.100:1, lo que se debe a su pobre nivel de negro (0,42 cd/m²). Aquí, los paneles OLED de algunos competidores muestran cómo se puede hacer mejor, y lo mismo puede decirse de sus tiempos de respuesta (aunque éstos son bastante buenos para un panel IPS).

CalMAN: Escala de grises
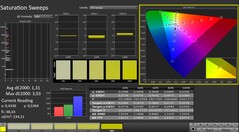
CalMAN: Saturación del color
CalMAN: ColorChecker
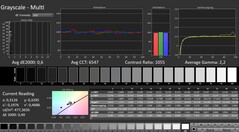
CalMAN: Escala de grises (calibrada)
CalMAN: Saturación de color (calibrada)
CalMAN: ColorChecker (calibrado)

Por otro lado, el portátil Acer presenta una superficie de baja reflexión y no experimenta ningún parpadeo en ningún nivel de brillo.

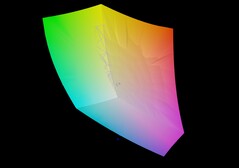
Acer Predator Triton Neo 16 vs sRGB
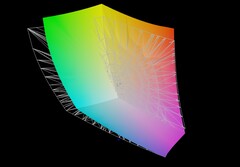
Acer Predator Triton Neo 16 vs AdobeRGB
Acer Predator Triton Neo 16 vs DCI-P3

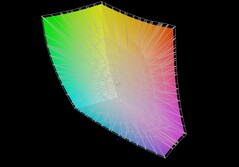
La Neo 16 pretende atraer a los usuarios profesionales con su amplio espacio de color: Una cobertura de casi el 100% de sRGB, el 94% de DCI-P3 y el 85% de AdobeRGB hacen de este retoño de 16 pulgadas un auténtico producto para creadores. Gracias a su verificación Calman, los colores ya parecen bastante naturales nada más sacarlo de la caja. El conjunto se redondea con unos ángulos de visión razonables.

Luz diurna
Luz diurna
Subpíxeles
Subpíxeles
Ángulos de visión
Ángulos de visión

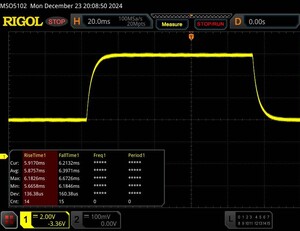
Tiempos de respuesta del display

Los tiempos de respuesta del display muestran lo rápido que puede cambiar la pantalla de un color al siguiente. Tiempos lentos de respuesta pueden llevar a imágenes persistentes alrededor de objetos en movimiento o a displays borrosos. Particularmente los aficionados a los juegos 3D frenéticos deberían usar una pantalla con tiempos de respuesta rápidos.
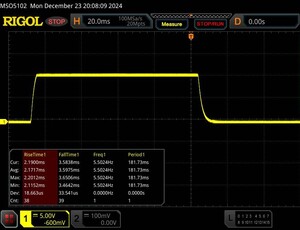
       Tiempo de respuesta de Negro a Blanco
5.8 ms ... subida ↗ y bajada ↘ combinada↗ 2.2 ms subida
↘ 3.6 ms bajada
La pantalla mostró tiempos de respuesta muy rápidos en nuestros tests y debería ser adecuada para juegos frenéticos.
En comparación, todos los dispositivos de prueba van de ##min### (mínimo) a 240 (máximo) ms. » 15 % de todos los dispositivos son mejores.
Esto quiere decir que el tiempo de respuesta medido es mejor que la media (20.9 ms) de todos los dispositivos testados.
       Tiempo de respuesta 50% Gris a 80% Gris
12.3 ms ... subida ↗ y bajada ↘ combinada↗ 5.9 ms subida
↘ 6.4 ms bajada
La pantalla mostró buenos tiempos de respuesta en nuestros tests pero podría ser demasiado lenta para los jugones competitivos.
En comparación, todos los dispositivos de prueba van de ##min### (mínimo) a 636 (máximo) ms. » 22 % de todos los dispositivos son mejores.
Esto quiere decir que el tiempo de respuesta medido es mejor que la media (32.8 ms) de todos los dispositivos testados.

Parpadeo de Pantalla / PWM (Pulse-Width Modulation)

Para atenuar el brillo de pantalla algunos portátiles están encendiendo y apagando la retroiluminación muy rápidamente. Esto se hace a una frecuencia que no debiera detectarse a simple vista. Si la frecuencia es demasiado lenta, la gente sensible podría experimentar problemas visuales, dolores de cabeza e incluso ver parpadeos.
Parpadeo de Pantalla / PWM no detectado

Comparación: 53 % de todos los dispositivos testados no usaron PWM para atenuar el display. Si se usó, medimos una media de 8702 (mínimo: 5 - máxmo: 343500) Hz.

100 % de luminosidad
75 % de luminosidad
75 % de luminosidad
50 % de luminosidad
50 % de luminosidad
25 % de luminosidad
25 % de luminosidad
0 % de luminosidad
0 % de luminosidad

Rendimiento

El rendimiento de nuestra versión de prueba PTN16-51-978P se sitúa en la gama media (alta). El Predator Triton Neo 16 comienza en poco menos de 1.200 dólares. El modelo básico viene con una pantalla WQXGA (2.560 x 1.600 píxeles, 240 Hz), un Core Ultra 7 155H, a GeForce RTX 4060, 16 GB de RAM y una unidad SSD de 1 TB.

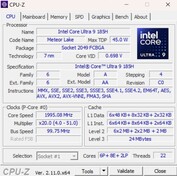
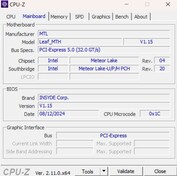
CPU-Z
CPU-Z
CPU-Z
CPU-Z
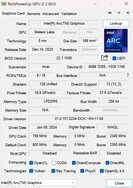
GPU-Z
GPU-Z
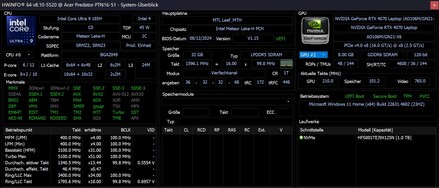
HWiNFO
 

Condiciones de prueba

Los usuarios pueden elegir entre cuatro perfiles diferentes, algunos de los cuales difieren significativamente en términos de rendimiento y desarrollo del ruido. Dado que el modo Turbo es muy ruidoso en modo 3D (casi 58 dB), optamos por el modo Rendimiento durante nuestras pruebas, que ofrece un rendimiento ligeramente inferior, pero también garantiza un ruido de funcionamiento significativamente menor (aunque aún elevado).

Sentido depredador
Sentido depredador
Sentido depredador
Sentido depredador
Sentido depredador
Sentido depredador
Sentido depredador
Sentido depredador
Sentido depredador
Sentido depredador
Cyberpunk 2077 Secuencia en bucle (FHD/Ultra) Silencioso Equilibrado Rendimiento Turbo
Ruido 39 dB(A) 47 dB(A) 50 dB(A) 58 dB(A)
Rendimiento 32 fps 62 fps 66 fps 74 fps
Consumo de energía de la placa GPU máx. 53 vatios máx. 66 vatios máx. 76 vatios máx. 116 vatios

Procesador

El Core Ultra 9 185H es un potente procesador para portátiles con 16 núcleos (tres tipos de núcleo diferentes), que puede procesar hasta 22 hilos simultáneamente mediante hyper-threading. En nuestro curso de pruebas comparativas, el rendimiento de la CPU se situó aproximadamente al nivel de nuestra media previamente determinada para el Ultra 9 185H. Sin embargo, el Ultra 7 155H, que se encuentra en algunos competidores, fue a menudo apenas más lento (el Alienware m16 incluso quedó ligeramente por delante en la clasificación general). El bucle Cinebench también mostró que los resultados del portátil Acer no eran especialmente constantes, sino que mostraban algunas fluctuaciones. Sin embargo, ninguno de los dos modelos de Intel tuvo ninguna oportunidad contra el AMD Ryzen AI 9 HX 370.

Cinebench R15 Multi continuous test

017535052570087510501225140015751750192521002275245026252800297531503325Tooltip
Acer Predator Triton Neo 16 PTN16-51-978P Intel Core Ultra 9 185H: Ø2755 (2385.5-2930.83)
Asus ProArt P16 H7606WI AMD Ryzen AI 9 HX 370: Ø3476 (3466.5-3497.73)
Lenovo Yoga Pro 9 16IMH9 Intel Core Ultra 9 185H: Ø2931 (2869.44-3004.58)
Asus ROG Zephyrus G16 2024 GU605M Intel Core Ultra 7 155H: Ø2533 (2383.65-2679.17)
Alienware m16 R2 Intel Core Ultra 7 155H: Ø2777 (2743.86-2839.9)
CPU Performance Rating - Percent
Asus ProArt P16 H7606WI
AMD Ryzen AI 9 HX 370
85.1 pt
Average of class Gaming
 
80.2 pt
Lenovo Yoga Pro 9 16IMH9
Intel Core Ultra 9 185H
77.2 pt
Alienware m16 R2 -1!
Intel Core Ultra 7 155H
73 pt
Acer Predator Triton Neo 16 PTN16-51-978P
Intel Core Ultra 9 185H
70.5 pt
Average Intel Core Ultra 9 185H
 
70.1 pt
Asus ROG Zephyrus G16 2024 GU605M
Intel Core Ultra 7 155H
68.7 pt
Cinebench R23
Multi Core
Asus ProArt P16 H7606WI
AMD Ryzen AI 9 HX 370
23750 Points +23%
Average of class Gaming
  (5668 - 36249, n=189, last 2 years)
22015 Points +14%
Lenovo Yoga Pro 9 16IMH9
Intel Core Ultra 9 185H
19851 Points +3%
Acer Predator Triton Neo 16 PTN16-51-978P
Intel Core Ultra 9 185H
19248 Points
Alienware m16 R2
Intel Core Ultra 7 155H
18419 (18019.3min - 18419.5max) Points -4%
Average Intel Core Ultra 9 185H
  (12688 - 19851, n=19)
17767 Points -8%
Asus ROG Zephyrus G16 2024 GU605M
Intel Core Ultra 7 155H
17267 Points -10%
Single Core
Asus ProArt P16 H7606WI
AMD Ryzen AI 9 HX 370
2044 Points +17%
Lenovo Yoga Pro 9 16IMH9
Intel Core Ultra 9 185H
1906 Points +9%
Average of class Gaming
  (1136 - 2235, n=188, last 2 years)
1894 Points +8%
Average Intel Core Ultra 9 185H
  (1166 - 1912, n=19)
1787 Points +2%
Acer Predator Triton Neo 16 PTN16-51-978P
Intel Core Ultra 9 185H
1754 Points
Alienware m16 R2
Intel Core Ultra 7 155H
1749 Points 0%
Asus ROG Zephyrus G16 2024 GU605M
Intel Core Ultra 7 155H
1681 Points -4%
Cinebench R20
CPU (Multi Core)
Asus ProArt P16 H7606WI
AMD Ryzen AI 9 HX 370
9246 Points +23%
Average of class Gaming
  (2179 - 13832, n=186, last 2 years)
8361 Points +11%
Lenovo Yoga Pro 9 16IMH9
Intel Core Ultra 9 185H
7651 Points +1%
Acer Predator Triton Neo 16 PTN16-51-978P
Intel Core Ultra 9 185H
7546 Points
Alienware m16 R2
Intel Core Ultra 7 155H
7050 Points -7%
Average Intel Core Ultra 9 185H
  (4843 - 7651, n=19)
6862 Points -9%
Asus ROG Zephyrus G16 2024 GU605M
Intel Core Ultra 7 155H
6682 Points -11%
CPU (Single Core)
Asus ProArt P16 H7606WI
AMD Ryzen AI 9 HX 370
804 Points +21%
Lenovo Yoga Pro 9 16IMH9
Intel Core Ultra 9 185H
735 Points +10%
Average of class Gaming
  (439 - 856, n=186, last 2 years)
727 Points +9%
Asus ROG Zephyrus G16 2024 GU605M
Intel Core Ultra 7 155H
693 Points +4%
Average Intel Core Ultra 9 185H
  (442 - 735, n=19)
689 Points +3%
Alienware m16 R2
Intel Core Ultra 7 155H
674 Points +1%
Acer Predator Triton Neo 16 PTN16-51-978P
Intel Core Ultra 9 185H
666 Points
Cinebench R15
CPU Multi 64Bit
Asus ProArt P16 H7606WI
AMD Ryzen AI 9 HX 370
3498 (3466.5min - 3497.73max) Points +19%
Average of class Gaming
  (905 - 5663, n=193, last 2 years)
3441 Points +17%
Lenovo Yoga Pro 9 16IMH9
Intel Core Ultra 9 185H
3005 (2869.44min - 3004.58max) Points +3%
Acer Predator Triton Neo 16 PTN16-51-978P
Intel Core Ultra 9 185H
2931 (2385.5min - 2930.83max) Points
Alienware m16 R2
Intel Core Ultra 7 155H
2840 (2743.86min - 2839.9max) Points -3%
Average Intel Core Ultra 9 185H
  (1582 - 3165, n=21)
2729 Points -7%
Asus ROG Zephyrus G16 2024 GU605M
Intel Core Ultra 7 155H
2679 (2383.65min - 2679.17max) Points -9%
CPU Single 64Bit
Asus ProArt P16 H7606WI
AMD Ryzen AI 9 HX 370
310 Points +12%
Lenovo Yoga Pro 9 16IMH9
Intel Core Ultra 9 185H
280 Points +1%
Average of class Gaming
  (191.9 - 318, n=190, last 2 years)
278 Points +1%
Acer Predator Triton Neo 16 PTN16-51-978P
Intel Core Ultra 9 185H
276 Points
Asus ROG Zephyrus G16 2024 GU605M
Intel Core Ultra 7 155H
264 Points -4%
Average Intel Core Ultra 9 185H
  (191.9 - 281, n=19)
264 Points -4%
Alienware m16 R2
Intel Core Ultra 7 155H
256 Points -7%
Blender - v2.79 BMW27 CPU
Asus ROG Zephyrus G16 2024 GU605M
Intel Core Ultra 7 155H
193 Seconds * -9%
Average Intel Core Ultra 9 185H
  (163 - 285, n=19)
191.1 Seconds * -8%
Acer Predator Triton Neo 16 PTN16-51-978P
Intel Core Ultra 9 185H
177 Seconds *
Average of class Gaming
  (87 - 555, n=181, last 2 years)
169.1 Seconds * +4%
Lenovo Yoga Pro 9 16IMH9
Intel Core Ultra 9 185H
163 Seconds * +8%
Asus ProArt P16 H7606WI
AMD Ryzen AI 9 HX 370
140 Seconds * +21%
7-Zip 18.03
7z b 4
Average of class Gaming
  (23795 - 140932, n=185, last 2 years)
85859 MIPS +17%
Asus ProArt P16 H7606WI
AMD Ryzen AI 9 HX 370
83354 MIPS +14%
Lenovo Yoga Pro 9 16IMH9
Intel Core Ultra 9 185H
76331 MIPS +4%
Acer Predator Triton Neo 16 PTN16-51-978P
Intel Core Ultra 9 185H
73378 MIPS
Average Intel Core Ultra 9 185H
  (51738 - 76331, n=19)
69330 MIPS -6%
Asus ROG Zephyrus G16 2024 GU605M
Intel Core Ultra 7 155H
68500 MIPS -7%
Alienware m16 R2
Intel Core Ultra 7 155H
67581 MIPS -8%
7z b 4 -mmt1
Average of class Gaming
  (4199 - 7581, n=185, last 2 years)
6320 MIPS +13%
Asus ProArt P16 H7606WI
AMD Ryzen AI 9 HX 370
6179 MIPS +10%
Lenovo Yoga Pro 9 16IMH9
Intel Core Ultra 9 185H
5781 MIPS +3%
Acer Predator Triton Neo 16 PTN16-51-978P
Intel Core Ultra 9 185H
5594 MIPS
Asus ROG Zephyrus G16 2024 GU605M
Intel Core Ultra 7 155H
5439 MIPS -3%
Average Intel Core Ultra 9 185H
  (4199 - 5781, n=19)
5427 MIPS -3%
Alienware m16 R2
Intel Core Ultra 7 155H
5037 MIPS -10%
Geekbench 6.3
Multi-Core
Asus ProArt P16 H7606WI
AMD Ryzen AI 9 HX 370
15367 Points +10%
Average of class Gaming
  (5340 - 19665, n=113, last 2 years)
14205 Points +1%
Lenovo Yoga Pro 9 16IMH9
Intel Core Ultra 9 185H
14031 Points 0%
Acer Predator Triton Neo 16 PTN16-51-978P
Intel Core Ultra 9 185H
14001 Points
Average Intel Core Ultra 9 185H
  (9140 - 14540, n=19)
13602 Points -3%
Asus ROG Zephyrus G16 2024 GU605M
Intel Core Ultra 7 155H
13323 Points -5%
Alienware m16 R2
Intel Core Ultra 7 155H
12670 Points -10%
Single-Core
Asus ProArt P16 H7606WI
AMD Ryzen AI 9 HX 370
2877 Points +20%
Average of class Gaming
  (1490 - 3129, n=113, last 2 years)
2649 Points +10%
Lenovo Yoga Pro 9 16IMH9
Intel Core Ultra 9 185H
2570 Points +7%
Average Intel Core Ultra 9 185H
  (1490 - 2573, n=19)
2430 Points +1%
Asus ROG Zephyrus G16 2024 GU605M
Intel Core Ultra 7 155H
2410 Points 0%
Acer Predator Triton Neo 16 PTN16-51-978P
Intel Core Ultra 9 185H
2399 Points
Alienware m16 R2
Intel Core Ultra 7 155H
2383 Points -1%
Geekbench 5.5
Multi-Core
Average of class Gaming
  (4557 - 23194, n=186, last 2 years)
15118 Points +7%
Asus ProArt P16 H7606WI
AMD Ryzen AI 9 HX 370
15012 Points +7%
Acer Predator Triton Neo 16 PTN16-51-978P
Intel Core Ultra 9 185H
14072 Points
Lenovo Yoga Pro 9 16IMH9
Intel Core Ultra 9 185H
13936 Points -1%
Average Intel Core Ultra 9 185H
  (9330 - 14230, n=19)
13179 Points -6%
Asus ROG Zephyrus G16 2024 GU605M
Intel Core Ultra 7 155H
12905 Points -8%
Alienware m16 R2
Intel Core Ultra 7 155H
12328 Points -12%
Single-Core
Asus ProArt P16 H7606WI
AMD Ryzen AI 9 HX 370
2066 Points +20%
Lenovo Yoga Pro 9 16IMH9
Intel Core Ultra 9 185H
1902 Points +10%
Average of class Gaming
  (986 - 2210, n=186, last 2 years)
1898 Points +10%
Average Intel Core Ultra 9 185H
  (986 - 1902, n=19)
1779 Points +3%
Asus ROG Zephyrus G16 2024 GU605M
Intel Core Ultra 7 155H
1755 Points +2%
Alienware m16 R2
Intel Core Ultra 7 155H
1741 Points +1%
Acer Predator Triton Neo 16 PTN16-51-978P
Intel Core Ultra 9 185H
1726 Points
HWBOT x265 Benchmark v2.2 - 4k Preset
Asus ProArt P16 H7606WI
AMD Ryzen AI 9 HX 370
24.6 fps +21%
Average of class Gaming
  (6.72 - 38.9, n=185, last 2 years)
23.6 fps +16%
Lenovo Yoga Pro 9 16IMH9
Intel Core Ultra 9 185H
22.7 fps +12%
Alienware m16 R2
Intel Core Ultra 7 155H
21.2 fps +4%
Acer Predator Triton Neo 16 PTN16-51-978P
Intel Core Ultra 9 185H
20.3 fps
Asus ROG Zephyrus G16 2024 GU605M
Intel Core Ultra 7 155H
19.9 fps -2%
Average Intel Core Ultra 9 185H
  (14.1 - 22.7, n=19)
19.9 fps -2%
LibreOffice - 20 Documents To PDF
Acer Predator Triton Neo 16 PTN16-51-978P
Intel Core Ultra 9 185H
73.5 s *
Asus ProArt P16 H7606WI
AMD Ryzen AI 9 HX 370
56.1 s * +24%
Alienware m16 R2
Intel Core Ultra 7 155H
49.8 s * +32%
Asus ROG Zephyrus G16 2024 GU605M
Intel Core Ultra 7 155H
49.6 s * +33%
Average of class Gaming
  (31.4 - 199, n=182, last 2 years)
48.2 s * +34%
Average Intel Core Ultra 9 185H
  (34.5 - 73.5, n=19)
46.1 s * +37%
Lenovo Yoga Pro 9 16IMH9
Intel Core Ultra 9 185H
39.7 s * +46%
R Benchmark 2.5 - Overall mean
Alienware m16 R2
Intel Core Ultra 7 155H
0.487 sec * -9%
Average Intel Core Ultra 9 185H
  (0.4313 - 0.759, n=20)
0.47 sec * -5%
Asus ROG Zephyrus G16 2024 GU605M
Intel Core Ultra 7 155H
0.4654 sec * -4%
Acer Predator Triton Neo 16 PTN16-51-978P
Intel Core Ultra 9 185H
0.4486 sec *
Lenovo Yoga Pro 9 16IMH9
Intel Core Ultra 9 185H
0.4457 sec * +1%
Average of class Gaming
  (0.3609 - 0.759, n=186, last 2 years)
0.4364 sec * +3%
Asus ProArt P16 H7606WI
AMD Ryzen AI 9 HX 370
0.4041 sec * +10%

* ... más pequeño es mejor

Cinebench R15 CPU Multi 64Bit
2931 Points
Cinebench R15 OpenGL 64Bit
177.2 fps
Cinebench R15 Ref. Match 64Bit
99.6 %
Cinebench R15 CPU Single 64Bit
276 Points
Cinebench R20 CPU (Single Core)
666 Points
Cinebench R20 CPU (Multi Core)
7546 Points
Cinebench R23 Multi Core
19248 Points
Cinebench R23 Single Core
1754 Points
Cinebench 2024 CPU Single Core
111 Points
Cinebench 2024 CPU Multi Core
1027 Points
ayuda
Performance Rating
Asus ProArt P16 H7606WI -2!
AMD Ryzen AI 9 HX 370, NVIDIA GeForce RTX 4070 Laptop GPU
93.1 pt
Average of class Gaming
 
85 pt
Lenovo Yoga Pro 9 16IMH9
Intel Core Ultra 9 185H, NVIDIA GeForce RTX 4070 Laptop GPU
76.9 pt
Acer Predator Triton Neo 16 PTN16-51-978P
Intel Core Ultra 9 185H, NVIDIA GeForce RTX 4070 Laptop GPU
74.7 pt
Alienware m16 R2
Intel Core Ultra 7 155H, NVIDIA GeForce RTX 4070 Laptop GPU
71.3 pt
Average Intel Core Ultra 9 185H
 
70.2 pt
Asus ROG Zephyrus G16 2024 GU605M
Intel Core Ultra 7 155H, NVIDIA GeForce RTX 4070 Laptop GPU
68.8 pt
AIDA64 / FP32 Ray-Trace
Average of class Gaming
  (4986 - 60169, n=182, last 2 years)
21996 KRay/s +18%
Acer Predator Triton Neo 16 PTN16-51-978P
Intel Core Ultra 9 185H, NVIDIA GeForce RTX 4070 Laptop GPU
18621 KRay/s
Alienware m16 R2
Intel Core Ultra 7 155H, NVIDIA GeForce RTX 4070 Laptop GPU
18470 KRay/s -1%
Lenovo Yoga Pro 9 16IMH9
Intel Core Ultra 9 185H, NVIDIA GeForce RTX 4070 Laptop GPU
18446 KRay/s -1%
Asus ROG Zephyrus G16 2024 GU605M
Intel Core Ultra 7 155H, NVIDIA GeForce RTX 4070 Laptop GPU
16431 KRay/s -12%
Average Intel Core Ultra 9 185H
  (9220 - 18676, n=19)
16396 KRay/s -12%
AIDA64 / FPU Julia
Asus ProArt P16 H7606WI
AMD Ryzen AI 9 HX 370, NVIDIA GeForce RTX 4070 Laptop GPU
147248 Points +54%
Average of class Gaming
  (25360 - 252486, n=182, last 2 years)
107132 Points +12%
Acer Predator Triton Neo 16 PTN16-51-978P
Intel Core Ultra 9 185H, NVIDIA GeForce RTX 4070 Laptop GPU
95572 Points
Lenovo Yoga Pro 9 16IMH9
Intel Core Ultra 9 185H, NVIDIA GeForce RTX 4070 Laptop GPU
95213 Points 0%
Alienware m16 R2
Intel Core Ultra 7 155H, NVIDIA GeForce RTX 4070 Laptop GPU
92996 Points -3%
Asus ROG Zephyrus G16 2024 GU605M
Intel Core Ultra 7 155H, NVIDIA GeForce RTX 4070 Laptop GPU
85461 Points -11%
Average Intel Core Ultra 9 185H
  (48865 - 96463, n=19)
85141 Points -11%
AIDA64 / CPU SHA3
Asus ProArt P16 H7606WI
AMD Ryzen AI 9 HX 370, NVIDIA GeForce RTX 4070 Laptop GPU
5843 MB/s +36%
Average of class Gaming
  (1339 - 10389, n=182, last 2 years)
4927 MB/s +15%
Acer Predator Triton Neo 16 PTN16-51-978P
Intel Core Ultra 9 185H, NVIDIA GeForce RTX 4070 Laptop GPU
4296 MB/s
Lenovo Yoga Pro 9 16IMH9
Intel Core Ultra 9 185H, NVIDIA GeForce RTX 4070 Laptop GPU
4278 MB/s 0%
Alienware m16 R2
Intel Core Ultra 7 155H, NVIDIA GeForce RTX 4070 Laptop GPU
4242 MB/s -1%
Average Intel Core Ultra 9 185H
  (2394 - 4534, n=19)
3982 MB/s -7%
Asus ROG Zephyrus G16 2024 GU605M
Intel Core Ultra 7 155H, NVIDIA GeForce RTX 4070 Laptop GPU
3814 MB/s -11%
AIDA64 / CPU Queen
Average of class Gaming
  (50699 - 200651, n=182, last 2 years)
117304 Points +24%
Asus ProArt P16 H7606WI
AMD Ryzen AI 9 HX 370, NVIDIA GeForce RTX 4070 Laptop GPU
94661 Points 0%
Acer Predator Triton Neo 16 PTN16-51-978P
Intel Core Ultra 9 185H, NVIDIA GeForce RTX 4070 Laptop GPU
94527 Points
Lenovo Yoga Pro 9 16IMH9
Intel Core Ultra 9 185H, NVIDIA GeForce RTX 4070 Laptop GPU
94395 Points 0%
Asus ROG Zephyrus G16 2024 GU605M
Intel Core Ultra 7 155H, NVIDIA GeForce RTX 4070 Laptop GPU
90347 Points -4%
Average Intel Core Ultra 9 185H
  (66785 - 95241, n=19)
89708 Points -5%
Alienware m16 R2
Intel Core Ultra 7 155H, NVIDIA GeForce RTX 4070 Laptop GPU
84180 Points -11%
AIDA64 / FPU SinJulia
Asus ProArt P16 H7606WI
AMD Ryzen AI 9 HX 370, NVIDIA GeForce RTX 4070 Laptop GPU
19021 Points +68%
Average of class Gaming
  (4800 - 32988, n=182, last 2 years)
13306 Points +18%
Lenovo Yoga Pro 9 16IMH9
Intel Core Ultra 9 185H, NVIDIA GeForce RTX 4070 Laptop GPU
11392 Points +1%
Acer Predator Triton Neo 16 PTN16-51-978P
Intel Core Ultra 9 185H, NVIDIA GeForce RTX 4070 Laptop GPU
11312 Points
Asus ROG Zephyrus G16 2024 GU605M
Intel Core Ultra 7 155H, NVIDIA GeForce RTX 4070 Laptop GPU
10641 Points -6%
Alienware m16 R2
Intel Core Ultra 7 155H, NVIDIA GeForce RTX 4070 Laptop GPU
10617 Points -6%
Average Intel Core Ultra 9 185H
  (7255 - 11392, n=19)
10546 Points -7%
AIDA64 / FPU Mandel
Average of class Gaming
  (12321 - 134044, n=182, last 2 years)
53901 Points +16%
Alienware m16 R2
Intel Core Ultra 7 155H, NVIDIA GeForce RTX 4070 Laptop GPU
47685 Points +3%
Lenovo Yoga Pro 9 16IMH9
Intel Core Ultra 9 185H, NVIDIA GeForce RTX 4070 Laptop GPU
47315 Points +2%
Acer Predator Triton Neo 16 PTN16-51-978P
Intel Core Ultra 9 185H, NVIDIA GeForce RTX 4070 Laptop GPU
46435 Points
Asus ROG Zephyrus G16 2024 GU605M
Intel Core Ultra 7 155H, NVIDIA GeForce RTX 4070 Laptop GPU
41806 Points -10%
Average Intel Core Ultra 9 185H
  (24004 - 48020, n=19)
41756 Points -10%
AIDA64 / CPU AES
Average of class Gaming
  (19065 - 328679, n=182, last 2 years)
109375 MB/s +20%
Lenovo Yoga Pro 9 16IMH9
Intel Core Ultra 9 185H, NVIDIA GeForce RTX 4070 Laptop GPU
94250 MB/s +4%
Average Intel Core Ultra 9 185H
  (53116 - 154066, n=19)
91381 MB/s +1%
Acer Predator Triton Neo 16 PTN16-51-978P
Intel Core Ultra 9 185H, NVIDIA GeForce RTX 4070 Laptop GPU
90860 MB/s
Alienware m16 R2
Intel Core Ultra 7 155H, NVIDIA GeForce RTX 4070 Laptop GPU
82757 MB/s -9%
Asus ProArt P16 H7606WI
AMD Ryzen AI 9 HX 370, NVIDIA GeForce RTX 4070 Laptop GPU
81929 MB/s -10%
Asus ROG Zephyrus G16 2024 GU605M
Intel Core Ultra 7 155H, NVIDIA GeForce RTX 4070 Laptop GPU
79475 MB/s -13%
AIDA64 / CPU ZLib
Asus ProArt P16 H7606WI
AMD Ryzen AI 9 HX 370, NVIDIA GeForce RTX 4070 Laptop GPU
1520 MB/s +17%
Average of class Gaming
  (373 - 2409, n=182, last 2 years)
1372 MB/s +6%
Lenovo Yoga Pro 9 16IMH9
Intel Core Ultra 9 185H, NVIDIA GeForce RTX 4070 Laptop GPU
1297 MB/s 0%
Acer Predator Triton Neo 16 PTN16-51-978P
Intel Core Ultra 9 185H, NVIDIA GeForce RTX 4070 Laptop GPU
1295 MB/s
Alienware m16 R2
Intel Core Ultra 7 155H, NVIDIA GeForce RTX 4070 Laptop GPU
1219 MB/s -6%
Average Intel Core Ultra 9 185H
  (678 - 1341, n=19)
1163 MB/s -10%
Asus ROG Zephyrus G16 2024 GU605M
Intel Core Ultra 7 155H, NVIDIA GeForce RTX 4070 Laptop GPU
1128 MB/s -13%
AIDA64 / FP64 Ray-Trace
Asus ProArt P16 H7606WI
AMD Ryzen AI 9 HX 370, NVIDIA GeForce RTX 4070 Laptop GPU
20608 KRay/s +114%
Average of class Gaming
  (2540 - 31796, n=182, last 2 years)
11845 KRay/s +23%
Alienware m16 R2
Intel Core Ultra 7 155H, NVIDIA GeForce RTX 4070 Laptop GPU
9802 KRay/s +2%
Lenovo Yoga Pro 9 16IMH9
Intel Core Ultra 9 185H, NVIDIA GeForce RTX 4070 Laptop GPU
9768 KRay/s +1%
Acer Predator Triton Neo 16 PTN16-51-978P
Intel Core Ultra 9 185H, NVIDIA GeForce RTX 4070 Laptop GPU
9631 KRay/s
Average Intel Core Ultra 9 185H
  (4428 - 10078, n=19)
8582 KRay/s -11%
Asus ROG Zephyrus G16 2024 GU605M
Intel Core Ultra 7 155H, NVIDIA GeForce RTX 4070 Laptop GPU
8449 KRay/s -12%
AIDA64 / CPU PhotoWorxx
Lenovo Yoga Pro 9 16IMH9
Intel Core Ultra 9 185H, NVIDIA GeForce RTX 4070 Laptop GPU
53918 MPixel/s +21%
Asus ROG Zephyrus G16 2024 GU605M
Intel Core Ultra 7 155H, NVIDIA GeForce RTX 4070 Laptop GPU
49238 MPixel/s +11%
Average Intel Core Ultra 9 185H
  (44547 - 53918, n=19)
48798 MPixel/s +10%
Asus ProArt P16 H7606WI
AMD Ryzen AI 9 HX 370, NVIDIA GeForce RTX 4070 Laptop GPU
48273 MPixel/s +8%
Acer Predator Triton Neo 16 PTN16-51-978P
Intel Core Ultra 9 185H, NVIDIA GeForce RTX 4070 Laptop GPU
44547 MPixel/s
Average of class Gaming
  (10805 - 60161, n=183, last 2 years)
40439 MPixel/s -9%
Alienware m16 R2
Intel Core Ultra 7 155H, NVIDIA GeForce RTX 4070 Laptop GPU
39532 MPixel/s -11%

Rendimiento del sistema

No hubo sorpresas en lo que respecta al rendimiento del sistema. 7.443 puntos en PCMark 10 son típicos para un dispositivo con estos componentes o de esta clase de rendimiento.

PCMark 10 / Score
Average of class Gaming
  (5776 - 9852, n=163, last 2 years)
7817 Points +5%
Alienware m16 R2
NVIDIA GeForce RTX 4070 Laptop GPU, Ultra 7 155H, Samsung PM9A1 MZVL21T0HCLR
7761 Points +4%
Asus ProArt P16 H7606WI
NVIDIA GeForce RTX 4070 Laptop GPU, Ryzen AI 9 HX 370, Micron 2400 MTFDKBA1T0QFM
7752 Points +4%
Average Intel Core Ultra 9 185H, NVIDIA GeForce RTX 4070 Laptop GPU
  (7443 - 7761, n=4)
7560 Points +2%
Lenovo Yoga Pro 9 16IMH9
NVIDIA GeForce RTX 4070 Laptop GPU, Ultra 9 185H, SK Hynix HFS001TEJ9X115N
7547 Points +1%
Acer Predator Triton Neo 16 PTN16-51-978P
NVIDIA GeForce RTX 4070 Laptop GPU, Ultra 9 185H, SK Hynix PC801 HFS001TEJ9X125N
7443 Points
Asus ROG Zephyrus G16 2024 GU605M
NVIDIA GeForce RTX 4070 Laptop GPU, Ultra 7 155H, WD PC SN560 SDDPNQE-1T00
7123 Points -4%
PCMark 10 / Essentials
Lenovo Yoga Pro 9 16IMH9
NVIDIA GeForce RTX 4070 Laptop GPU, Ultra 9 185H, SK Hynix HFS001TEJ9X115N
11133 Points +14%
Average of class Gaming
  (9057 - 12334, n=162, last 2 years)
10832 Points +11%
Average Intel Core Ultra 9 185H, NVIDIA GeForce RTX 4070 Laptop GPU
  (9728 - 11133, n=4)
10451 Points +7%
Alienware m16 R2
NVIDIA GeForce RTX 4070 Laptop GPU, Ultra 7 155H, Samsung PM9A1 MZVL21T0HCLR
10330 Points +6%
Asus ROG Zephyrus G16 2024 GU605M
NVIDIA GeForce RTX 4070 Laptop GPU, Ultra 7 155H, WD PC SN560 SDDPNQE-1T00
10038 Points +3%
Asus ProArt P16 H7606WI
NVIDIA GeForce RTX 4070 Laptop GPU, Ryzen AI 9 HX 370, Micron 2400 MTFDKBA1T0QFM
10009 Points +3%
Acer Predator Triton Neo 16 PTN16-51-978P
NVIDIA GeForce RTX 4070 Laptop GPU, Ultra 9 185H, SK Hynix PC801 HFS001TEJ9X125N
9728 Points
PCMark 10 / Productivity
Average of class Gaming
  (6662 - 14612, n=162, last 2 years)
9912 Points +4%
Asus ProArt P16 H7606WI
NVIDIA GeForce RTX 4070 Laptop GPU, Ryzen AI 9 HX 370, Micron 2400 MTFDKBA1T0QFM
9891 Points +4%
Acer Predator Triton Neo 16 PTN16-51-978P
NVIDIA GeForce RTX 4070 Laptop GPU, Ultra 9 185H, SK Hynix PC801 HFS001TEJ9X125N
9555 Points
Alienware m16 R2
NVIDIA GeForce RTX 4070 Laptop GPU, Ultra 7 155H, Samsung PM9A1 MZVL21T0HCLR
9422 Points -1%
Average Intel Core Ultra 9 185H, NVIDIA GeForce RTX 4070 Laptop GPU
  (9067 - 9555, n=4)
9347 Points -2%
Asus ROG Zephyrus G16 2024 GU605M
NVIDIA GeForce RTX 4070 Laptop GPU, Ultra 7 155H, WD PC SN560 SDDPNQE-1T00
9208 Points -4%
Lenovo Yoga Pro 9 16IMH9
NVIDIA GeForce RTX 4070 Laptop GPU, Ultra 9 185H, SK Hynix HFS001TEJ9X115N
9067 Points -5%
PCMark 10 / Digital Content Creation
Alienware m16 R2
NVIDIA GeForce RTX 4070 Laptop GPU, Ultra 7 155H, Samsung PM9A1 MZVL21T0HCLR
13035 Points +8%
Asus ProArt P16 H7606WI
NVIDIA GeForce RTX 4070 Laptop GPU, Ryzen AI 9 HX 370, Micron 2400 MTFDKBA1T0QFM
12771 Points +6%
Average of class Gaming
  (6807 - 18475, n=162, last 2 years)
12183 Points +1%
Average Intel Core Ultra 9 185H, NVIDIA GeForce RTX 4070 Laptop GPU
  (11369 - 13194, n=4)
12039 Points 0%
Acer Predator Triton Neo 16 PTN16-51-978P
NVIDIA GeForce RTX 4070 Laptop GPU, Ultra 9 185H, SK Hynix PC801 HFS001TEJ9X125N
12037 Points
Lenovo Yoga Pro 9 16IMH9
NVIDIA GeForce RTX 4070 Laptop GPU, Ultra 9 185H, SK Hynix HFS001TEJ9X115N
11554 Points -4%
Asus ROG Zephyrus G16 2024 GU605M
NVIDIA GeForce RTX 4070 Laptop GPU, Ultra 7 155H, WD PC SN560 SDDPNQE-1T00
10612 Points -12%
CrossMark / Overall
Average of class Gaming
  (1247 - 2344, n=143, last 2 years)
1912 Points
Asus ProArt P16 H7606WI
NVIDIA GeForce RTX 4070 Laptop GPU, Ryzen AI 9 HX 370, Micron 2400 MTFDKBA1T0QFM
1794 Points
Average Intel Core Ultra 9 185H, NVIDIA GeForce RTX 4070 Laptop GPU
  (1663 - 1917, n=3)
1766 Points
Alienware m16 R2
NVIDIA GeForce RTX 4070 Laptop GPU, Ultra 7 155H, Samsung PM9A1 MZVL21T0HCLR
1762 Points
Asus ROG Zephyrus G16 2024 GU605M
NVIDIA GeForce RTX 4070 Laptop GPU, Ultra 7 155H, WD PC SN560 SDDPNQE-1T00
1721 Points
Lenovo Yoga Pro 9 16IMH9
NVIDIA GeForce RTX 4070 Laptop GPU, Ultra 9 185H, SK Hynix HFS001TEJ9X115N
1719 Points
CrossMark / Productivity
Average of class Gaming
  (1299 - 2204, n=143, last 2 years)
1811 Points
Alienware m16 R2
NVIDIA GeForce RTX 4070 Laptop GPU, Ultra 7 155H, Samsung PM9A1 MZVL21T0HCLR
1684 Points
Average Intel Core Ultra 9 185H, NVIDIA GeForce RTX 4070 Laptop GPU
  (1573 - 1849, n=3)
1678 Points
Asus ROG Zephyrus G16 2024 GU605M
NVIDIA GeForce RTX 4070 Laptop GPU, Ultra 7 155H, WD PC SN560 SDDPNQE-1T00
1624 Points
Lenovo Yoga Pro 9 16IMH9
NVIDIA GeForce RTX 4070 Laptop GPU, Ultra 9 185H, SK Hynix HFS001TEJ9X115N
1611 Points
Asus ProArt P16 H7606WI
NVIDIA GeForce RTX 4070 Laptop GPU, Ryzen AI 9 HX 370, Micron 2400 MTFDKBA1T0QFM
1611 Points
CrossMark / Creativity
Asus ProArt P16 H7606WI
NVIDIA GeForce RTX 4070 Laptop GPU, Ryzen AI 9 HX 370, Micron 2400 MTFDKBA1T0QFM
2270 Points
Average of class Gaming
  (1275 - 2660, n=143, last 2 years)
2101 Points
Lenovo Yoga Pro 9 16IMH9
NVIDIA GeForce RTX 4070 Laptop GPU, Ultra 9 185H, SK Hynix HFS001TEJ9X115N
1993 Points
Average Intel Core Ultra 9 185H, NVIDIA GeForce RTX 4070 Laptop GPU
  (1872 - 2008, n=3)
1958 Points
Asus ROG Zephyrus G16 2024 GU605M
NVIDIA GeForce RTX 4070 Laptop GPU, Ultra 7 155H, WD PC SN560 SDDPNQE-1T00
1942 Points
Alienware m16 R2
NVIDIA GeForce RTX 4070 Laptop GPU, Ultra 7 155H, Samsung PM9A1 MZVL21T0HCLR
1913 Points
CrossMark / Responsiveness
Average of class Gaming
  (1030 - 2330, n=143, last 2 years)
1709 Points
Alienware m16 R2
NVIDIA GeForce RTX 4070 Laptop GPU, Ultra 7 155H, Samsung PM9A1 MZVL21T0HCLR
1576 Points
Average Intel Core Ultra 9 185H, NVIDIA GeForce RTX 4070 Laptop GPU
  (1338 - 1856, n=3)
1525 Points
Asus ROG Zephyrus G16 2024 GU605M
NVIDIA GeForce RTX 4070 Laptop GPU, Ultra 7 155H, WD PC SN560 SDDPNQE-1T00
1424 Points
Lenovo Yoga Pro 9 16IMH9
NVIDIA GeForce RTX 4070 Laptop GPU, Ultra 9 185H, SK Hynix HFS001TEJ9X115N
1338 Points
Asus ProArt P16 H7606WI
NVIDIA GeForce RTX 4070 Laptop GPU, Ryzen AI 9 HX 370, Micron 2400 MTFDKBA1T0QFM
1225 Points
WebXPRT 3 / Overall
Average of class Gaming
  (215 - 480, n=161, last 2 years)
304 Points +13%
Asus ProArt P16 H7606WI
NVIDIA GeForce RTX 4070 Laptop GPU, Ryzen AI 9 HX 370, Micron 2400 MTFDKBA1T0QFM
298 Points +10%
Lenovo Yoga Pro 9 16IMH9
NVIDIA GeForce RTX 4070 Laptop GPU, Ultra 9 185H, SK Hynix HFS001TEJ9X115N
295 Points +9%
Alienware m16 R2
NVIDIA GeForce RTX 4070 Laptop GPU, Ultra 7 155H, Samsung PM9A1 MZVL21T0HCLR
294 Points +9%
Asus ROG Zephyrus G16 2024 GU605M
NVIDIA GeForce RTX 4070 Laptop GPU, Ultra 7 155H, WD PC SN560 SDDPNQE-1T00
283 Points +5%
Average Intel Core Ultra 9 185H, NVIDIA GeForce RTX 4070 Laptop GPU
  (240 - 295, n=5)
272 Points +1%
Acer Predator Triton Neo 16 PTN16-51-978P
NVIDIA GeForce RTX 4070 Laptop GPU, Ultra 9 185H, SK Hynix PC801 HFS001TEJ9X125N
270 Points
Acer Predator Triton Neo 16 PTN16-51-978P
NVIDIA GeForce RTX 4070 Laptop GPU, Ultra 9 185H, SK Hynix PC801 HFS001TEJ9X125N
270 Points 0%
WebXPRT 4 / Overall
Lenovo Yoga Pro 9 16IMH9
NVIDIA GeForce RTX 4070 Laptop GPU, Ultra 9 185H, SK Hynix HFS001TEJ9X115N
268 Points +8%
Average of class Gaming
  (176.4 - 328, n=150, last 2 years)
267 Points +7%
Alienware m16 R2
NVIDIA GeForce RTX 4070 Laptop GPU, Ultra 7 155H, Samsung PM9A1 MZVL21T0HCLR
257 Points +3%
Asus ROG Zephyrus G16 2024 GU605M
NVIDIA GeForce RTX 4070 Laptop GPU, Ultra 7 155H, WD PC SN560 SDDPNQE-1T00
256 Points +3%
Average Intel Core Ultra 9 185H, NVIDIA GeForce RTX 4070 Laptop GPU
  (248 - 268, n=5)
255 Points +2%
Acer Predator Triton Neo 16 PTN16-51-978P
NVIDIA GeForce RTX 4070 Laptop GPU, Ultra 9 185H, SK Hynix PC801 HFS001TEJ9X125N
249 Points
Acer Predator Triton Neo 16 PTN16-51-978P
NVIDIA GeForce RTX 4070 Laptop GPU, Ultra 9 185H, SK Hynix PC801 HFS001TEJ9X125N
249 Points 0%
Asus ProArt P16 H7606WI
NVIDIA GeForce RTX 4070 Laptop GPU, Ryzen AI 9 HX 370, Micron 2400 MTFDKBA1T0QFM
244 Points -2%
Mozilla Kraken 1.1 / Total
Acer Predator Triton Neo 16 PTN16-51-978P
NVIDIA GeForce RTX 4070 Laptop GPU, Ultra 9 185H, SK Hynix PC801 HFS001TEJ9X125N
549 ms *
Acer Predator Triton Neo 16 PTN16-51-978P
NVIDIA GeForce RTX 4070 Laptop GPU, Ultra 9 185H, SK Hynix PC801 HFS001TEJ9X125N
549 ms * -0%
Asus ROG Zephyrus G16 2024 GU605M
NVIDIA GeForce RTX 4070 Laptop GPU, Ultra 7 155H, WD PC SN560 SDDPNQE-1T00
548 ms * -0%
Alienware m16 R2
NVIDIA GeForce RTX 4070 Laptop GPU, Ultra 7 155H, Samsung PM9A1 MZVL21T0HCLR
546 ms * +1%
Average Intel Core Ultra 9 185H, NVIDIA GeForce RTX 4070 Laptop GPU
  (494 - 549, n=5)
525 ms * +4%
Average of class Gaming
  (421 - 674, n=176, last 2 years)
502 ms * +9%
Lenovo Yoga Pro 9 16IMH9
NVIDIA GeForce RTX 4070 Laptop GPU, Ultra 9 185H, SK Hynix HFS001TEJ9X115N
494 ms * +10%
Asus ProArt P16 H7606WI
NVIDIA GeForce RTX 4070 Laptop GPU, Ryzen AI 9 HX 370, Micron 2400 MTFDKBA1T0QFM
439 ms * +20%

* ... más pequeño es mejor

PCMark 10 Score
7443 puntos
ayuda
AIDA64 / Memory Copy
Lenovo Yoga Pro 9 16IMH9
Intel Core Ultra 9 185H, NVIDIA GeForce RTX 4070 Laptop GPU
94254 MB/s +19%
Asus ProArt P16 H7606WI
AMD Ryzen AI 9 HX 370, NVIDIA GeForce RTX 4070 Laptop GPU
89675 MB/s +13%
Asus ROG Zephyrus G16 2024 GU605M
Intel Core Ultra 7 155H, NVIDIA GeForce RTX 4070 Laptop GPU
89414 MB/s +12%
Average Intel Core Ultra 9 185H
  (69929 - 95718, n=19)
84413 MB/s +6%
Acer Predator Triton Neo 16 PTN16-51-978P
Intel Core Ultra 9 185H, NVIDIA GeForce RTX 4070 Laptop GPU
79538 MB/s
Average of class Gaming
  (21842 - 94222, n=182, last 2 years)
65752 MB/s -17%
Alienware m16 R2
Intel Core Ultra 7 155H, NVIDIA GeForce RTX 4070 Laptop GPU
63008 MB/s -21%
AIDA64 / Memory Read
Asus ProArt P16 H7606WI
AMD Ryzen AI 9 HX 370, NVIDIA GeForce RTX 4070 Laptop GPU
100415 MB/s +39%
Lenovo Yoga Pro 9 16IMH9
Intel Core Ultra 9 185H, NVIDIA GeForce RTX 4070 Laptop GPU
87768 MB/s +21%
Asus ROG Zephyrus G16 2024 GU605M
Intel Core Ultra 7 155H, NVIDIA GeForce RTX 4070 Laptop GPU
86576 MB/s +20%
Average Intel Core Ultra 9 185H
  (64619 - 87768, n=19)
79657 MB/s +10%
Alienware m16 R2
Intel Core Ultra 7 155H, NVIDIA GeForce RTX 4070 Laptop GPU
76370 MB/s +5%
Acer Predator Triton Neo 16 PTN16-51-978P
Intel Core Ultra 9 185H, NVIDIA GeForce RTX 4070 Laptop GPU
72422 MB/s
Average of class Gaming
  (23681 - 99713, n=182, last 2 years)
69626 MB/s -4%
AIDA64 / Memory Write
Asus ProArt P16 H7606WI
AMD Ryzen AI 9 HX 370, NVIDIA GeForce RTX 4070 Laptop GPU
100176 MB/s +35%
Lenovo Yoga Pro 9 16IMH9
Intel Core Ultra 9 185H, NVIDIA GeForce RTX 4070 Laptop GPU
75773 MB/s +2%
Acer Predator Triton Neo 16 PTN16-51-978P
Intel Core Ultra 9 185H, NVIDIA GeForce RTX 4070 Laptop GPU
74436 MB/s
Asus ROG Zephyrus G16 2024 GU605M
Intel Core Ultra 7 155H, NVIDIA GeForce RTX 4070 Laptop GPU
73337 MB/s -1%
Average Intel Core Ultra 9 185H
  (51114 - 93871, n=19)
72498 MB/s -3%
Average of class Gaming
  (22986 - 108954, n=182, last 2 years)
67472 MB/s -9%
Alienware m16 R2
Intel Core Ultra 7 155H, NVIDIA GeForce RTX 4070 Laptop GPU
66009 MB/s -11%
AIDA64 / Memory Latency
Average Intel Core Ultra 9 185H
  (121.4 - 259, n=19)
145.5 ns * -3%
Acer Predator Triton Neo 16 PTN16-51-978P
Intel Core Ultra 9 185H, NVIDIA GeForce RTX 4070 Laptop GPU
141.5 ns *
Asus ROG Zephyrus G16 2024 GU605M
Intel Core Ultra 7 155H, NVIDIA GeForce RTX 4070 Laptop GPU
140 ns * +1%
Lenovo Yoga Pro 9 16IMH9
Intel Core Ultra 9 185H, NVIDIA GeForce RTX 4070 Laptop GPU
129.6 ns * +8%
Alienware m16 R2
Intel Core Ultra 7 155H, NVIDIA GeForce RTX 4070 Laptop GPU
126.2 ns * +11%
Asus ProArt P16 H7606WI
AMD Ryzen AI 9 HX 370, NVIDIA GeForce RTX 4070 Laptop GPU
113.2 ns * +20%
Average of class Gaming
  (59.5 - 259, n=182, last 2 years)
94.1 ns * +33%

* ... más pequeño es mejor

Latencias del CPD

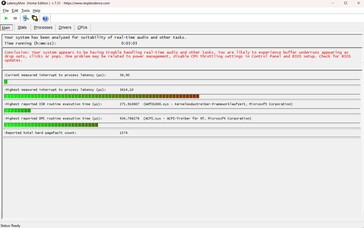
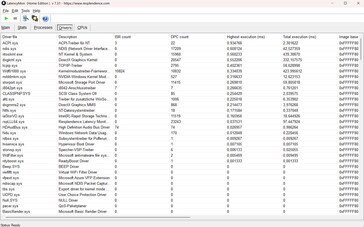
A Acer le vendría bien mejorar sus latencias. La herramienta LatencyMon reveló valores bastante altos, pero lo mismo podría decirse de algunos competidores. Sólo el Lenovo Yoga Pro 9 16 se mantuvo por debajo de la marca de los 1.000 µs.

LatencyMon
LatencyMon
DPC Latencies / LatencyMon - interrupt to process latency (max), Web, Youtube, Prime95
Acer Predator Triton Neo 16 PTN16-51-978P
NVIDIA GeForce RTX 4070 Laptop GPU, Ultra 9 185H, SK Hynix PC801 HFS001TEJ9X125N
3414 μs *
Asus ROG Zephyrus G16 2024 GU605M
NVIDIA GeForce RTX 4070 Laptop GPU, Ultra 7 155H, WD PC SN560 SDDPNQE-1T00
2484.4 μs * +27%
Alienware m16 R2
NVIDIA GeForce RTX 4070 Laptop GPU, Ultra 7 155H, Samsung PM9A1 MZVL21T0HCLR
2037.7 μs * +40%
Lenovo Yoga Pro 9 16IMH9
NVIDIA GeForce RTX 4070 Laptop GPU, Ultra 9 185H, SK Hynix HFS001TEJ9X115N
464.1 μs * +86%

* ... más pequeño es mejor

Dispositivo de almacenamiento

Por otro lado, el Predator Triton impresionó con su rapidísima unidad SSD de 1 TB (SK Hynix PC801). Según nuestra clasificación de rendimiento, el portátil Acer ocupó la primera posición entre los dispositivos de la comparación. Sin embargo, cabe mencionar que se produjeron fuertes fluctuaciones de rendimiento bajo carga prolongada, lo que no ocurrió con la competencia (véase el bucle DiskSpd).

SK Hynix PC801 HFS001TEJ9X125N
CDM 5/6 Read Seq Q32T1: 7052 MB/s
CDM 5/6 Write Seq Q32T1: 976.3 MB/s
CDM 5/6 Read 4K Q32T1: 608.2 MB/s
CDM 5/6 Write 4K Q32T1: 397.3 MB/s
CDM 5 Read Seq: 2957 MB/s
CDM 5 Write Seq: 976.6 MB/s
CDM 5/6 Read 4K: 59.48 MB/s
CDM 5/6 Write 4K: 228.6 MB/s
Drive Performance Rating - Percent
Acer Predator Triton Neo 16 PTN16-51-978P
SK Hynix PC801 HFS001TEJ9X125N
94.1 pt
Average SK Hynix PC801 HFS001TEJ9X125N
 
93.9 pt
Alienware m16 R2
Samsung PM9A1 MZVL21T0HCLR
82.3 pt
Average of class Gaming
 
71.9 pt
Lenovo Yoga Pro 9 16IMH9
SK Hynix HFS001TEJ9X115N
63.8 pt
Asus ROG Zephyrus G16 2024 GU605M
WD PC SN560 SDDPNQE-1T00
47.3 pt
Asus ProArt P16 H7606WI
Micron 2400 MTFDKBA1T0QFM
40.9 pt
DiskSpd
seq read
Average SK Hynix PC801 HFS001TEJ9X125N
  (3772 - 5314, n=2)
4543 MB/s +20%
Alienware m16 R2
Samsung PM9A1 MZVL21T0HCLR
4480 (4426.62min - 4479.73max) MB/s +19%
Acer Predator Triton Neo 16 PTN16-51-978P
SK Hynix PC801 HFS001TEJ9X125N
3772 (3723.81min - 3772.36max) MB/s
Average of class Gaming
  (1319 - 7045, n=164, last 2 years)
3478 MB/s -8%
Asus ROG Zephyrus G16 2024 GU605M
WD PC SN560 SDDPNQE-1T00
3202 (3129.61min - 3201.93max) MB/s -15%
Lenovo Yoga Pro 9 16IMH9
SK Hynix HFS001TEJ9X115N
2757 (2720.02min - 2757.13max) MB/s -27%
Asus ProArt P16 H7606WI
Micron 2400 MTFDKBA1T0QFM
2119 (2090.65min - 2119.22max) MB/s -44%
seq write
Average SK Hynix PC801 HFS001TEJ9X125N
  (5276 - 5300, n=2)
5288 MB/s 0%
Acer Predator Triton Neo 16 PTN16-51-978P
SK Hynix PC801 HFS001TEJ9X125N
5276 (5235.14min - 5275.95max) MB/s
Alienware m16 R2
Samsung PM9A1 MZVL21T0HCLR
4371 (4342.15min - 4371.09max) MB/s -17%
Average of class Gaming
  (535 - 9307, n=164, last 2 years)
3831 MB/s -27%
Lenovo Yoga Pro 9 16IMH9
SK Hynix HFS001TEJ9X115N
3474 (3404.52min - 3474.32max) MB/s -34%
Asus ROG Zephyrus G16 2024 GU605M
WD PC SN560 SDDPNQE-1T00
2526 (2498.97min - 2525.81max) MB/s -52%
Asus ProArt P16 H7606WI
Micron 2400 MTFDKBA1T0QFM
2138 (1936.3min - 2137.63max) MB/s -59%
seq q8 t1 read
Alienware m16 R2
Samsung PM9A1 MZVL21T0HCLR
7079 (6575.14min - 7078.73max) MB/s +3%
Average SK Hynix PC801 HFS001TEJ9X125N
  (6856 - 7150, n=2)
7003 MB/s +2%
Acer Predator Triton Neo 16 PTN16-51-978P
SK Hynix PC801 HFS001TEJ9X125N
6856 (6264.4min - 6855.93max) MB/s
Average of class Gaming
  (2594 - 16089, n=164, last 2 years)
6319 MB/s -8%
Lenovo Yoga Pro 9 16IMH9
SK Hynix HFS001TEJ9X115N
6257 (5307.47min - 6256.78max) MB/s -9%
Asus ROG Zephyrus G16 2024 GU605M
WD PC SN560 SDDPNQE-1T00
5008 (4421.01min - 5007.74max) MB/s -27%
Asus ProArt P16 H7606WI
Micron 2400 MTFDKBA1T0QFM
4785 (3105.25min - 4784.86max) MB/s -30%
seq q8 t1 write
Average SK Hynix PC801 HFS001TEJ9X125N
  (6184 - 6519, n=2)
6352 MB/s +3%
Acer Predator Triton Neo 16 PTN16-51-978P
SK Hynix PC801 HFS001TEJ9X125N
6184 (6135.32min - 6183.67max) MB/s
Lenovo Yoga Pro 9 16IMH9
SK Hynix HFS001TEJ9X115N
6040 (5907.05min - 6040.01max) MB/s -2%
Alienware m16 R2
Samsung PM9A1 MZVL21T0HCLR
5250 (5191.5min - 5250.22max) MB/s -15%
Average of class Gaming
  (539 - 14571, n=164, last 2 years)
4867 MB/s -21%
Asus ROG Zephyrus G16 2024 GU605M
WD PC SN560 SDDPNQE-1T00
3230 (3169.22min - 3230.03max) MB/s -48%
Asus ProArt P16 H7606WI
Micron 2400 MTFDKBA1T0QFM
3109 (2917.35min - 3109.45max) MB/s -50%
4k q1 t1 read
Alienware m16 R2
Samsung PM9A1 MZVL21T0HCLR
83.5 (82.8min - 83.52max) MB/s +4%
Acer Predator Triton Neo 16 PTN16-51-978P
SK Hynix PC801 HFS001TEJ9X125N
80.3 (79.74min - 80.34max) MB/s
Average SK Hynix PC801 HFS001TEJ9X125N
  (78.3 - 80.3, n=2)
79.3 MB/s -1%
Average of class Gaming
  (30.6 - 95.9, n=164, last 2 years)
65.9 MB/s -18%
Lenovo Yoga Pro 9 16IMH9
SK Hynix HFS001TEJ9X115N
63.7 (63.29min - 63.65max) MB/s -21%
Asus ROG Zephyrus G16 2024 GU605M
WD PC SN560 SDDPNQE-1T00
52.9 (51.15min - 52.91max) MB/s -34%
Asus ProArt P16 H7606WI
Micron 2400 MTFDKBA1T0QFM
39.9 (39.46min - 39.9max) MB/s -50%
4k q1 t1 write
Average SK Hynix PC801 HFS001TEJ9X125N
  (253 - 268, n=2)
261 MB/s +3%
Acer Predator Triton Neo 16 PTN16-51-978P
SK Hynix PC801 HFS001TEJ9X125N
253 (248.67min - 252.62max) MB/s
Average of class Gaming
  (78 - 397, n=164, last 2 years)
224 MB/s -11%
Alienware m16 R2
Samsung PM9A1 MZVL21T0HCLR
198.1 (195.9min - 198.06max) MB/s -22%
Lenovo Yoga Pro 9 16IMH9
SK Hynix HFS001TEJ9X115N
139.8 (135.84min - 139.76max) MB/s -45%
Asus ROG Zephyrus G16 2024 GU605M
WD PC SN560 SDDPNQE-1T00
128.4 (126.56min - 128.36max) MB/s -49%
Asus ProArt P16 H7606WI
Micron 2400 MTFDKBA1T0QFM
75.9 (71.09min - 75.93max) MB/s -70%
4k q32 t16 read
Acer Predator Triton Neo 16 PTN16-51-978P
SK Hynix PC801 HFS001TEJ9X125N
4884 (4800.09min - 4884.18max) MB/s
Average SK Hynix PC801 HFS001TEJ9X125N
  (4820 - 4884, n=2)
4852 MB/s -1%
Alienware m16 R2
Samsung PM9A1 MZVL21T0HCLR
3630 (3471.35min - 3629.9max) MB/s -26%
Average of class Gaming
  (417 - 6172, n=164, last 2 years)
2589 MB/s -47%
Lenovo Yoga Pro 9 16IMH9
SK Hynix HFS001TEJ9X115N
859 (816.31min - 859.16max) MB/s -82%
Asus ROG Zephyrus G16 2024 GU605M
WD PC SN560 SDDPNQE-1T00
604 (565.74min - 603.6max) MB/s -88%
Asus ProArt P16 H7606WI
Micron 2400 MTFDKBA1T0QFM
548 (543.4min - 547.55max) MB/s -89%
4k q32 t16 write
Average SK Hynix PC801 HFS001TEJ9X125N
  (3073 - 3091, n=2)
3082 MB/s 0%
Acer Predator Triton Neo 16 PTN16-51-978P
SK Hynix PC801 HFS001TEJ9X125N
3073 (3055.16min - 3073.44max) MB/s
Alienware m16 R2
Samsung PM9A1 MZVL21T0HCLR
3003 (2991.33min - 3002.71max) MB/s -2%
Average of class Gaming
  (162.3 - 4869, n=164, last 2 years)
2144 MB/s -30%
Lenovo Yoga Pro 9 16IMH9
SK Hynix HFS001TEJ9X115N
439 (405.1min - 438.82max) MB/s -86%
Asus ROG Zephyrus G16 2024 GU605M
WD PC SN560 SDDPNQE-1T00
402 (389.17min - 402.07max) MB/s -87%
Asus ProArt P16 H7606WI
Micron 2400 MTFDKBA1T0QFM
231 (200.24min - 231.41max) MB/s -92%
AS SSD
Score Total
Acer Predator Triton Neo 16 PTN16-51-978P
SK Hynix PC801 HFS001TEJ9X125N
9306 Points
Average SK Hynix PC801 HFS001TEJ9X125N
  (8486 - 9306, n=2)
8896 Points -4%
Alienware m16 R2
Samsung PM9A1 MZVL21T0HCLR
8059 Points -13%
Average of class Gaming
  (2271 - 13854, n=155, last 2 years)
6759 Points -27%
Lenovo Yoga Pro 9 16IMH9
SK Hynix HFS001TEJ9X115N
5214 Points -44%
Asus ProArt P16 H7606WI
Micron 2400 MTFDKBA1T0QFM
3843 Points -59%
Asus ROG Zephyrus G16 2024 GU605M
WD PC SN560 SDDPNQE-1T00
3272 Points -65%
Score Read
Acer Predator Triton Neo 16 PTN16-51-978P
SK Hynix PC801 HFS001TEJ9X125N
3081 Points
Alienware m16 R2
Samsung PM9A1 MZVL21T0HCLR
3005 Points -2%
Average SK Hynix PC801 HFS001TEJ9X125N
  (2908 - 3081, n=2)
2995 Points -3%
Average of class Gaming
  (776 - 4721, n=155, last 2 years)
2451 Points -20%
Lenovo Yoga Pro 9 16IMH9
SK Hynix HFS001TEJ9X115N
1397 Points -55%
Asus ROG Zephyrus G16 2024 GU605M
WD PC SN560 SDDPNQE-1T00
1020 Points -67%
Asus ProArt P16 H7606WI
Micron 2400 MTFDKBA1T0QFM
962 Points -69%
Score Write
Acer Predator Triton Neo 16 PTN16-51-978P
SK Hynix PC801 HFS001TEJ9X125N
4656 Points
Average SK Hynix PC801 HFS001TEJ9X125N
  (4106 - 4656, n=2)
4381 Points -6%
Alienware m16 R2
Samsung PM9A1 MZVL21T0HCLR
3573 Points -23%
Lenovo Yoga Pro 9 16IMH9
SK Hynix HFS001TEJ9X115N
3190 Points -31%
Average of class Gaming
  (515 - 7208, n=155, last 2 years)
3117 Points -33%
Asus ProArt P16 H7606WI
Micron 2400 MTFDKBA1T0QFM
2455 Points -47%
Asus ROG Zephyrus G16 2024 GU605M
WD PC SN560 SDDPNQE-1T00
1808 Points -61%
Seq Read
Average SK Hynix PC801 HFS001TEJ9X125N
  (5653 - 5687, n=2)
5670 MB/s 0%
Acer Predator Triton Neo 16 PTN16-51-978P
SK Hynix PC801 HFS001TEJ9X125N
5653.46 MB/s
Alienware m16 R2
Samsung PM9A1 MZVL21T0HCLR
5592.15 MB/s -1%
Lenovo Yoga Pro 9 16IMH9
SK Hynix HFS001TEJ9X115N
5399 MB/s -5%
Average of class Gaming
  (2260 - 12763, n=155, last 2 years)
4958 MB/s -12%
Asus ProArt P16 H7606WI
Micron 2400 MTFDKBA1T0QFM
3776 MB/s -33%
Asus ROG Zephyrus G16 2024 GU605M
WD PC SN560 SDDPNQE-1T00
3662 MB/s -35%
Seq Write
Acer Predator Triton Neo 16 PTN16-51-978P
SK Hynix PC801 HFS001TEJ9X125N
5470.77 MB/s
Average SK Hynix PC801 HFS001TEJ9X125N
  (5335 - 5471, n=2)
5403 MB/s -1%
Alienware m16 R2
Samsung PM9A1 MZVL21T0HCLR
4431.18 MB/s -19%
Average of class Gaming
  (495 - 11316, n=155, last 2 years)
3780 MB/s -31%
Lenovo Yoga Pro 9 16IMH9
SK Hynix HFS001TEJ9X115N
3314 MB/s -39%
Asus ProArt P16 H7606WI
Micron 2400 MTFDKBA1T0QFM
2397 MB/s -56%
Asus ROG Zephyrus G16 2024 GU605M
WD PC SN560 SDDPNQE-1T00
1921 MB/s -65%
4K Read
Acer Predator Triton Neo 16 PTN16-51-978P
SK Hynix PC801 HFS001TEJ9X125N
74.63 MB/s
Average SK Hynix PC801 HFS001TEJ9X125N
  (70.3 - 74.6, n=2)
72.5 MB/s -3%
Alienware m16 R2
Samsung PM9A1 MZVL21T0HCLR
71.52 MB/s -4%
Average of class Gaming
  (27.8 - 112.1, n=155, last 2 years)
65 MB/s -13%
Lenovo Yoga Pro 9 16IMH9
SK Hynix HFS001TEJ9X115N
64.2 MB/s -14%
Asus ROG Zephyrus G16 2024 GU605M
WD PC SN560 SDDPNQE-1T00
42.2 MB/s -43%
Asus ProArt P16 H7606WI
Micron 2400 MTFDKBA1T0QFM
28.7 MB/s -62%
4K Write
Average SK Hynix PC801 HFS001TEJ9X125N
  (226 - 231, n=2)
229 MB/s +1%
Acer Predator Triton Neo 16 PTN16-51-978P
SK Hynix PC801 HFS001TEJ9X125N
225.97 MB/s
Average of class Gaming
  (108.8 - 512, n=155, last 2 years)
212 MB/s -6%
Lenovo Yoga Pro 9 16IMH9
SK Hynix HFS001TEJ9X115N
183.8 MB/s -19%
Alienware m16 R2
Samsung PM9A1 MZVL21T0HCLR
179.15 MB/s -21%
Asus ProArt P16 H7606WI
Micron 2400 MTFDKBA1T0QFM
178 MB/s -21%
Asus ROG Zephyrus G16 2024 GU605M
WD PC SN560 SDDPNQE-1T00
157.9 MB/s -30%
4K-64 Read
Acer Predator Triton Neo 16 PTN16-51-978P
SK Hynix PC801 HFS001TEJ9X125N
2441.35 MB/s
Alienware m16 R2
Samsung PM9A1 MZVL21T0HCLR
2374.63 MB/s -3%
Average SK Hynix PC801 HFS001TEJ9X125N
  (2269 - 2441, n=2)
2355 MB/s -4%
Average of class Gaming
  (451 - 3475, n=155, last 2 years)
1885 MB/s -23%
Lenovo Yoga Pro 9 16IMH9
SK Hynix HFS001TEJ9X115N
793 MB/s -68%
Asus ROG Zephyrus G16 2024 GU605M
WD PC SN560 SDDPNQE-1T00
612 MB/s -75%
Asus ProArt P16 H7606WI
Micron 2400 MTFDKBA1T0QFM
555 MB/s -77%
4K-64 Write
Acer Predator Triton Neo 16 PTN16-51-978P
SK Hynix PC801 HFS001TEJ9X125N
3882.49 MB/s
Average SK Hynix PC801 HFS001TEJ9X125N
  (3341 - 3882, n=2)
3612 MB/s -7%
Alienware m16 R2
Samsung PM9A1 MZVL21T0HCLR
2951.09 MB/s -24%
Lenovo Yoga Pro 9 16IMH9
SK Hynix HFS001TEJ9X115N
2675 MB/s -31%
Average of class Gaming
  (277 - 5909, n=155, last 2 years)
2530 MB/s -35%
Asus ProArt P16 H7606WI
Micron 2400 MTFDKBA1T0QFM
2038 MB/s -48%
Asus ROG Zephyrus G16 2024 GU605M
WD PC SN560 SDDPNQE-1T00
1458 MB/s -62%
Access Time Read
Average of class Gaming
  (0.016 - 0.379, n=154, last 2 years)
0.05545 ms * -50%
Alienware m16 R2
Samsung PM9A1 MZVL21T0HCLR
0.047 ms * -27%
Average SK Hynix PC801 HFS001TEJ9X125N
  (0.037 - 0.038, n=2)
0.0375 ms * -1%
Acer Predator Triton Neo 16 PTN16-51-978P
SK Hynix PC801 HFS001TEJ9X125N
0.037 ms *
Asus ROG Zephyrus G16 2024 GU605M
WD PC SN560 SDDPNQE-1T00
0.032 ms * +14%
Asus ProArt P16 H7606WI
Micron 2400 MTFDKBA1T0QFM
0.027 ms * +27%
Lenovo Yoga Pro 9 16IMH9
SK Hynix HFS001TEJ9X115N
0.021 ms * +43%
Access Time Write
Asus ProArt P16 H7606WI
Micron 2400 MTFDKBA1T0QFM
0.137 ms * -661%
Alienware m16 R2
Samsung PM9A1 MZVL21T0HCLR
0.07 ms * -289%
Average of class Gaming
  (0.011 - 1.028, n=155, last 2 years)
0.04715 ms * -162%
Asus ROG Zephyrus G16 2024 GU605M
WD PC SN560 SDDPNQE-1T00
0.023 ms * -28%
Lenovo Yoga Pro 9 16IMH9
SK Hynix HFS001TEJ9X115N
0.02 ms * -11%
Acer Predator Triton Neo 16 PTN16-51-978P
SK Hynix PC801 HFS001TEJ9X125N
0.018 ms *
Average SK Hynix PC801 HFS001TEJ9X125N
  (0.018 - 0.018, n=2)
0.018 ms * -0%

* ... más pequeño es mejor

Reading continuous performance: DiskSpd Read Loop, Queue Depth 8

036072010801440180021602520288032403600396043204680504054005760612064806840Tooltip
Acer Predator Triton Neo 16 PTN16-51-978P SK Hynix PC801 HFS001TEJ9X125N; diskspd 2.0.17 f: Ø6191 (3458.63-7113.78)
Asus ProArt P16 H7606WI Micron 2400 MTFDKBA1T0QFM; diskspd 2.0.17 f: Ø4823 (4004.26-4857.63)
Lenovo Yoga Pro 9 16IMH9 SK Hynix HFS001TEJ9X115N; diskspd 2.0.17 f: Ø6232 (4915.93-6315.2)
Asus ROG Zephyrus G16 2024 GU605M WD PC SN560 SDDPNQE-1T00; diskspd 2.0.17 f: Ø4947 (4458.34-4961.59)
Alienware m16 R2 Samsung PM9A1 MZVL21T0HCLR; diskspd 2.0.17 f: Ø7063 (6446.85-7107.46)

Tarjeta gráfica

La GeForce RTX 4070 genera ahora sentimientos encontrados. Aunque su rendimiento básico es bastante respetable, su limitada VRAM de 8 GB se convierte cada vez más en un escollo cuando se ejecutan juegos exigentes (por ejemplo Indiana Jonespor ejemplo). Acer ha optado además por un TGP bastante moderado de 110 vatios incluyendo Dynamic Boost para el Predator Triton Neo 16 (hasta 140 vatios podría ser posible), lo que también es evidente en los puntos de referencia. Durante la prueba de la GPU, esto sólo fue suficiente para asegurarse el último puesto en el campo de pruebas. Interesante: Incluso el Asus ROG Zephyrus G16que tiene un TGP de 80 vatios, fue más rápida (al jugar a Cyberpunk 2077, por ejemplo, el consumo de energía de la RTX 4070 en la Neo 16 se limitó a un máximo de 76 vatios al utilizar el modo Rendimiento ).

3DMark Performance Rating - Percent
Average of class Gaming
 
100 pt
Alienware m16 R2
NVIDIA GeForce RTX 4070 Laptop GPU, Intel Core Ultra 7 155H
97.7 pt
Asus ProArt P16 H7606WI
NVIDIA GeForce RTX 4070 Laptop GPU, AMD Ryzen AI 9 HX 370
94.5 pt
Lenovo Yoga Pro 9 16IMH9
NVIDIA GeForce RTX 4070 Laptop GPU, Intel Core Ultra 9 185H
94.3 pt
Average NVIDIA GeForce RTX 4070 Laptop GPU
 
90.7 pt
Asus ROG Zephyrus G16 2024 GU605M
NVIDIA GeForce RTX 4070 Laptop GPU, Intel Core Ultra 7 155H
84.2 pt
Acer Predator Triton Neo 16 PTN16-51-978P
NVIDIA GeForce RTX 4070 Laptop GPU, Intel Core Ultra 9 185H
82.6 pt
3DMark 11 - 1280x720 Performance GPU
Average of class Gaming
  (1029 - 72178, n=182, last 2 years)
43982 Points +22%
Asus ProArt P16 H7606WI
NVIDIA GeForce RTX 4070 Laptop GPU, AMD Ryzen AI 9 HX 370
42821 Points +19%
Alienware m16 R2
NVIDIA GeForce RTX 4070 Laptop GPU, Intel Core Ultra 7 155H
42296 Points +18%
Lenovo Yoga Pro 9 16IMH9
NVIDIA GeForce RTX 4070 Laptop GPU, Intel Core Ultra 9 185H
40646 Points +13%
Average NVIDIA GeForce RTX 4070 Laptop GPU
  (24229 - 46434, n=65)
40385 Points +12%
Asus ROG Zephyrus G16 2024 GU605M
NVIDIA GeForce RTX 4070 Laptop GPU, Intel Core Ultra 7 155H
37313 Points +4%
Acer Predator Triton Neo 16 PTN16-51-978P
NVIDIA GeForce RTX 4070 Laptop GPU, Intel Core Ultra 9 185H
35972 Points
3DMark
1920x1080 Fire Strike Graphics
Average of class Gaming
  (781 - 53059, n=193, last 2 years)
31524 Points +17%
Alienware m16 R2
NVIDIA GeForce RTX 4070 Laptop GPU, Intel Core Ultra 7 155H
30932 Points +15%
Lenovo Yoga Pro 9 16IMH9
NVIDIA GeForce RTX 4070 Laptop GPU, Intel Core Ultra 9 185H
30874 Points +15%
Asus ProArt P16 H7606WI
NVIDIA GeForce RTX 4070 Laptop GPU, AMD Ryzen AI 9 HX 370
30137 Points +12%
Average NVIDIA GeForce RTX 4070 Laptop GPU
  (12242 - 33451, n=69)
29068 Points +8%
Acer Predator Triton Neo 16 PTN16-51-978P
NVIDIA GeForce RTX 4070 Laptop GPU, Intel Core Ultra 9 185H
26898 Points
Asus ROG Zephyrus G16 2024 GU605M
NVIDIA GeForce RTX 4070 Laptop GPU, Intel Core Ultra 7 155H
26568 Points -1%
2560x1440 Time Spy Graphics
Average of class Gaming
  (224 - 22717, n=188, last 2 years)
13169 Points +24%
Alienware m16 R2
NVIDIA GeForce RTX 4070 Laptop GPU, Intel Core Ultra 7 155H
12997 Points +22%
Lenovo Yoga Pro 9 16IMH9
NVIDIA GeForce RTX 4070 Laptop GPU, Intel Core Ultra 9 185H
12181 Points +15%
Asus ProArt P16 H7606WI
NVIDIA GeForce RTX 4070 Laptop GPU, AMD Ryzen AI 9 HX 370
11941 Points +12%
Average NVIDIA GeForce RTX 4070 Laptop GPU
  (5012 - 13391, n=67)
11602 Points +9%
Asus ROG Zephyrus G16 2024 GU605M
NVIDIA GeForce RTX 4070 Laptop GPU, Intel Core Ultra 7 155H
10989 Points +3%
Acer Predator Triton Neo 16 PTN16-51-978P
NVIDIA GeForce RTX 4070 Laptop GPU, Intel Core Ultra 9 185H
10636 Points
3DMark 11 Performance
31196 puntos
3DMark Ice Storm Standard Score
196686 puntos
3DMark Cloud Gate Standard Score
58960 puntos
3DMark Fire Strike Score
23102 puntos
3DMark Time Spy Score
10712 puntos
ayuda
Blender
v3.3 Classroom OPTIX/RTX
Asus ROG Zephyrus G16 2024 GU605M
NVIDIA GeForce RTX 4070 Laptop GPU, Intel Core Ultra 7 155H
22 Seconds * -5%
Asus ProArt P16 H7606WI
NVIDIA GeForce RTX 4070 Laptop GPU, AMD Ryzen AI 9 HX 370
22 Seconds * -5%
Average NVIDIA GeForce RTX 4070 Laptop GPU
  (18 - 30, n=66)
21.5 Seconds * -2%
Acer Predator Triton Neo 16 PTN16-51-978P
NVIDIA GeForce RTX 4070 Laptop GPU, Intel Core Ultra 9 185H
21 Seconds *
Average of class Gaming
  (9 - 95, n=178, last 2 years)
20.7 Seconds * +1%
Alienware m16 R2
NVIDIA GeForce RTX 4070 Laptop GPU, Intel Core Ultra 7 155H
20 Seconds * +5%
Lenovo Yoga Pro 9 16IMH9
NVIDIA GeForce RTX 4070 Laptop GPU, Intel Core Ultra 9 185H
19 Seconds * +10%
v3.3 Classroom CUDA
Average NVIDIA GeForce RTX 4070 Laptop GPU
  (32 - 181, n=68)
40.1 Seconds * -11%
Average of class Gaming
  (16 - 175, n=184, last 2 years)
36.6 Seconds * -2%
Acer Predator Triton Neo 16 PTN16-51-978P
NVIDIA GeForce RTX 4070 Laptop GPU, Intel Core Ultra 9 185H
36 Seconds *
Asus ROG Zephyrus G16 2024 GU605M
NVIDIA GeForce RTX 4070 Laptop GPU, Intel Core Ultra 7 155H
34 Seconds * +6%
Asus ProArt P16 H7606WI
NVIDIA GeForce RTX 4070 Laptop GPU, AMD Ryzen AI 9 HX 370
34 Seconds * +6%
Alienware m16 R2
NVIDIA GeForce RTX 4070 Laptop GPU, Intel Core Ultra 7 155H
33 Seconds * +8%
Lenovo Yoga Pro 9 16IMH9
NVIDIA GeForce RTX 4070 Laptop GPU, Intel Core Ultra 9 185H
32 Seconds * +11%
v3.3 Classroom CPU
Asus ROG Zephyrus G16 2024 GU605M
NVIDIA GeForce RTX 4070 Laptop GPU, Intel Core Ultra 7 155H
330 Seconds * -7%
Acer Predator Triton Neo 16 PTN16-51-978P
NVIDIA GeForce RTX 4070 Laptop GPU, Intel Core Ultra 9 185H
309 Seconds *
Alienware m16 R2
NVIDIA GeForce RTX 4070 Laptop GPU, Intel Core Ultra 7 155H
296 Seconds * +4%
Average of class Gaming
  (138 - 962, n=187, last 2 years)
293 Seconds * +5%
Average NVIDIA GeForce RTX 4070 Laptop GPU
  (158 - 440, n=65)
289 Seconds * +6%
Lenovo Yoga Pro 9 16IMH9
NVIDIA GeForce RTX 4070 Laptop GPU, Intel Core Ultra 9 185H
285 Seconds * +8%
Asus ProArt P16 H7606WI
NVIDIA GeForce RTX 4070 Laptop GPU, AMD Ryzen AI 9 HX 370
214 Seconds * +31%

* ... más pequeño es mejor

Rendimiento en juegos

Las cosas se ven un poco mejor durante los juegos cotidianos. Aquí, el portátil Acer se situó un poco por delante de su homólogo Asus, pero sigue estando por detrás de los demás competidores. En general, la RTX 4070 es lo bastante rápida para ejecutar sin problemas la mayoría de los juegos actuales con los máximos detalles en resolución Full HD (por ejemplo, 1.920 x 1.080). En la gama QHD (por ejemplo, 2.560 x 1.440 píxeles), la situación ya no parece tan halagüeña. Los juegos de alta carga computacional como Hellblade 2, Until Dawn y Stalker 2 requieren una reducción de los detalles o el uso de DLSS (véase la tabla). Sólo recomendaríamos utilizar la resolución nativa de la Neo 16 para los juegos menos exigentes. 3.200 x 2.000 píxeles están ahora al límite para una RTX 4070 (a menos que utilice potentes métodos de escalado).

Performance Rating - Percent
Average of class Gaming
 
97.2 pt
Alienware m16 R2 -1!
NVIDIA GeForce RTX 4070 Laptop GPU, Ultra 7 155H
94.4 pt
Lenovo Yoga Pro 9 16IMH9
NVIDIA GeForce RTX 4070 Laptop GPU, Ultra 9 185H
91.7 pt
Average NVIDIA GeForce RTX 4070 Laptop GPU
 
91.3 pt
Asus ProArt P16 H7606WI
NVIDIA GeForce RTX 4070 Laptop GPU, Ryzen AI 9 HX 370
85.9 pt
Acer Predator Triton Neo 16 PTN16-51-978P -1!
NVIDIA GeForce RTX 4070 Laptop GPU, Ultra 9 185H
83 pt
Asus ROG Zephyrus G16 2024 GU605M -1!
NVIDIA GeForce RTX 4070 Laptop GPU, Ultra 7 155H
78.1 pt
Cyberpunk 2077 2.1 Phantom Liberty - 1920x1080 Ultra Preset (FSR off)
Average of class Gaming
  (6.76 - 144.7, n=81, last 2 years)
86.3 fps +25%
Alienware m16 R2
NVIDIA GeForce RTX 4070 Laptop GPU, Ultra 7 155H
83.1 (28.4min) fps +20%
Asus ProArt P16 H7606WI
NVIDIA GeForce RTX 4070 Laptop GPU, Ryzen AI 9 HX 370
80.7 (65.3min) fps +17%
Average NVIDIA GeForce RTX 4070 Laptop GPU
  (30.7 - 90.7, n=36)
79.1 fps +14%
Lenovo Yoga Pro 9 16IMH9
NVIDIA GeForce RTX 4070 Laptop GPU, Ultra 9 185H
76.9 (18min) fps +11%
Acer Predator Triton Neo 16 PTN16-51-978P
NVIDIA GeForce RTX 4070 Laptop GPU, Ultra 9 185H
69.1 (56min) fps
Asus ROG Zephyrus G16 2024 GU605M
NVIDIA GeForce RTX 4070 Laptop GPU, Ultra 7 155H
69 fps 0%
Baldur's Gate 3 - 1920x1080 Ultra Preset
Alienware m16 R2
NVIDIA GeForce RTX 4070 Laptop GPU, Ultra 7 155H
128.5 fps +41%
Lenovo Yoga Pro 9 16IMH9
NVIDIA GeForce RTX 4070 Laptop GPU, Ultra 9 185H
117.7 fps +29%
Average of class Gaming
  (34.5 - 208, n=46, last 2 years)
103.2 fps +13%
Average NVIDIA GeForce RTX 4070 Laptop GPU
  (66.7 - 128.5, n=26)
101 fps +11%
Acer Predator Triton Neo 16 PTN16-51-978P
NVIDIA GeForce RTX 4070 Laptop GPU, Ultra 9 185H
91.1 (29.4min, 35.3P0.1, 60.7P1) fps
Asus ProArt P16 H7606WI
NVIDIA GeForce RTX 4070 Laptop GPU, Ryzen AI 9 HX 370
82.5 fps -9%
GTA V - 1920x1080 Highest Settings possible AA:4xMSAA + FX AF:16x
Average of class Gaming
  (12.1 - 167.7, n=169, last 2 years)
113.9 fps +9%
Asus ProArt P16 H7606WI
NVIDIA GeForce RTX 4070 Laptop GPU, Ryzen AI 9 HX 370
111.2 (9.03min, 76.9P1) fps +6%
Average NVIDIA GeForce RTX 4070 Laptop GPU
  (48.3 - 141.6, n=61)
111.1 fps +6%
Lenovo Yoga Pro 9 16IMH9
NVIDIA GeForce RTX 4070 Laptop GPU, Ultra 9 185H
110.9 (3.51min, 71.4P1) fps +6%
Acer Predator Triton Neo 16 PTN16-51-978P
NVIDIA GeForce RTX 4070 Laptop GPU, Ultra 9 185H
104.6 (4.27min, 55.6P1) fps
Asus ROG Zephyrus G16 2024 GU605M
NVIDIA GeForce RTX 4070 Laptop GPU, Ultra 7 155H
98.8 (3.78min, 58.8P1) fps -6%
Final Fantasy XV Benchmark - 1920x1080 High Quality
Average of class Gaming
  (19.2 - 201, n=181, last 2 years)
120.3 fps +21%
Alienware m16 R2
NVIDIA GeForce RTX 4070 Laptop GPU, Ultra 7 155H
119.3 fps +20%
Lenovo Yoga Pro 9 16IMH9
NVIDIA GeForce RTX 4070 Laptop GPU, Ultra 9 185H
115.7 fps +16%
Asus ProArt P16 H7606WI
NVIDIA GeForce RTX 4070 Laptop GPU, Ryzen AI 9 HX 370
115.3 fps +16%
Average NVIDIA GeForce RTX 4070 Laptop GPU
  (41 - 131.9, n=63)
110.9 fps +11%
Asus ROG Zephyrus G16 2024 GU605M
NVIDIA GeForce RTX 4070 Laptop GPU, Ultra 7 155H
100.8 fps +1%
Acer Predator Triton Neo 16 PTN16-51-978P
NVIDIA GeForce RTX 4070 Laptop GPU, Ultra 9 185H
99.7 fps
Strange Brigade - 1920x1080 ultra AA:ultra AF:16
Average of class Gaming
  (38.9 - 421, n=177, last 2 years)
230 fps
Alienware m16 R2
NVIDIA GeForce RTX 4070 Laptop GPU, Ultra 7 155H
219 (38.5min, 163.7P1) fps
Lenovo Yoga Pro 9 16IMH9
NVIDIA GeForce RTX 4070 Laptop GPU, Ultra 9 185H
213 fps
Asus ProArt P16 H7606WI
NVIDIA GeForce RTX 4070 Laptop GPU, Ryzen AI 9 HX 370
206 (86.5min, 156P1) fps
Average NVIDIA GeForce RTX 4070 Laptop GPU
  (76.3 - 234, n=62)
196.3 fps
Asus ROG Zephyrus G16 2024 GU605M
NVIDIA GeForce RTX 4070 Laptop GPU, Ultra 7 155H
129.3 (30.4min, 84.7P1) fps
Dota 2 Reborn - 1920x1080 ultra (3/3) best looking
Average of class Gaming
  (65.1 - 220, n=186, last 2 years)
151.3 fps +11%
Average NVIDIA GeForce RTX 4070 Laptop GPU
  (89.7 - 191.2, n=65)
147.9 fps +9%
Asus ProArt P16 H7606WI
NVIDIA GeForce RTX 4070 Laptop GPU, Ryzen AI 9 HX 370
141.6 (119.2min) fps +4%
Alienware m16 R2
NVIDIA GeForce RTX 4070 Laptop GPU, Ultra 7 155H
139.7 (120.9min) fps +3%
Lenovo Yoga Pro 9 16IMH9
NVIDIA GeForce RTX 4070 Laptop GPU, Ultra 9 185H
139 (119.7min) fps +2%
Acer Predator Triton Neo 16 PTN16-51-978P
NVIDIA GeForce RTX 4070 Laptop GPU, Ultra 9 185H
135.9 (115.5min) fps
Asus ROG Zephyrus G16 2024 GU605M
NVIDIA GeForce RTX 4070 Laptop GPU, Ultra 7 155H
131.6 (114.5min) fps -3%
X-Plane 11.11 - 1920x1080 high (fps_test=3)
Average of class Gaming
  (32.8 - 166.2, n=193, last 2 years)
108.5 fps +22%
Average NVIDIA GeForce RTX 4070 Laptop GPU
  (52.1 - 147.9, n=67)
104.4 fps +17%
Alienware m16 R2
NVIDIA GeForce RTX 4070 Laptop GPU, Ultra 7 155H
90.8 fps +2%
Lenovo Yoga Pro 9 16IMH9
NVIDIA GeForce RTX 4070 Laptop GPU, Ultra 9 185H
90.5 fps +1%
Acer Predator Triton Neo 16 PTN16-51-978P
NVIDIA GeForce RTX 4070 Laptop GPU, Ultra 9 185H
89.2 fps
Asus ROG Zephyrus G16 2024 GU605M
NVIDIA GeForce RTX 4070 Laptop GPU, Ultra 7 155H
81.2 fps -9%
Asus ProArt P16 H7606WI
NVIDIA GeForce RTX 4070 Laptop GPU, Ryzen AI 9 HX 370
72.3 fps -19%
bajomedioaltoultraQHD DLSSQHD
GTA V (2015) 173.4 166.4 104.6
Dota 2 Reborn (2015) 169.6 150.5 144.3 135.9
Final Fantasy XV Benchmark (2018) 132.4 99.7
X-Plane 11.11 (2018) 130.8 116.5 89.2
Baldur's Gate 3 (2023) 108.4 94.8 91.1 65
Cyberpunk 2077 2.1 Phantom Liberty (2023) 93.9 80.1 69.1 42.3
Senua's Saga Hellblade 2 (2024) 53.2 39.3 42.2 27.1
Star Wars Outlaws (2024) 44.9 40.8 34.4 34.1 23.3
Space Marine 2 (2024) 74.4 72.8 67.9 65.1 48.2
Final Fantasy XVI (2024) 68.2 59 54.3 53.9 37.6
Until Dawn (2024) 83.7 58.9 44.9 41.5 32.9
Call of Duty Black Ops 6 (2024) 105 81 76 65 60
Stalker 2 (2024) 57.1 49.7 42.3 58.3 31.7
Cyberpunk 2077 2.1 Phantom Liberty
1920x1080 High Preset (FSR off)
Alienware m16 R2
NVIDIA GeForce RTX 4070 Laptop GPU, Ultra 7 155H
95.6 (35.4min) fps +19%
Asus ProArt P16 H7606WI
NVIDIA GeForce RTX 4070 Laptop GPU, Ryzen AI 9 HX 370
94.1 (77.9min) fps +17%
Average NVIDIA GeForce RTX 4070 Laptop GPU
  (74.7 - 103.6, n=29)
92.1 fps +15%
Average of class Gaming
  (7.4 - 164.5, n=61, last 2 years)
92.1 fps +15%
Lenovo Yoga Pro 9 16IMH9
NVIDIA GeForce RTX 4070 Laptop GPU, Ultra 9 185H
90.5 (40.2min) fps +13%
Acer Predator Triton Neo 16 PTN16-51-978P
NVIDIA GeForce RTX 4070 Laptop GPU, Ultra 9 185H
80.1 (66min) fps
Asus ROG Zephyrus G16 2024 GU605M
NVIDIA GeForce RTX 4070 Laptop GPU, Ultra 7 155H
77 fps -4%
1920x1080 Ultra Preset (FSR off)
Average of class Gaming
  (6.76 - 144.7, n=81, last 2 years)
86.3 fps +25%
Alienware m16 R2
NVIDIA GeForce RTX 4070 Laptop GPU, Ultra 7 155H
83.1 (28.4min) fps +20%
Asus ProArt P16 H7606WI
NVIDIA GeForce RTX 4070 Laptop GPU, Ryzen AI 9 HX 370
80.7 (65.3min) fps +17%
Average NVIDIA GeForce RTX 4070 Laptop GPU
  (30.7 - 90.7, n=36)
79.1 fps +14%
Lenovo Yoga Pro 9 16IMH9
NVIDIA GeForce RTX 4070 Laptop GPU, Ultra 9 185H
76.9 (18min) fps +11%
Acer Predator Triton Neo 16 PTN16-51-978P
NVIDIA GeForce RTX 4070 Laptop GPU, Ultra 9 185H
69.1 (56min) fps
Asus ROG Zephyrus G16 2024 GU605M
NVIDIA GeForce RTX 4070 Laptop GPU, Ultra 7 155H
69 fps 0%
2560x1440 Ultra Preset (FSR off)
Average of class Gaming
  (24.8 - 110, n=72, last 2 years)
64.9 fps +53%
Alienware m16 R2
NVIDIA GeForce RTX 4070 Laptop GPU, Ultra 7 155H
52.7 (40.5min) fps +25%
Asus ProArt P16 H7606WI
NVIDIA GeForce RTX 4070 Laptop GPU, Ryzen AI 9 HX 370
49.4 (41.1min) fps +17%
Average NVIDIA GeForce RTX 4070 Laptop GPU
  (24.8 - 57.1, n=34)
49 fps +16%
Lenovo Yoga Pro 9 16IMH9
NVIDIA GeForce RTX 4070 Laptop GPU, Ultra 9 185H
47.8 (31.2min) fps +13%
Asus ROG Zephyrus G16 2024 GU605M
NVIDIA GeForce RTX 4070 Laptop GPU, Ultra 7 155H
43.7 fps +3%
Acer Predator Triton Neo 16 PTN16-51-978P
NVIDIA GeForce RTX 4070 Laptop GPU, Ultra 9 185H
42.3 (36min) fps

En contraste con el rendimiento de su CPU y SSD, la velocidad de la GPU del portátil parece permanecer bastante estable. Durante nuestra prueba de 30 minutos utilizando Cyberpunk 2077no medimos caídas notables de FPS o similares.

Cyberpunk 2077 ultra FPS diagram

051015202530354045505560657075Tooltip
Acer Predator Triton Neo 16 PTN16-51-978P Ultra 9 185H, NVIDIA GeForce RTX 4070 Laptop GPU: Ø65.8 (58.8-68.7)
Asus ProArt P16 H7606WI Ryzen AI 9 HX 370, NVIDIA GeForce RTX 4070 Laptop GPU: Ø60.7 (28.6-75.5)

Emisiones

Emisiones sonoras

Acer aún podría revisar el control de su ventilador. En el modo Rendimiento, el Neo 16 es a veces bastante perceptible incluso en ralentí (32 a 34 dB) y ocasionalmente tiende a acelerarse hacia los 40 dB(A). Sus homólogos suelen ser mucho más silenciosos. Notamos alrededor de 50 dB(A) bajo carga, lo que está muy presente y puede llegar a ser molesto sin auriculares. Sin embargo, los competidores alcanzan valores similares o incluso superiores en este escenario.

Ruido

Ocioso
32 / 34 / 40 dB(A)
Carga
48 / 51 dB(A)
  red to green bar
 
 
30 dB
silencioso
40 dB(A)
audible
50 dB(A)
ruidosamente alto
 
min: dark, med: mid, max: light   Earthworks M23R, Arta (15 cm de distancia)   environment noise: 24 dB(A)
dB(A) 0102030405060708090Deep BassMiddle BassHigh BassLower RangeMidsHigher MidsLower HighsMid HighsUpper HighsSuper Highs2046.73838.737.438.643.52541.634.837.937.136.439.93145.342.44239.841.1464029.831.628.627.227.929503643.335.735.736.534.46329.924.52422.723.731.68022.327.317.116.718.423.610020.921.615.616.113.823.912528.227.226.333.914.627.916028.726.622.126.116.327.220030.32721.621.42028.925029.225.219.920.915.828.931528.824.818.719.513.529.540032.125.422.422.511.634.450034.832.423.323.711.336.763036.531.124.525.110.739.380038.831.825.125.910.741.5100038.130.322.623.710.941.312503830.622.724.111.440.9160038.930.422.123.311.541.9200038.529.220.921.711.441.3250036.426.71919.41239.8315035.325.720.721.212.338.6400035.525.916.116.512.838.8500034.221.414.915.313.237.7630029.917.11414.213.335.2800024.414.413.813.613.529.61000021.113.513.413.213.226.51250017.412.814.814.812.722.41600014.512.813.213.51216.8SPL48.140.132.833.724.551.2N63.21.71.90.67.5median 32.1median 25.9median 20.7median 21.2median 12.7median 35.2Delta5.56.33.74.11.56.3hearing rangehide median Fan NoiseAcer Predator Triton Neo 16 PTN16-51-978P
Acer Predator Triton Neo 16 PTN16-51-978P
Ultra 9 185H, NVIDIA GeForce RTX 4070 Laptop GPU
Asus ProArt P16 H7606WI
Ryzen AI 9 HX 370, NVIDIA GeForce RTX 4070 Laptop GPU
Lenovo Yoga Pro 9 16IMH9
Ultra 9 185H, NVIDIA GeForce RTX 4070 Laptop GPU
Asus ROG Zephyrus G16 2024 GU605M
Ultra 7 155H, NVIDIA GeForce RTX 4070 Laptop GPU
Alienware m16 R2
Ultra 7 155H, NVIDIA GeForce RTX 4070 Laptop GPU
Noise
9%
14%
18%
16%
off / environment *
24
24.4
-2%
24.3
-1%
23.9
-0%
24.7
-3%
Idle Minimum *
32
24.4
24%
24.3
24%
23.9
25%
25.3
21%
Idle Average *
34
27.7
19%
24.3
29%
27.8
18%
25.3
26%
Idle Maximum *
40
32.3
19%
25.8
35%
30.1
25%
25.3
37%
Load Average *
48
42.2
12%
48.1
-0%
34.2
29%
31.7
34%
Cyberpunk 2077 ultra *
50
53.2
-6%
Load Maximum *
51
53.2
-4%
53.9
-6%
46.4
9%
62
-22%
Witcher 3 ultra *
49.7
46.4
53.8

* ... más pequeño es mejor

Temperatura

En lo que respecta a las temperaturas, el vástago de Acer no desentona en absoluto. Un máximo de 46 °C en la parte superior y un máximo de 48 °C en la parte inferior son típicos para un dispositivo RTX 4070. En modo inactivo, la carcasa se mantiene por debajo de la marca de los 30 °C y, por tanto, permanece agradable y fresca.

 45 °C46 °C45 °C 
 45 °C45 °C42 °C 
 34 °C33 °C32 °C 
Máximo: 46 °C
Médio: 40.8 °C
47 °C48 °C43 °C
42 °C44 °C39 °C
34 °C34 °C34 °C
Máximo: 48 °C
Médio: 40.6 °C
Conector de corriente  43 °C | Temperatura del cuarto 21 °C | Fluke t3000FC (calibrated), Voltcraft IR-900
(-) The average temperature for the upper side under maximal load is 40.8 °C / 105 F, compared to the average of 33.9 °C / 93 F for the devices in the class Gaming.
(-) The maximum temperature on the upper side is 46 °C / 115 F, compared to the average of 40.5 °C / 105 F, ranging from 21.2 to 68.8 °C for the class Gaming.
(-) The bottom heats up to a maximum of 48 °C / 118 F, compared to the average of 43.2 °C / 110 F
(+) In idle usage, the average temperature for the upper side is 25.8 °C / 78 F, compared to the device average of 33.9 °C / 93 F.
(-) 3: The average temperature for the upper side is 39.3 °C / 103 F, compared to the average of 33.9 °C / 93 F for the class Gaming.
(+) The palmrests and touchpad are reaching skin temperature as a maximum (34 °C / 93.2 F) and are therefore not hot.
(-) The average temperature of the palmrest area of similar devices was 28.9 °C / 84 F (-5.1 °C / -9.2 F).
Acer Predator Triton Neo 16 PTN16-51-978P
Ultra 9 185H, NVIDIA GeForce RTX 4070 Laptop GPU
Asus ProArt P16 H7606WI
Ryzen AI 9 HX 370, NVIDIA GeForce RTX 4070 Laptop GPU
Lenovo Yoga Pro 9 16IMH9
Ultra 9 185H, NVIDIA GeForce RTX 4070 Laptop GPU
Asus ROG Zephyrus G16 2024 GU605M
Ultra 7 155H, NVIDIA GeForce RTX 4070 Laptop GPU
Alienware m16 R2
Ultra 7 155H, NVIDIA GeForce RTX 4070 Laptop GPU
Heat
-5%
6%
-5%
-20%
Maximum Upper Side *
46
46.9
-2%
41.7
9%
50.3
-9%
44.8
3%
Maximum Bottom *
48
50.9
-6%
46.3
4%
48
-0%
48
-0%
Idle Upper Side *
27
28.9
-7%
26.2
3%
28.8
-7%
37.2
-38%
Idle Bottom *
29
30
-3%
27.2
6%
29.8
-3%
42
-45%

* ... más pequeño es mejor

Prueba de esfuerzo

Tanto en la prueba de estrés con las herramientas Furmark y Prime95 como al ejecutar Cyberpunk 2077, la CPU y la GPU se calentaron hasta unos 70 °C, lo que puede clasificarse como un nivel moderado.

Furmark y Prime95
Furmark y Prime95
Furmark y Prime95
Furmark y Prime95
Furmark y Prime95
Furmark y Prime95
Cyberpunk 2077
Cyberpunk 2077
Cyberpunk 2077
Cyberpunk 2077
Cyberpunk 2077
Cyberpunk 2077

Altavoces

La calidad del sonido del portátil está en la gama media. Además de los graves, a los medios y agudos les vendría bien ser más potentes y precisos. Por otro lado, los altavoces del dispositivo de 16 pulgadas presumen de un buen volumen máximo de 86 dB(A).

dB(A) 0102030405060708090Deep BassMiddle BassHigh BassLower RangeMidsHigher MidsLower HighsMid HighsUpper HighsSuper Highs2038.637.82536.434.83141.141.44027.927.45036.5366323.7268018.41910013.825.912514.642.116016.3462002051.125015.853.331513.555.440011.658.950011.362.263010.763.780010.768.4100010.973.4125011.474.6160011.577.1200011.475.325001268.5315012.366.3400012.876.4500013.275.4630013.378.7800013.574.21000013.2741250012.768.8160001267.8SPL24.586.2N0.664.9median 12.7median 68.4Delta1.59.635.641.331.233.642.933.838.540.426.435.225.539.728.148.120.960.820.265.217.961.719.46820.368.616.568.91471.111.771.711.174.410.974.410.571.910.77110.7691168.711.466.511.768.112.167.312.26412.563.612.365.212.460.812.259.411.65124.481.40.655.7median 12.2median 682.94hearing rangehide median Pink NoiseAcer Predator Triton Neo 16 PTN16-51-978PAsus ProArt P16 H7606WI
Diagrama de frecuencia en comparación (¡las casillas de verificación se pueden marcar y desmarcar!)
Acer Predator Triton Neo 16 PTN16-51-978P audio analysis

(+) | speakers can play relatively loud (86 dB)
Bass 100 - 315 Hz
(-) | nearly no bass - on average 22.7% lower than median
(±) | linearity of bass is average (10.9% delta to prev. frequency)
Mids 400 - 2000 Hz
(±) | higher mids - on average 5.9% higher than median
(+) | mids are linear (5.3% delta to prev. frequency)
Highs 2 - 16 kHz
(±) | higher highs - on average 5.6% higher than median
(±) | linearity of highs is average (7.2% delta to prev. frequency)
Overall 100 - 16.000 Hz
(±) | linearity of overall sound is average (17.6% difference to median)
Compared to same class
» 48% of all tested devices in this class were better, 12% similar, 41% worse
» The best had a delta of 6%, average was 18%, worst was 132%
Compared to all devices tested
» 31% of all tested devices were better, 8% similar, 61% worse
» The best had a delta of 4%, average was 25%, worst was 134%

Asus ProArt P16 H7606WI audio analysis

(±) | speaker loudness is average but good (81.4 dB)
Bass 100 - 315 Hz
(+) | good bass - only 3% away from median
(±) | linearity of bass is average (8.3% delta to prev. frequency)
Mids 400 - 2000 Hz
(+) | balanced mids - only 3.5% away from median
(+) | mids are linear (2.5% delta to prev. frequency)
Highs 2 - 16 kHz
(+) | balanced highs - only 3% away from median
(+) | highs are linear (3.6% delta to prev. frequency)
Overall 100 - 16.000 Hz
(+) | overall sound is linear (8.5% difference to median)
Compared to same class
» 6% of all tested devices in this class were better, 2% similar, 91% worse
» The best had a delta of 5%, average was 18%, worst was 45%
Compared to all devices tested
» 2% of all tested devices were better, 1% similar, 98% worse
» The best had a delta of 4%, average was 25%, worst was 134%

Gestión de la energía

Consumo de energía

Gracias a su conmutación de gráficos integrada, el Predator Triton es razonablemente frugal en reposo: medimos entre 10 y 23 vatios, muy por debajo de la media de los juegos. Bajo carga, el portátil Acer consume entre 80 y 206 vatios, lo que significa que la fuente de alimentación de 230 vatios no se sobrecarga en ningún momento.

Consumo de corriente
Off / Standbydarklight 0.1 / 0.4 Watt
Ociosodarkmidlight 10 / 15 / 23 Watt
Carga midlight 80 / 206 Watt
 color bar
Clave: min: dark, med: mid, max: light        Metrahit Energy
Acer Predator Triton Neo 16 PTN16-51-978P
Ultra 9 185H, NVIDIA GeForce RTX 4070 Laptop GPU
Asus ProArt P16 H7606WI
Ryzen AI 9 HX 370, NVIDIA GeForce RTX 4070 Laptop GPU
Lenovo Yoga Pro 9 16IMH9
Ultra 9 185H, NVIDIA GeForce RTX 4070 Laptop GPU
Asus ROG Zephyrus G16 2024 GU605M
Ultra 7 155H, NVIDIA GeForce RTX 4070 Laptop GPU
Alienware m16 R2
Ultra 7 155H, NVIDIA GeForce RTX 4070 Laptop GPU
Average of class Gaming
 
Power Consumption
6%
-10%
21%
-13%
-27%
Idle Minimum *
10
8
20%
10.3
-3%
8.3
17%
8.1
19%
Idle Average *
15
9.9
34%
21.9
-46%
12.5
17%
13
13%
Idle Maximum *
23
11.6
50%
22.4
3%
12.8
44%
40.3
-75%
Load Average *
80
76.9
4%
96.9
-21%
71.3
11%
79
1%
Cyberpunk 2077 ultra *
122
157.7
-29%
Cyberpunk 2077 ultra external monitor *
118.7
156.6
-32%
Load Maximum *
206
212.6
-3%
173.8
16%
169.1
18%
254.9
-24%
Witcher 3 ultra *
159.6
127.5
188.1

* ... más pequeño es mejor

Power consumption Cyberpunk / stress test

0153045607590105120135150165180195Tooltip
Acer Predator Triton Neo 16 PTN16-51-978P; 1280x720 Prime95 28.10 and Furmark 1.25: Ø134.8 (117.1-206)
Acer Predator Triton Neo 16 PTN16-51-978P; Idle 150cd/m2: Ø15 (9.95-22.4)
Acer Predator Triton Neo 16 PTN16-51-978P; Cyberpunk 2077 FHD ultra no FSR 150cd: Ø122 (114.8-132.3)

Power consumption with external monitor

0102030405060708090100110120Tooltip
Acer Predator Triton Neo 16 PTN16-51-978P; Prime95 V2810 Stress (external Monitor): Ø75 (56.1-126)
Acer Predator Triton Neo 16 PTN16-51-978P; Cinebench R23 Multi (external Monitor): Ø121.1 (119.5-122.3)
Acer Predator Triton Neo 16 PTN16-51-978P; 1280x720 FurMark 1.19 GPU Stress Test (external Monitor): Ø109.1 (104-129.4)
Acer Predator Triton Neo 16 PTN16-51-978P; Idle 1min (external Monitor): Ø15.7 (8.37-23)
Acer Predator Triton Neo 16 PTN16-51-978P; Cyberpunk 2077 FHD ultra no FSR (external Monitor): Ø118.7 (111.6-124.9)

Tiempos de ejecución

Aunque sus homólogos cuentan con baterías ligeramente más grandes (de 84 a 90 Wh en lugar de 76 Wh), la duración de la batería del Neo 16 no tiene nada que ocultar. Alrededor de 7,5 horas de navegación por Internet sin cables con el brillo reducido a 150 cd/m² es un valor decente. En comparación: la competencia consigue entre 7 y 9 horas.

Tiempo de Ejecución de la Batería
WiFi Websurfing
7h 24min
Acer Predator Triton Neo 16 PTN16-51-978P
Ultra 9 185H, NVIDIA GeForce RTX 4070 Laptop GPU, 76 Wh
Asus ProArt P16 H7606WI
Ryzen AI 9 HX 370, NVIDIA GeForce RTX 4070 Laptop GPU, 90 Wh
Lenovo Yoga Pro 9 16IMH9
Ultra 9 185H, NVIDIA GeForce RTX 4070 Laptop GPU, 84 Wh
Asus ROG Zephyrus G16 2024 GU605M
Ultra 7 155H, NVIDIA GeForce RTX 4070 Laptop GPU, 90 Wh
Alienware m16 R2
Ultra 7 155H, NVIDIA GeForce RTX 4070 Laptop GPU, 90 Wh
Average of class Gaming
 
Duración de Batería
12%
18%
-2%
9%
-15%
WiFi v1.3
444
499
12%
526
18%
435
-2%
483
9%
H.264
1260
692
671
Load
116
73
71
60
Reader / Idle
758

Valoración total de Notebookcheck

No puede equivocarse mucho con el Predator Triton Neo 16, ya que el modelo de 16 pulgadas no adolece de ninguna debilidad evidente. Sin embargo, la competencia de otros fabricantes es dura y a veces toma la delantera.

Acer Predator Triton Neo 16 PTN16-51-978P - 12/31/2024 v8
Florian Glaser

Acabado
83 / 98 → 85%
Teclado
83%
Ratón
83%
Conectividad
66 / 80 → 83%
Peso
63 / 10-68 → 91%
Battería
76 / 95 → 80%
Pantalla
86%
Rendimiento de juegos
80%
Rendimiento de la Aplicación
86%
AI Performance
86%
Temperatura
86 / 95 → 90%
Ruido
58 / 90 → 65%
Audio
69%
Cámara
42 / 75 → 57%
Médio
64%
81%
Gaming - media ponderada
CO2 Emissions
No Data
Materials
50%
Packaging
50%
Power Use
84.5%
Repairability
50%
Software Updates
22.3%
Recycle Logo Total Sustainability Score: 42.8%

Transparency

The selection of devices to be reviewed is made by our editorial team. The test sample was provided to the author as a loan by the manufacturer or retailer for the purpose of this review. The lender had no influence on this review, nor did the manufacturer receive a copy of this review before publication. There was no obligation to publish this review. We never accept compensation or payment in return for our reviews. As an independent media company, Notebookcheck is not subjected to the authority of manufacturers, retailers or publishers.

This is how Notebookcheck is testing

Every year, Notebookcheck independently reviews hundreds of laptops and smartphones using standardized procedures to ensure that all results are comparable. We have continuously developed our test methods for around 20 years and set industry standards in the process. In our test labs, high-quality measuring equipment is utilized by experienced technicians and editors. These tests involve a multi-stage validation process. Our complex rating system is based on hundreds of well-founded measurements and benchmarks, which maintains objectivity. Further information on our test methods can be found here.

Please share our article, every link counts!
Mail Logo
> Análisis y pruebas de ordenadores portátiles y móviles teléfonos > Análisis > Análisis del Acer Predator Triton Neo 16: Un portátil premium con una RTX 4070 para jugadores y creadores
Florian Glaser, 2024-12-31 (Update: 2024-12-31)