

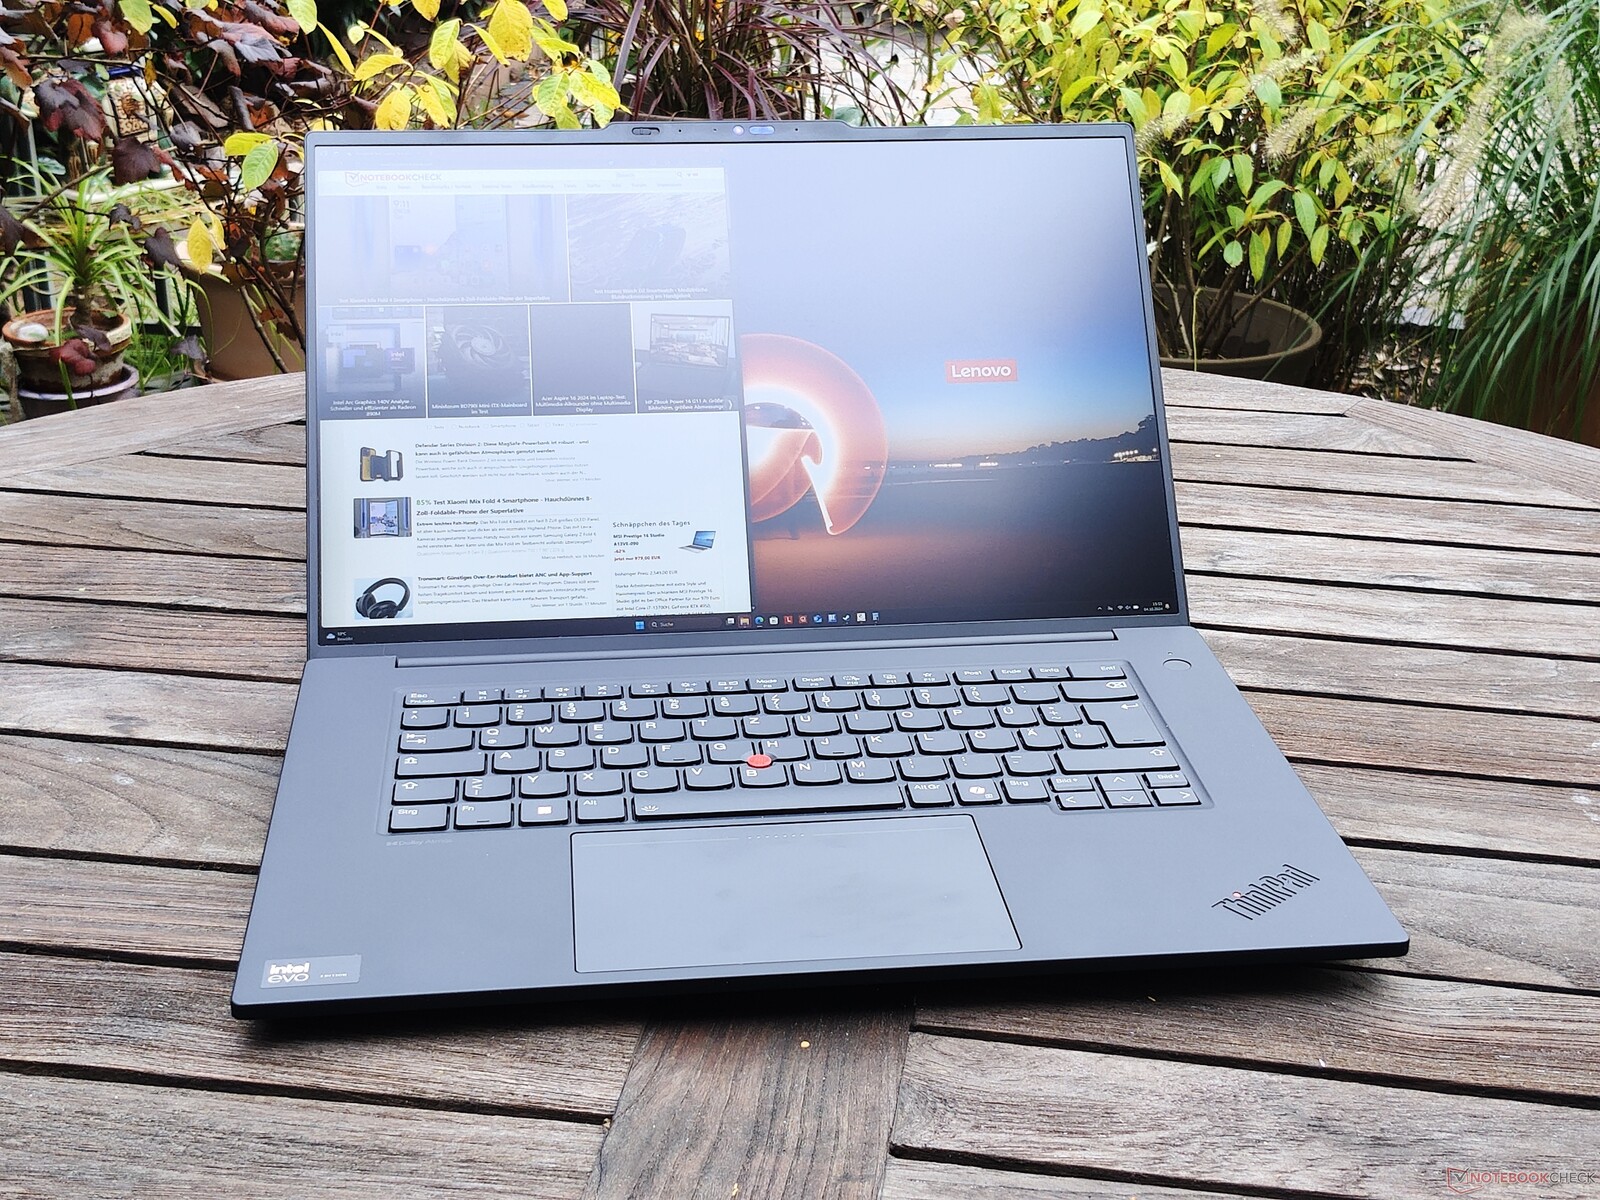
Análisis del Lenovo ThinkPad P1 Gen 7: Sin botones TrackPoint, con Nvidia GeForce RTX 4060
P1 con un toque de ThinkPad Z.
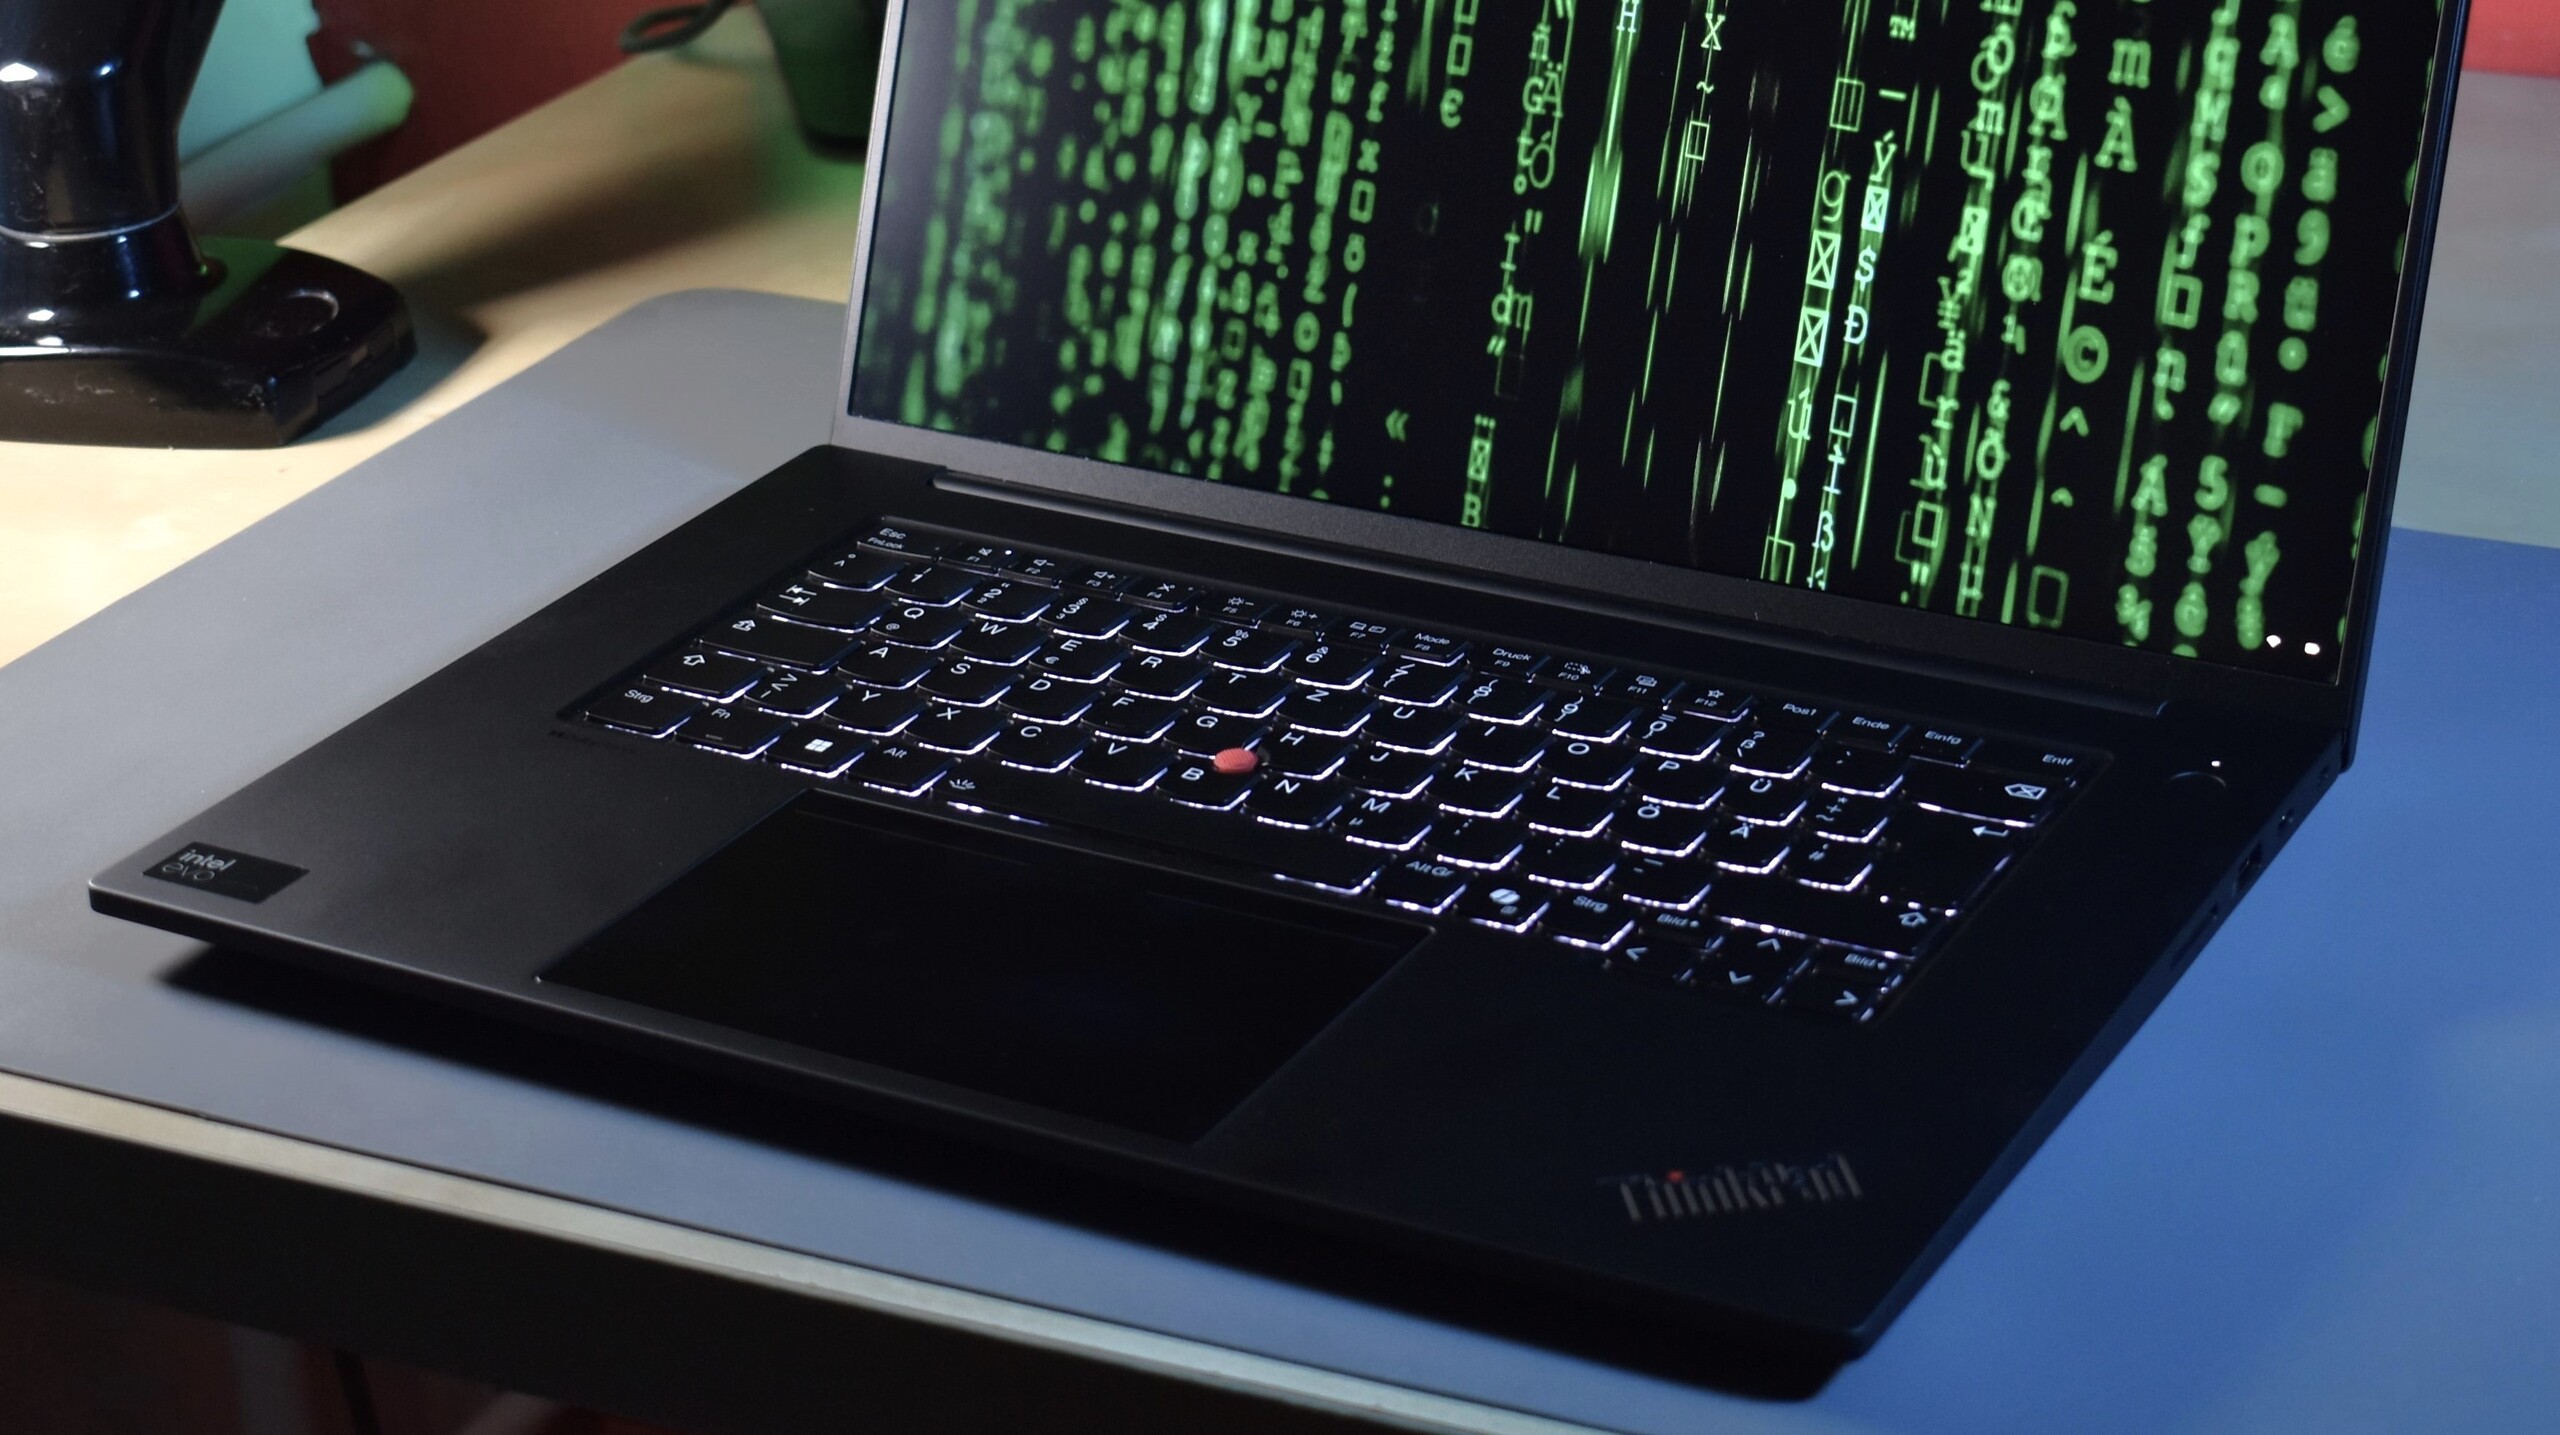
Para el nuevo Lenovo ThinkPad P1 Gen 7, el nuevo diseño es el principal atractivo. La estación de trabajo de gama alta es más premium, reparable y fácil de usar. En su núcleo se encuentra el nuevo touchpad háptico Sensel, que asume con éxito la función de los antiguos botones TrackPoint dedicados.Benjamin Herzig, 👁 Benjamin Herzig (traducido por DeepL / Ninh Duy) Publicado 🇺🇸 🇩🇪 ...
Veredicto: Diseño moderno, pero menos rendimiento de la GPU
La mayoría de las veces, los nuevos modelos de portátiles de una línea de PC preexistente son meras actualizaciones de su predecesor, sólo que con procesadores más nuevos. Este no es el caso del ThinkPad P1 Gen 7: Lenovo cambia su estación de trabajo premium a un nivel fundamental, desviando la atención del máximo rendimiento: las opciones de GPU de gama alta del predecesor ya no están disponibles. En su lugar, ahora hay dos ranuras para SSD M.2 2280 en cada variante del modelo, y el nuevo P1 G7 también adopta el nuevo e innovador tipo de memoria LPCAMM2.
En el exterior, hay muchas claves de diseño tomadas del ThinkPad Z16, especialmente con la tapa de aluminio y el gran trackpad háptico, que funciona muy bien. Junto con el bisel de pantalla más fino, el diseño parece más fresco y moderno, sin perder por completo el encanto del diseño ThinkPad. La nueva plataforma de CPU Meteor Lake no está a la altura de Raptor Lake en cuanto al rendimiento de un solo núcleo, pero la eficiencia y la duración de la batería han mejorado. En general, el Lenovo ThinkPad P1 Gen 7 es una transformación bien realizada hacia un diseño más premium con una movilidad mejorada en comparación con el predecesor. Para conseguir un conjunto más redondeado, Lenovo sacrifica algo de rendimiento de la GPU en la gama alta, pero eso probablemente esté bien para la mayoría de los usuarios.
Pro
Contra
Precios y disponibilidad
A través de nuestro proveedor de préstamos Campuspoint, puede comprar el Lenovo ThinkPad P1 Gen 7 probado por 3.359 euros en Alemania, con el precio para estudiantes en 2.859 euros. Amazon.com lista una versión del ThinkPad P1 Gen 7 por 2.548 dólares.
Price comparison
Posibles contendientes en la comparación
Imagen | Modelo | Precio | Peso | Altura | Pantalla |
|---|---|---|---|---|---|
1. 83.5%  | Lenovo ThinkPad P1 Gen 7 21KV001SGE Intel Core Ultra 7 155H ⎘ NVIDIA GeForce RTX 4060 Laptop GPU ⎘ 32 GB Memoría, 1024 GB SSD | 2 kg | 20.5 mm | 16.00" 2560x1600 189 PPI IPS LED | |
2. 90.1% v7 (old) 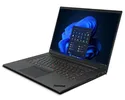 | Lenovo ThinkPad P1 G6 21FV001KUS Intel Core i7-13800H ⎘ NVIDIA GeForce RTX 4080 Laptop GPU ⎘ 32 GB Memoría, 1024 GB SSD | 1.9 kg | 17.5 mm | 16.00" 3480x2400 264 PPI OLED | |
3. 93.7% v7 (old) 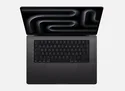 | Apple MacBook Pro 16 2023 M3 Pro Apple M3 Pro 12-Core ⎘ Apple M3 Pro 18-Core GPU ⎘ 18 GB Memoría, 512 GB SSD | 2.1 kg | 16.9 mm | 16.20" 3456x2234 254 PPI Mini-LED | |
4. 88.6% v7 (old) 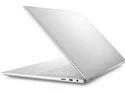 | Dell XPS 16 9640 Intel Core Ultra 7 155H ⎘ NVIDIA GeForce RTX 4070 Laptop GPU ⎘ 32 GB Memoría, 1024 GB SSD | 2.3 kg | 18.7 mm | 16.30" 3840x2400 139 PPI OLED | |
5. 88.3% v7 (old)  | Dell Precision 5690 Intel Core Ultra 9 185H ⎘ Nvidia RTX 5000 Ada Generation Laptop GPU ⎘ 32 GB Memoría, 2048 GB SSD | 2.3 kg | 22.17 mm | 16.00" 3840x2400 283 PPI OLED |
Índice
- Veredicto: Diseño moderno, pero menos rendimiento de la GPU
- Specifications: Core Ultra 7 155H meets GeForce RTX 4060
- Chasis: Aluminio en lugar de fibra de carbono para el ThinkPad P1
- Conectividad: Lenovo sustituye SO-DIMM por LPCAMM2
- Dispositivos de entrada: Botones TrackPoint integrados bien realizados por primera vez
- Pantalla: Pantalla rápida de 165 Hz
- Rendimiento: Meteor Lake sustituye a Raptor Lake
- Emisiones: El reposamanos del portátil Lenovo se mantiene fresco
- Gestión de la energía: Mejor duración de la batería que el ThinkPad P1 Gen 6
- Valoración general de Notebookcheck
En el año 2018, Lenovo lanzó una serie ThinkPad completamente nueva: El ThinkPad P1una delgada estación de trabajo premium, así como el ThinkPad X1 Extreme, su homólogo multimedia. La línea X1 Extreme ha muerto entretanto, pero el ThinkPad P1 sigue existiendo. Con la ThinkPad P1 Gen 7, ya tenemos siete generaciones de este dispositivo de gama alta. Esta última versión presenta muchas novedades, ya que Lenovo ha reelaborado el diseño casi por completo, sólo por segunda vez en la historia de la serie. Junto con las CPU Intel Meteor Lake H, se trata de una mezcla muy interesante, que Lenovo contrapone al Apple MacBook Pro 16, Dell XPS 16 o el HP ZBook Studio.
Specifications: Core Ultra 7 155H meets GeForce RTX 4060
Chasis: Aluminio en lugar de fibra de carbono para el ThinkPad P1
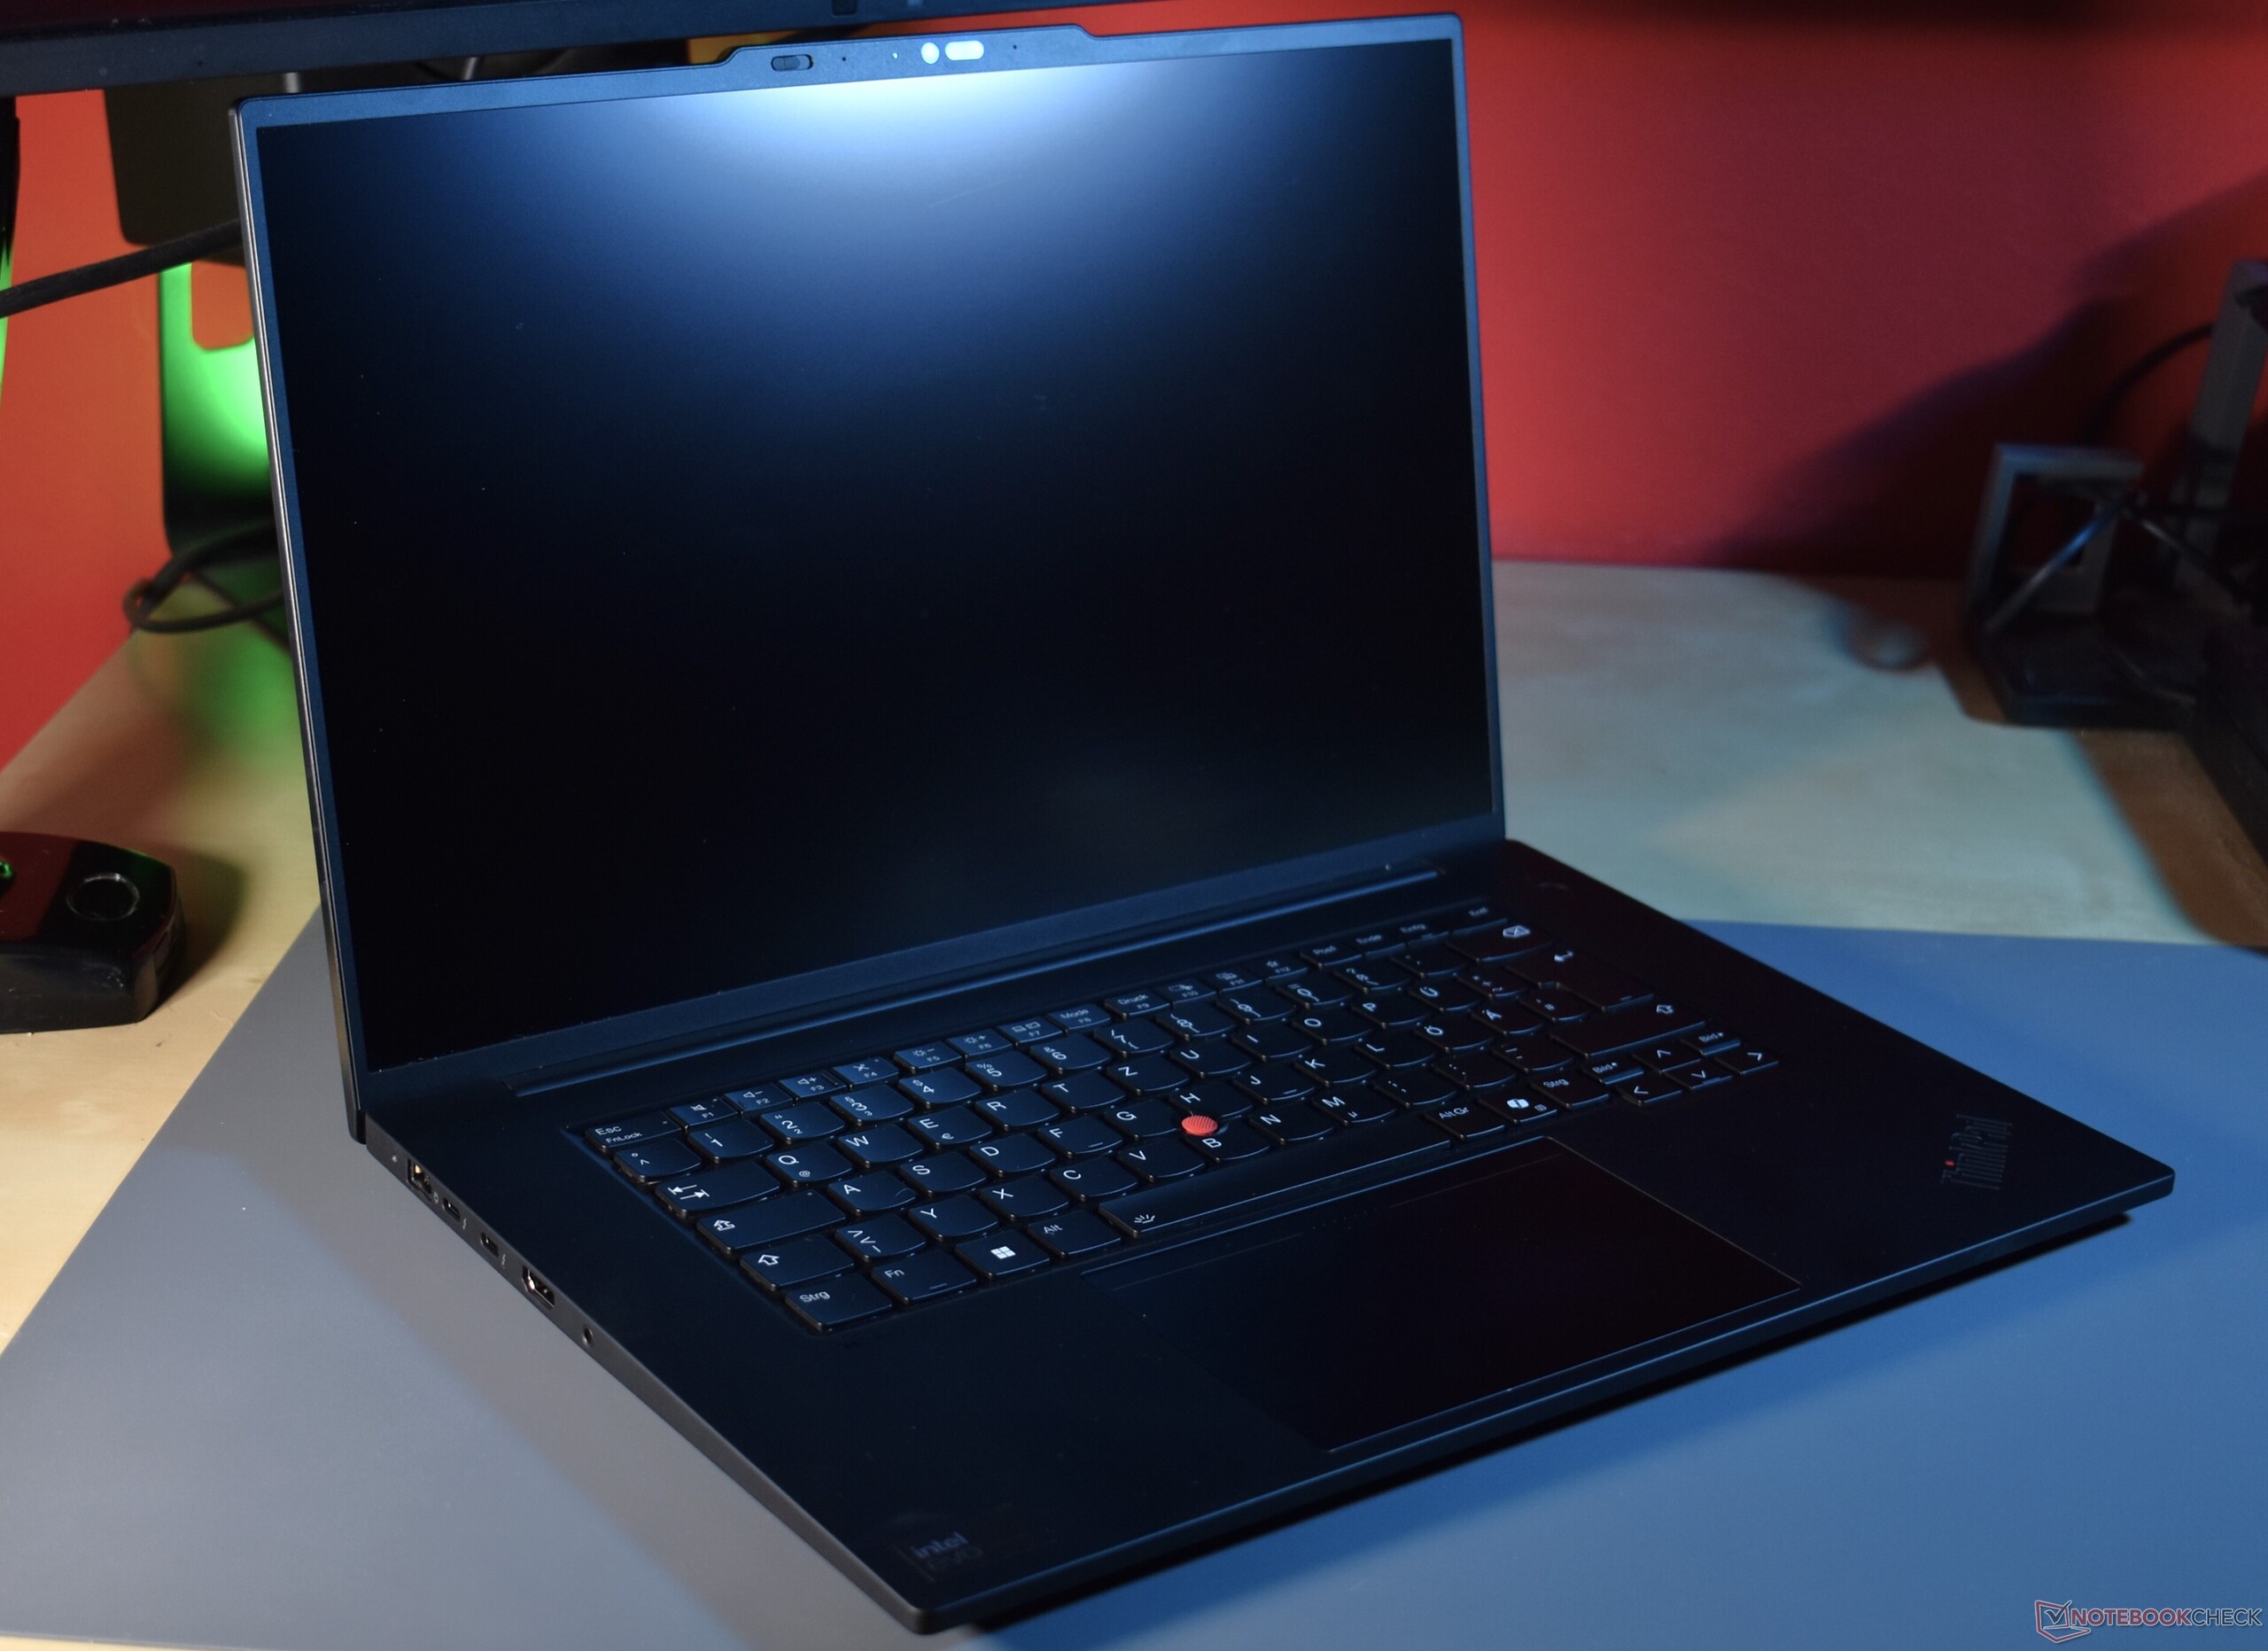
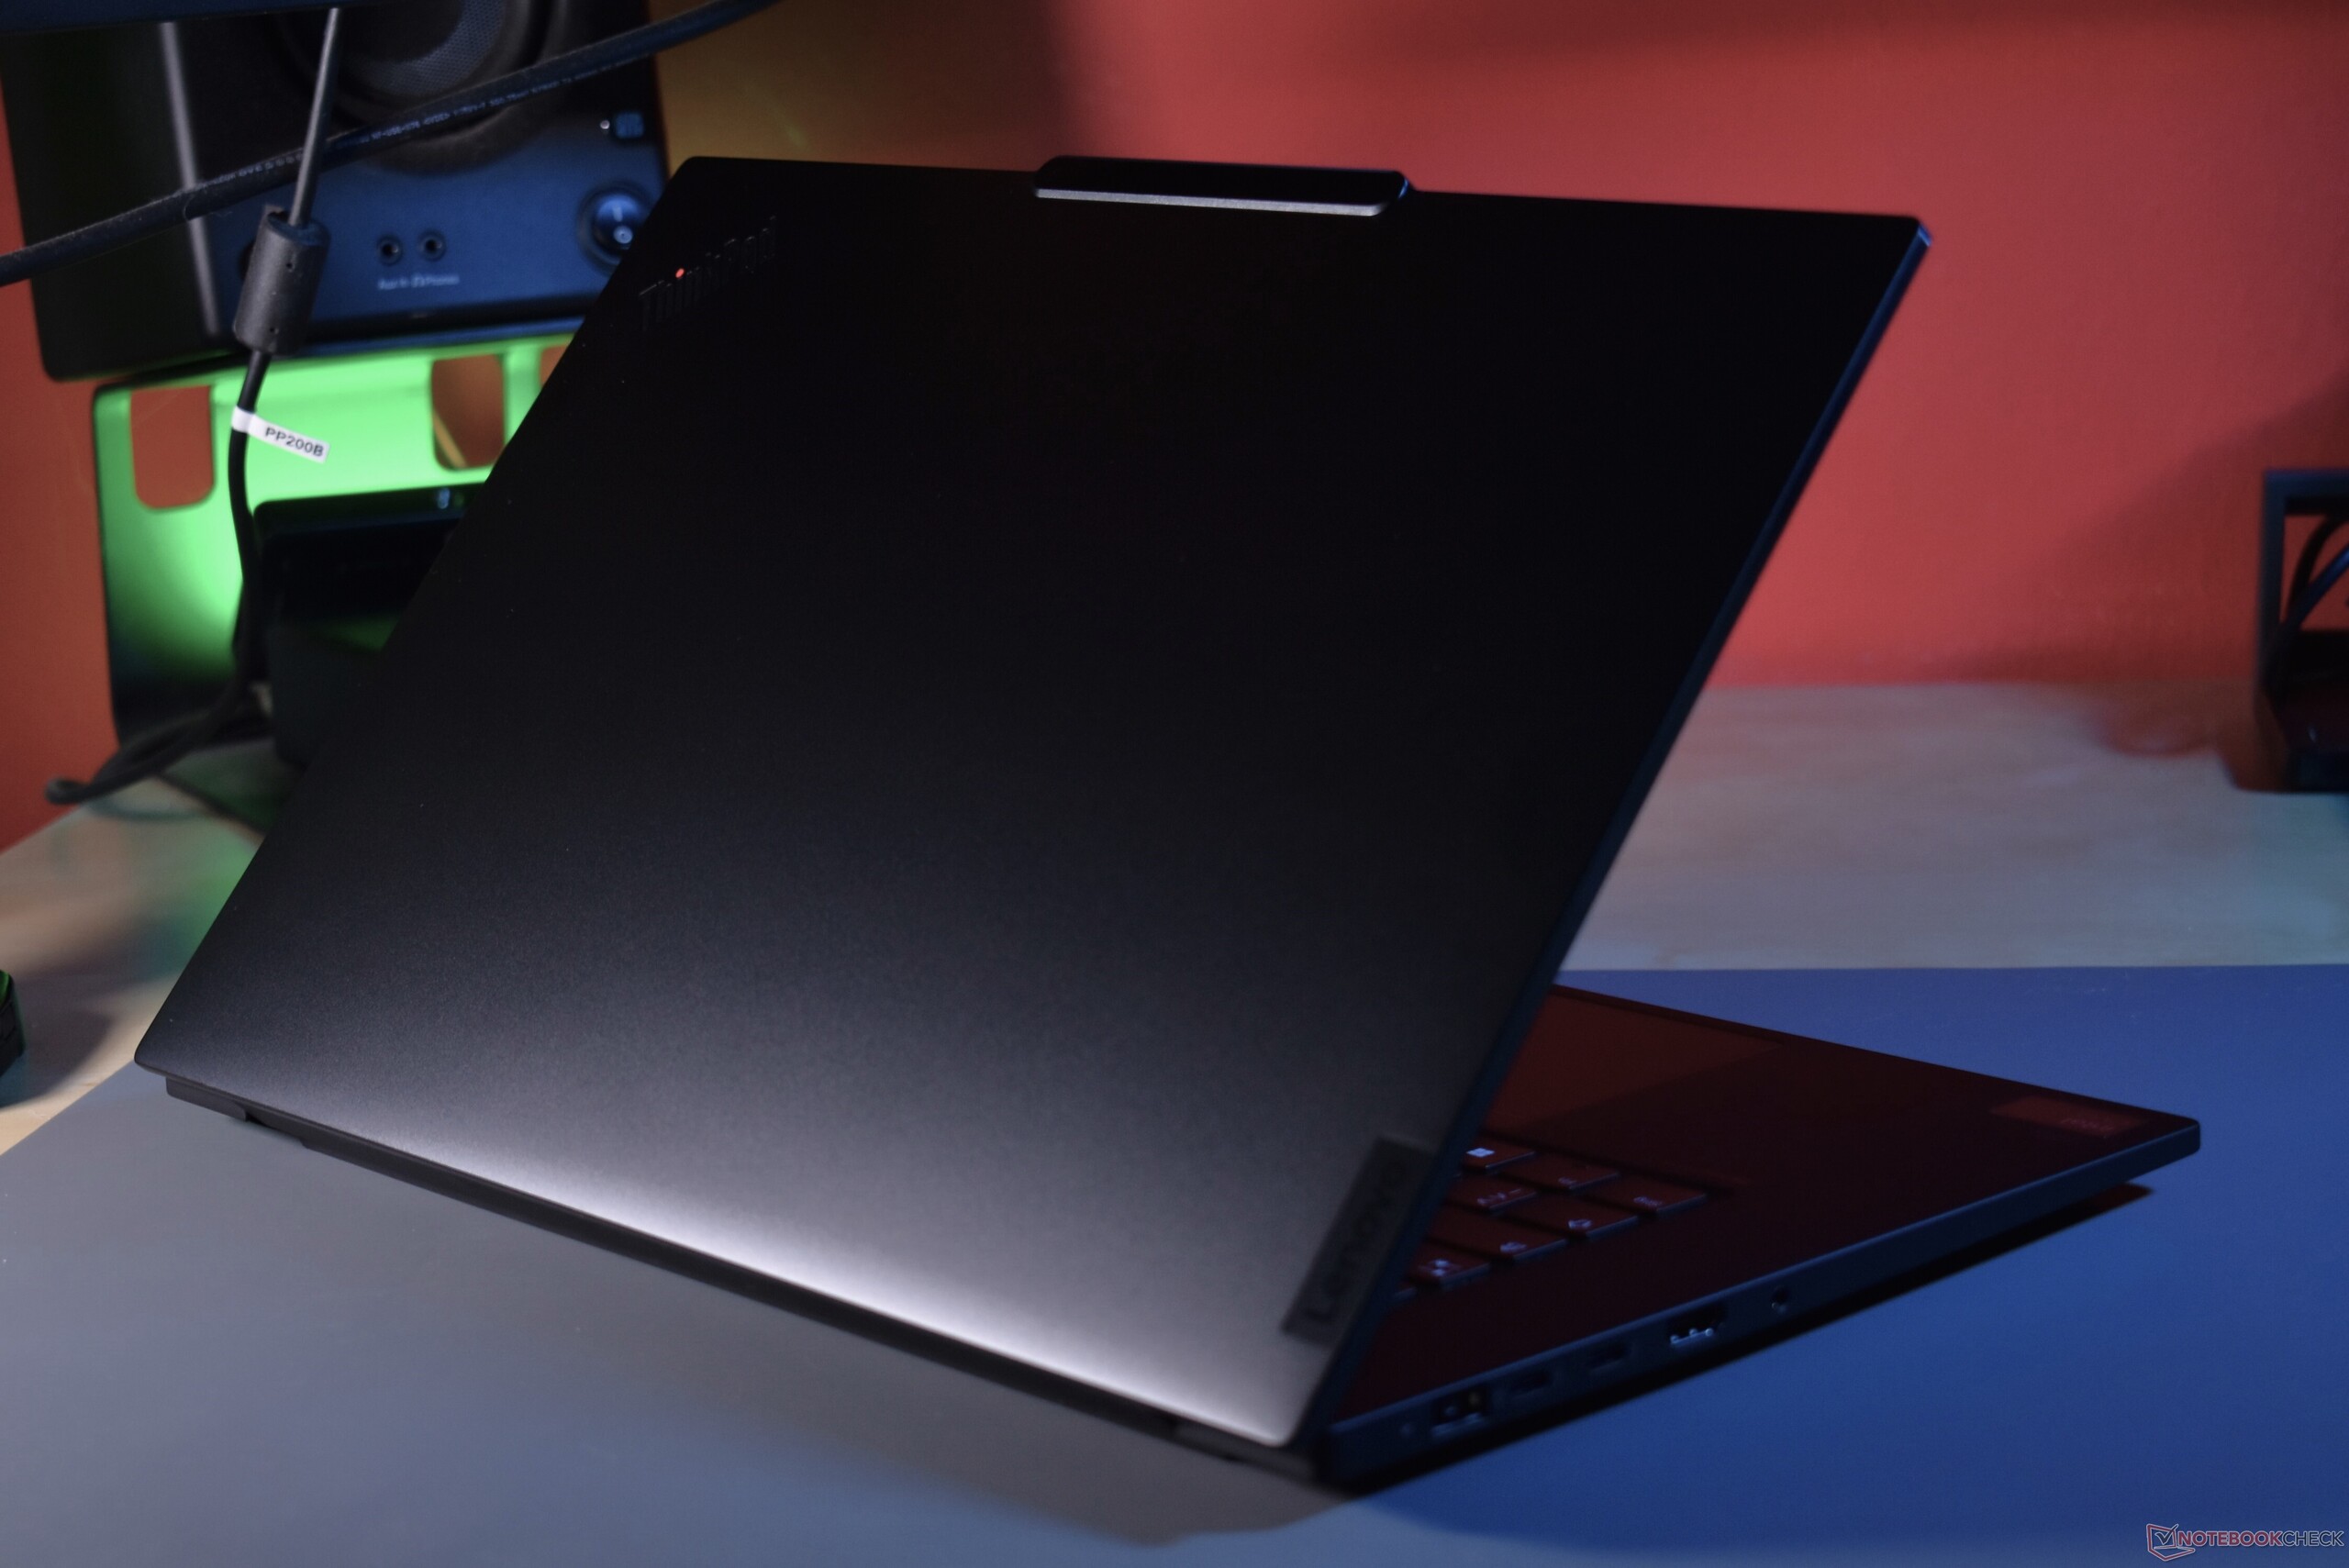
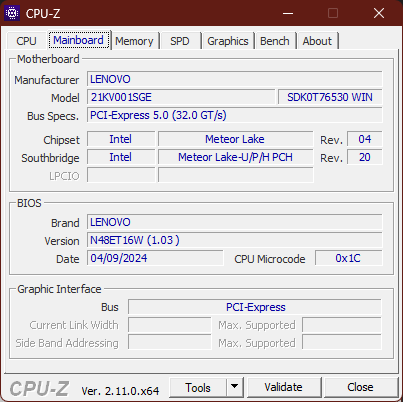
Desde el principio, el Lenovo ThinkPad P1 era básicamente un ThinkPad X1 Carbon más grande. Utilizaba la misma construcción y los mismos materiales que el Ultrabook más pequeño, solo que un poco más grueso y en el formato más grande de 15,6 o 16 pulgadas (ya que el Lenovo ThinkPad P1 Gen 4). Con el ThinkPad P1 Gen 7, Lenovo rompe con esta regla, al menos un poco. En lugar de la clásica cubierta superior de goma hecha de fibra de carbono, Lenovo ha utilizado ahora aluminio anodizado negro con laterales cortados con diamante. Otros cambios en el diseño se han adaptado del ThinkPad X1 Carbon G12como la protuberancia de la cámara. Muy diferente de antes es también el nuevo panel táctil háptico, que integra los botones TrackPoint - más sobre esto en la sección de dispositivos de entrada, pero en general, podemos decir que el ThinkPad P1 ahora se parece mucho más al ThinkPad Z16 que antes. Un componente de ello es el bisel de la pantalla mucho más fino. La relación pantalla/cuerpo aumenta del 81 al 87 por ciento.
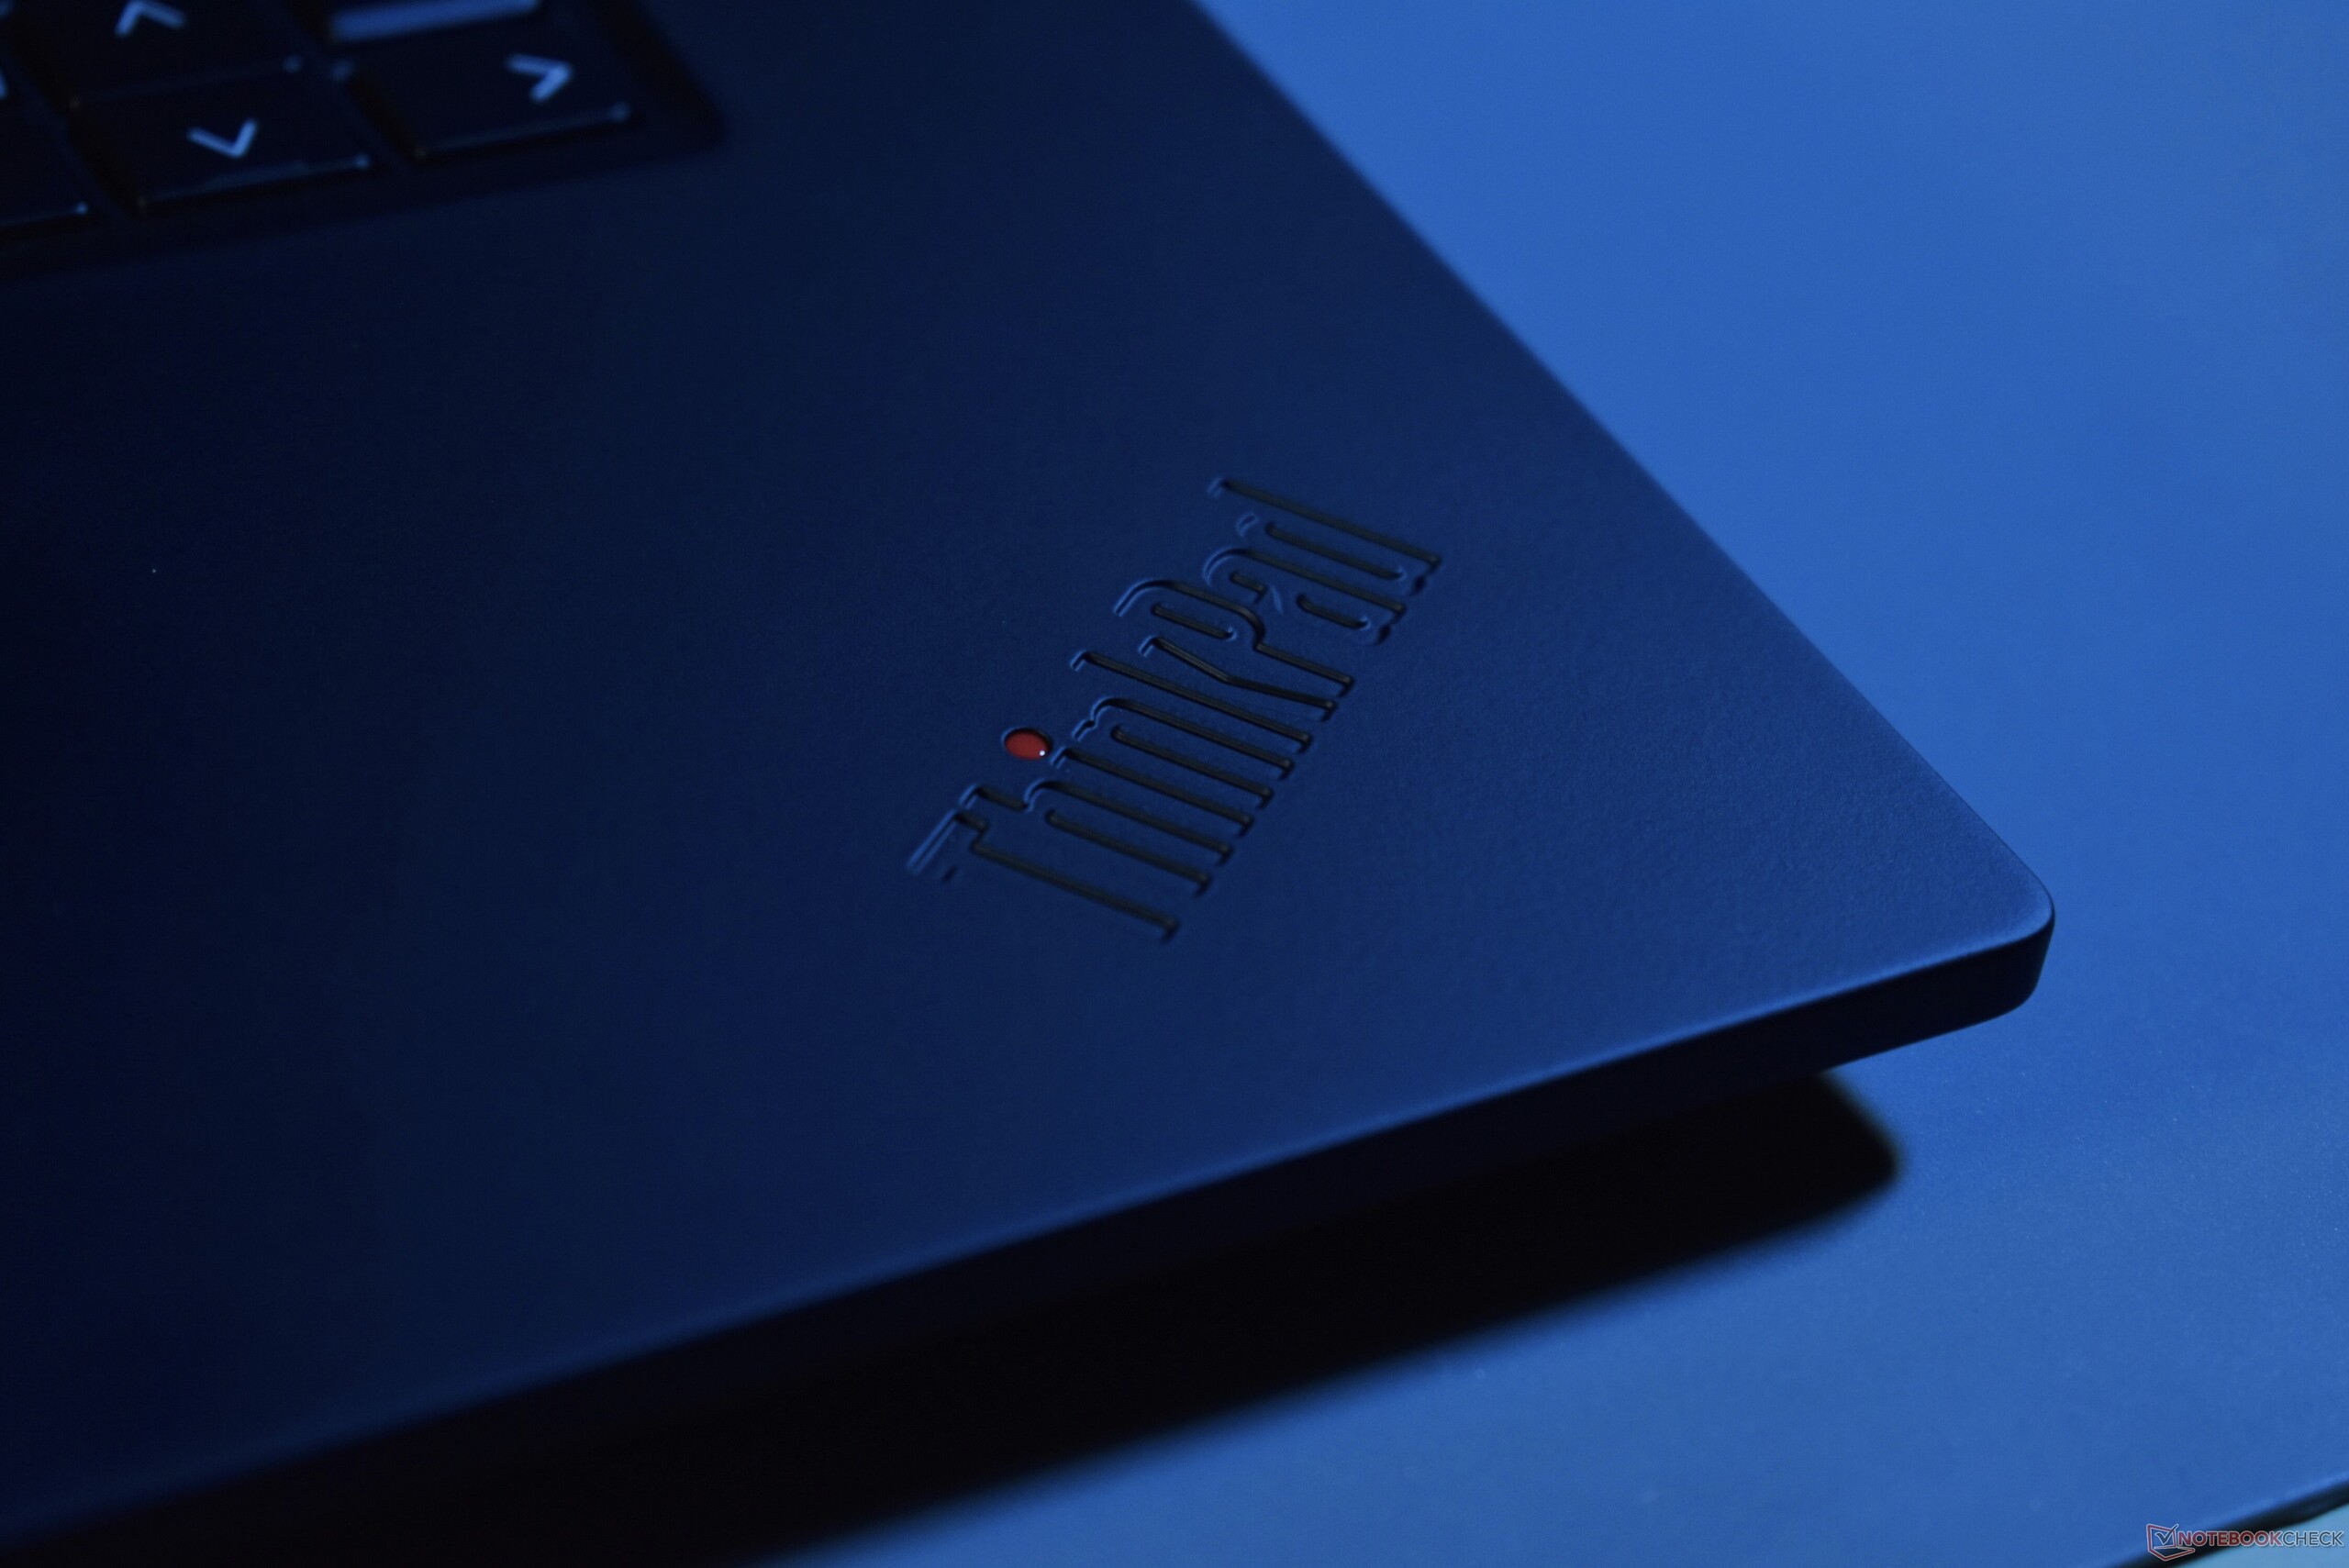
En términos de calidad, el rediseño está un nivel por encima del modelo anterior, lo que se debe a que la cubierta de aluminio de la pantalla ofrece más rigidez. El portátil ThinkPad no se abolla por ningún lado y apenas se flexiona. La mano de obra es, como se espera de un modelo tan premium, impecable. Pequeño inconveniente: La propensión a las manchas del ThinkPad de color negro sigue presente, tanto en la unidad base de goma como en la cubierta metálica de la pantalla.
La pantalla puede abrirse hasta 180 grados. Dispuestas como una barra ancha de una sola pieza, las dos bisagras son lo suficientemente suaves como para permitir la apertura con una sola mano y lo suficientemente rígidas como para evitar que la pantalla se tambalee. Al abrir la tapa, la protuberancia de la cámara se convierte en un útil asidero.

El peso sube ligeramente, pero la huella X/Y se reduce. El mayor peso se debe al material de aluminio más denso de la tapa. Por otro lado, la P1 Gen 7 es notablemente más compacta que la P1 Gen 6, gracias al bisel más fino de la pantalla. Todos los competidores son más pesados. En el caso del Dell XPS 16la diferencia es sustancial.
Conectividad: Lenovo sustituye SO-DIMM por LPCAMM2
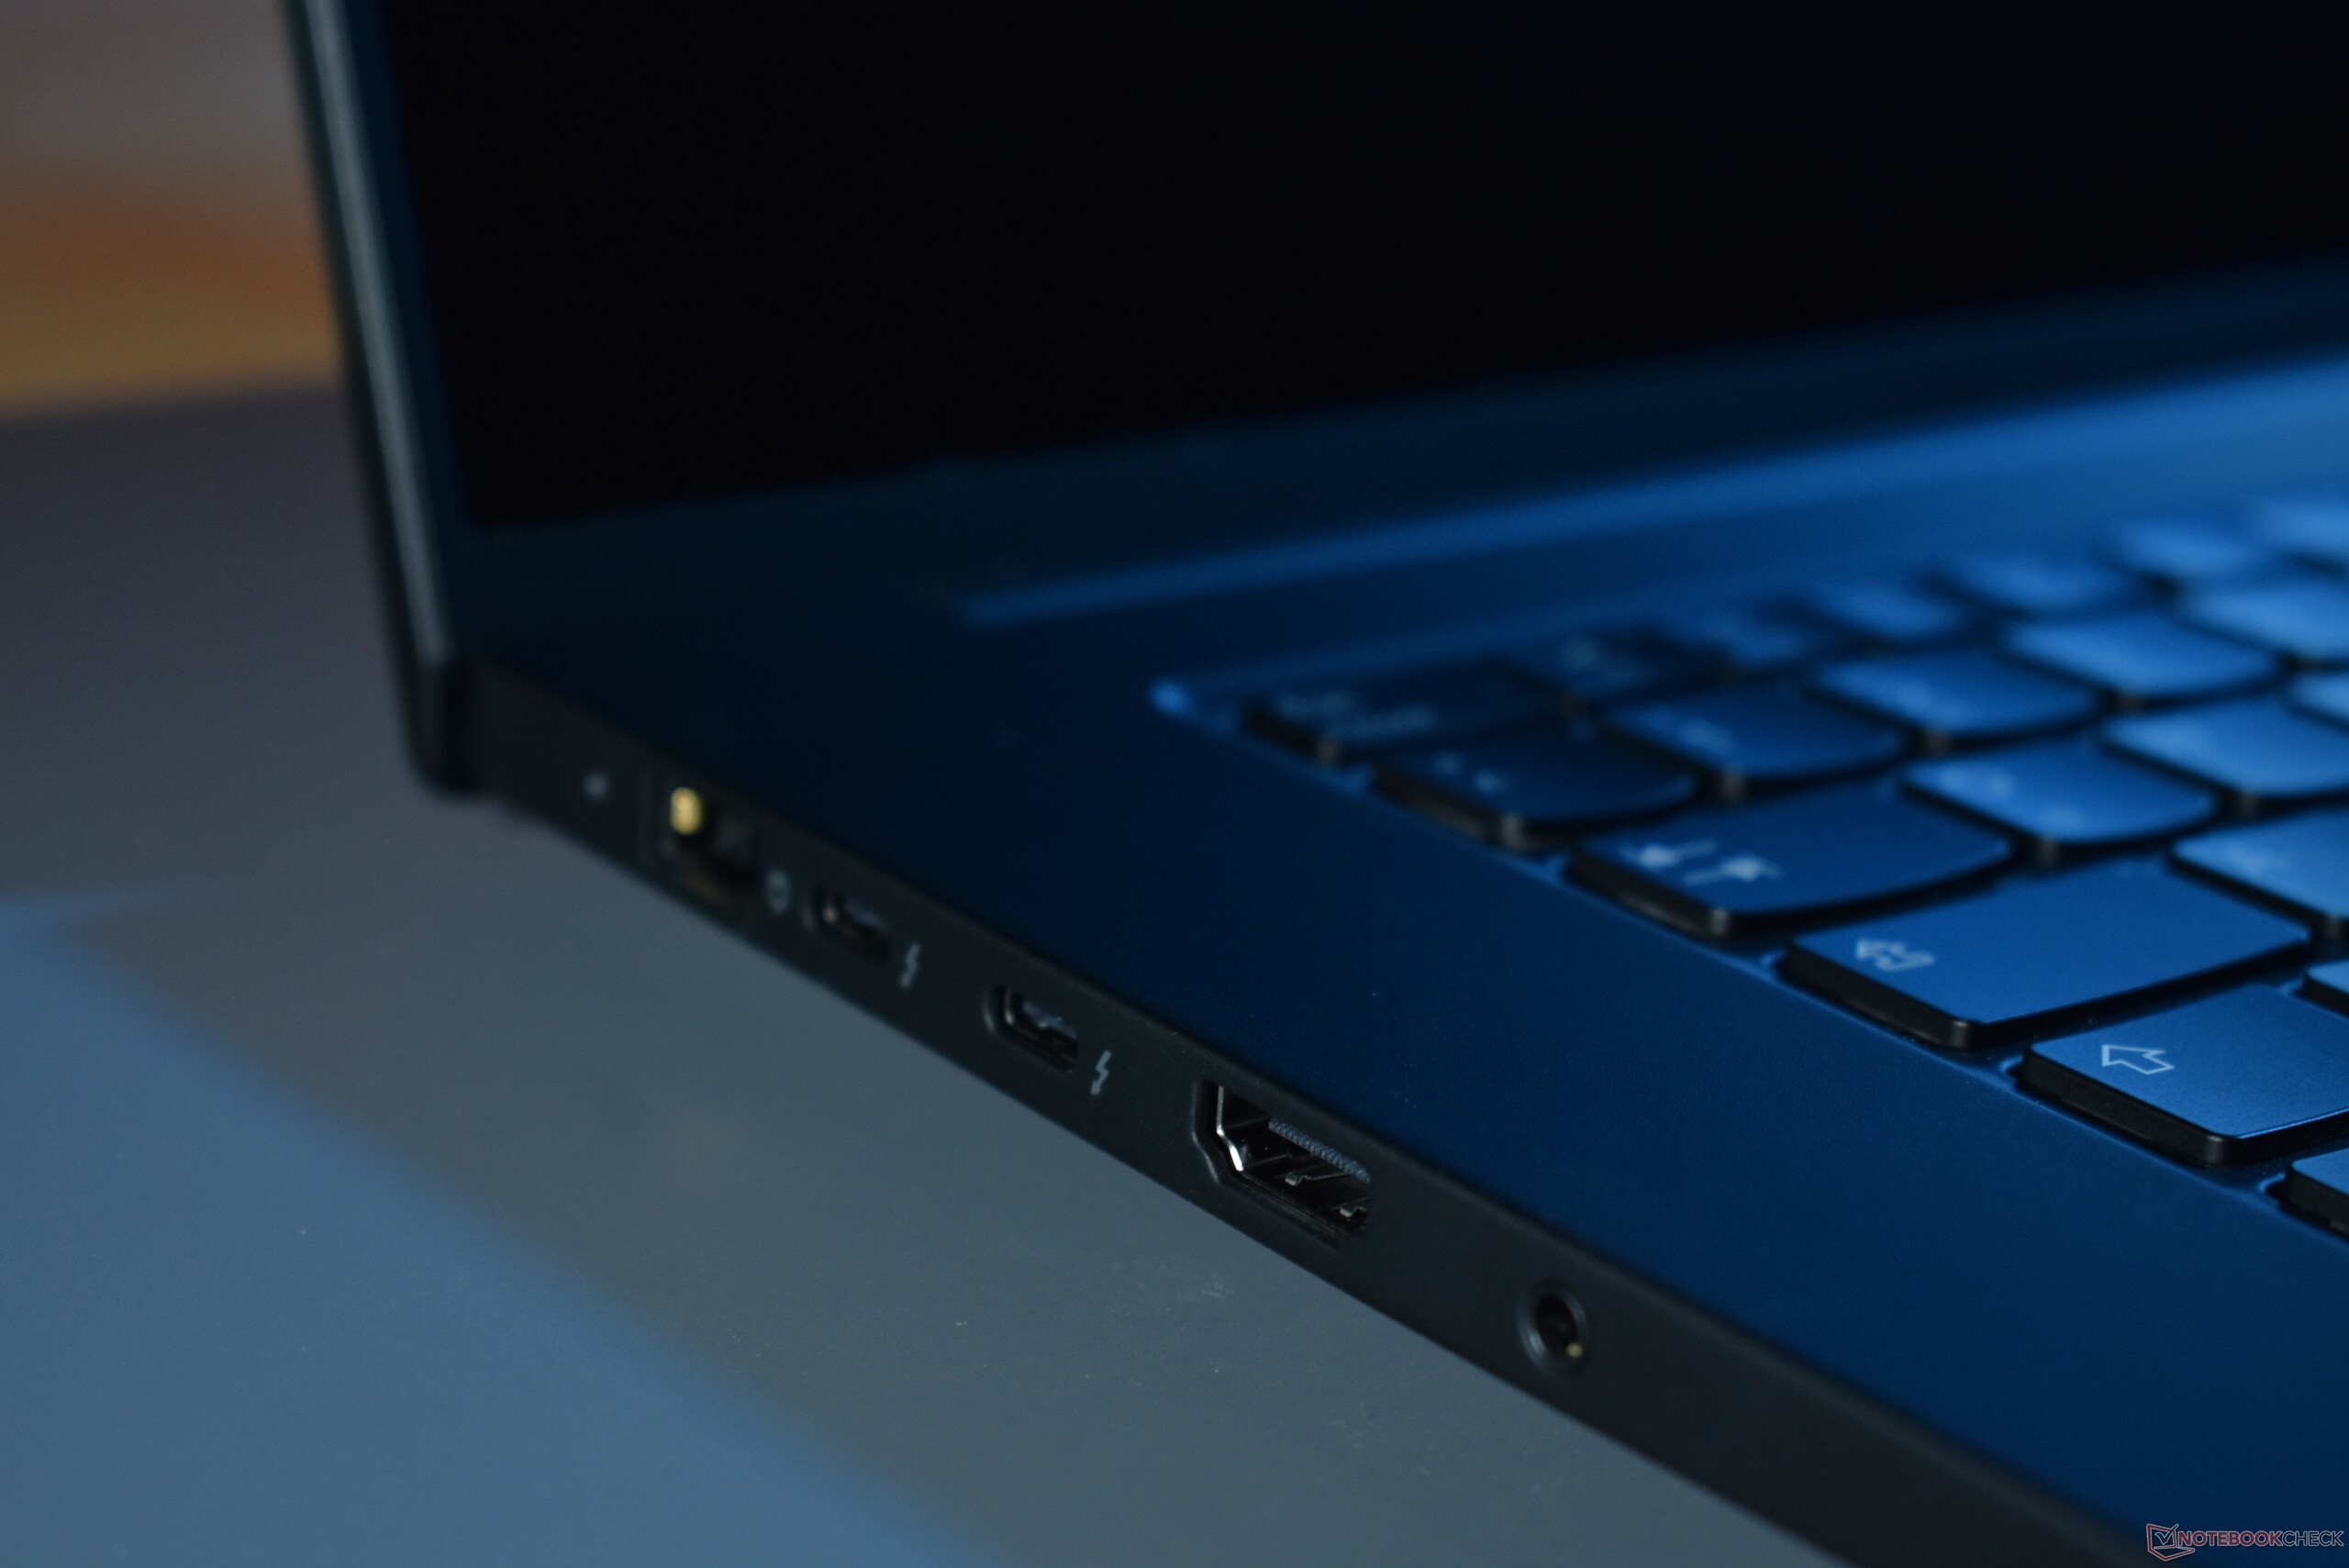
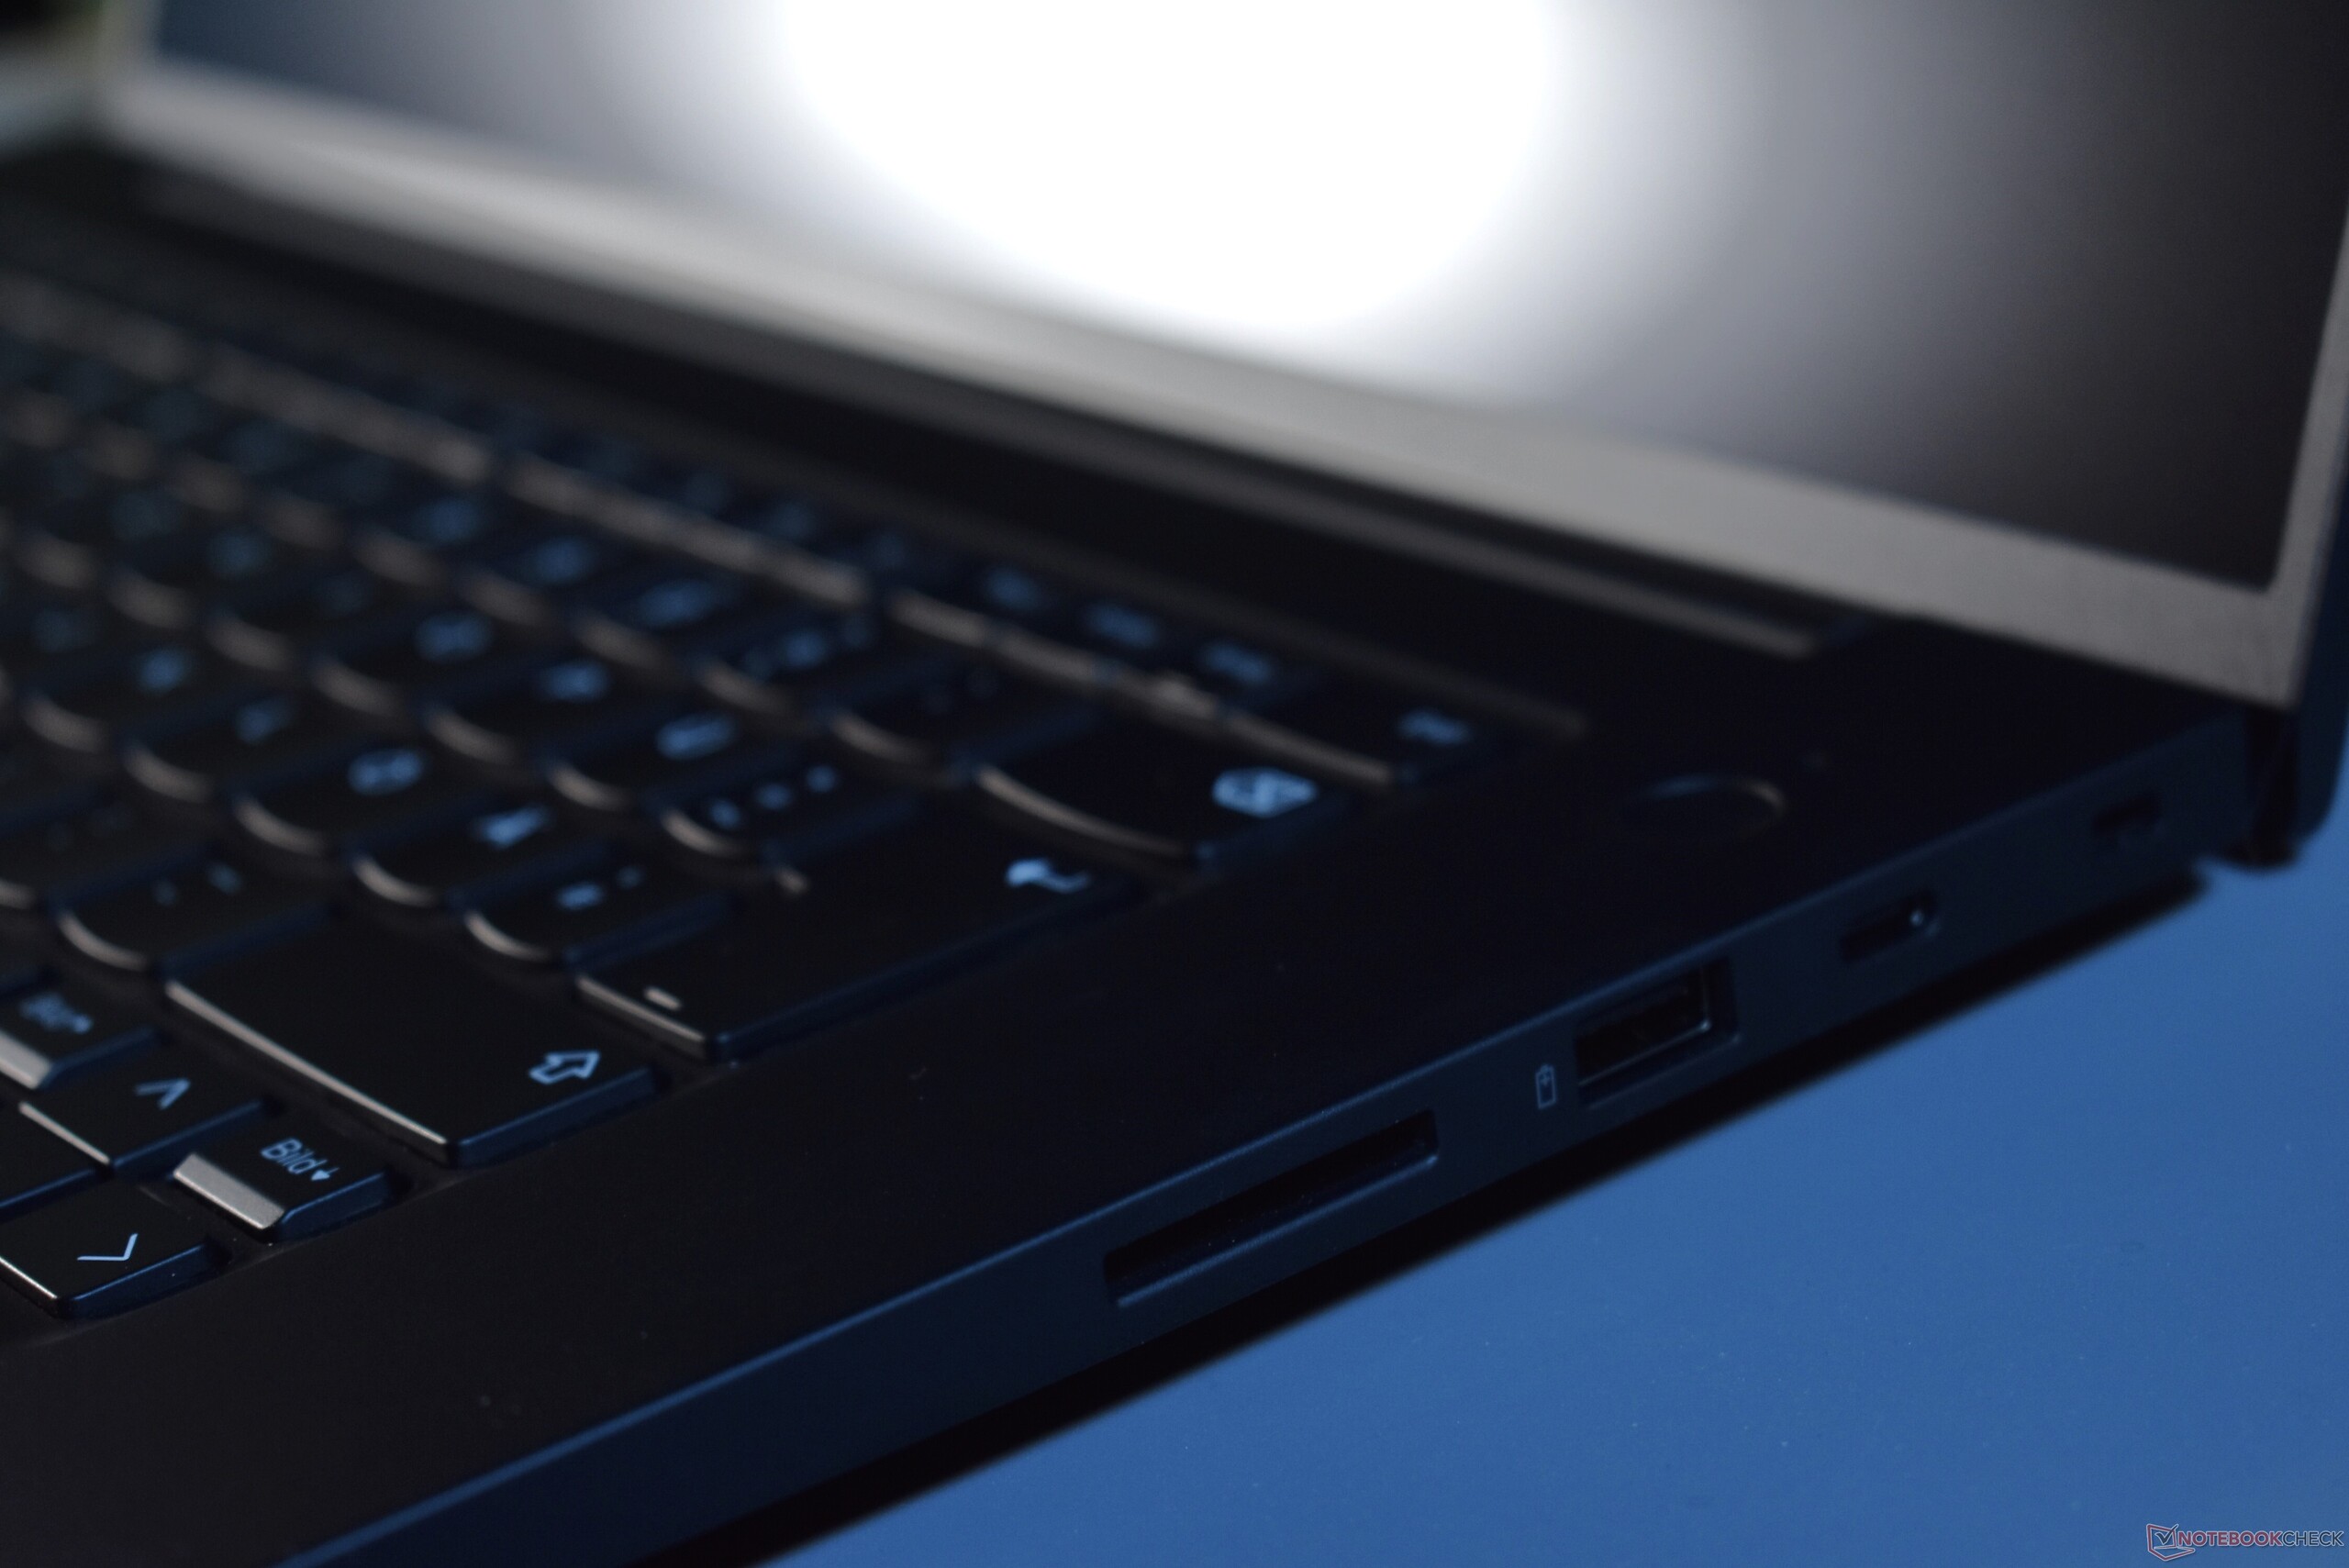
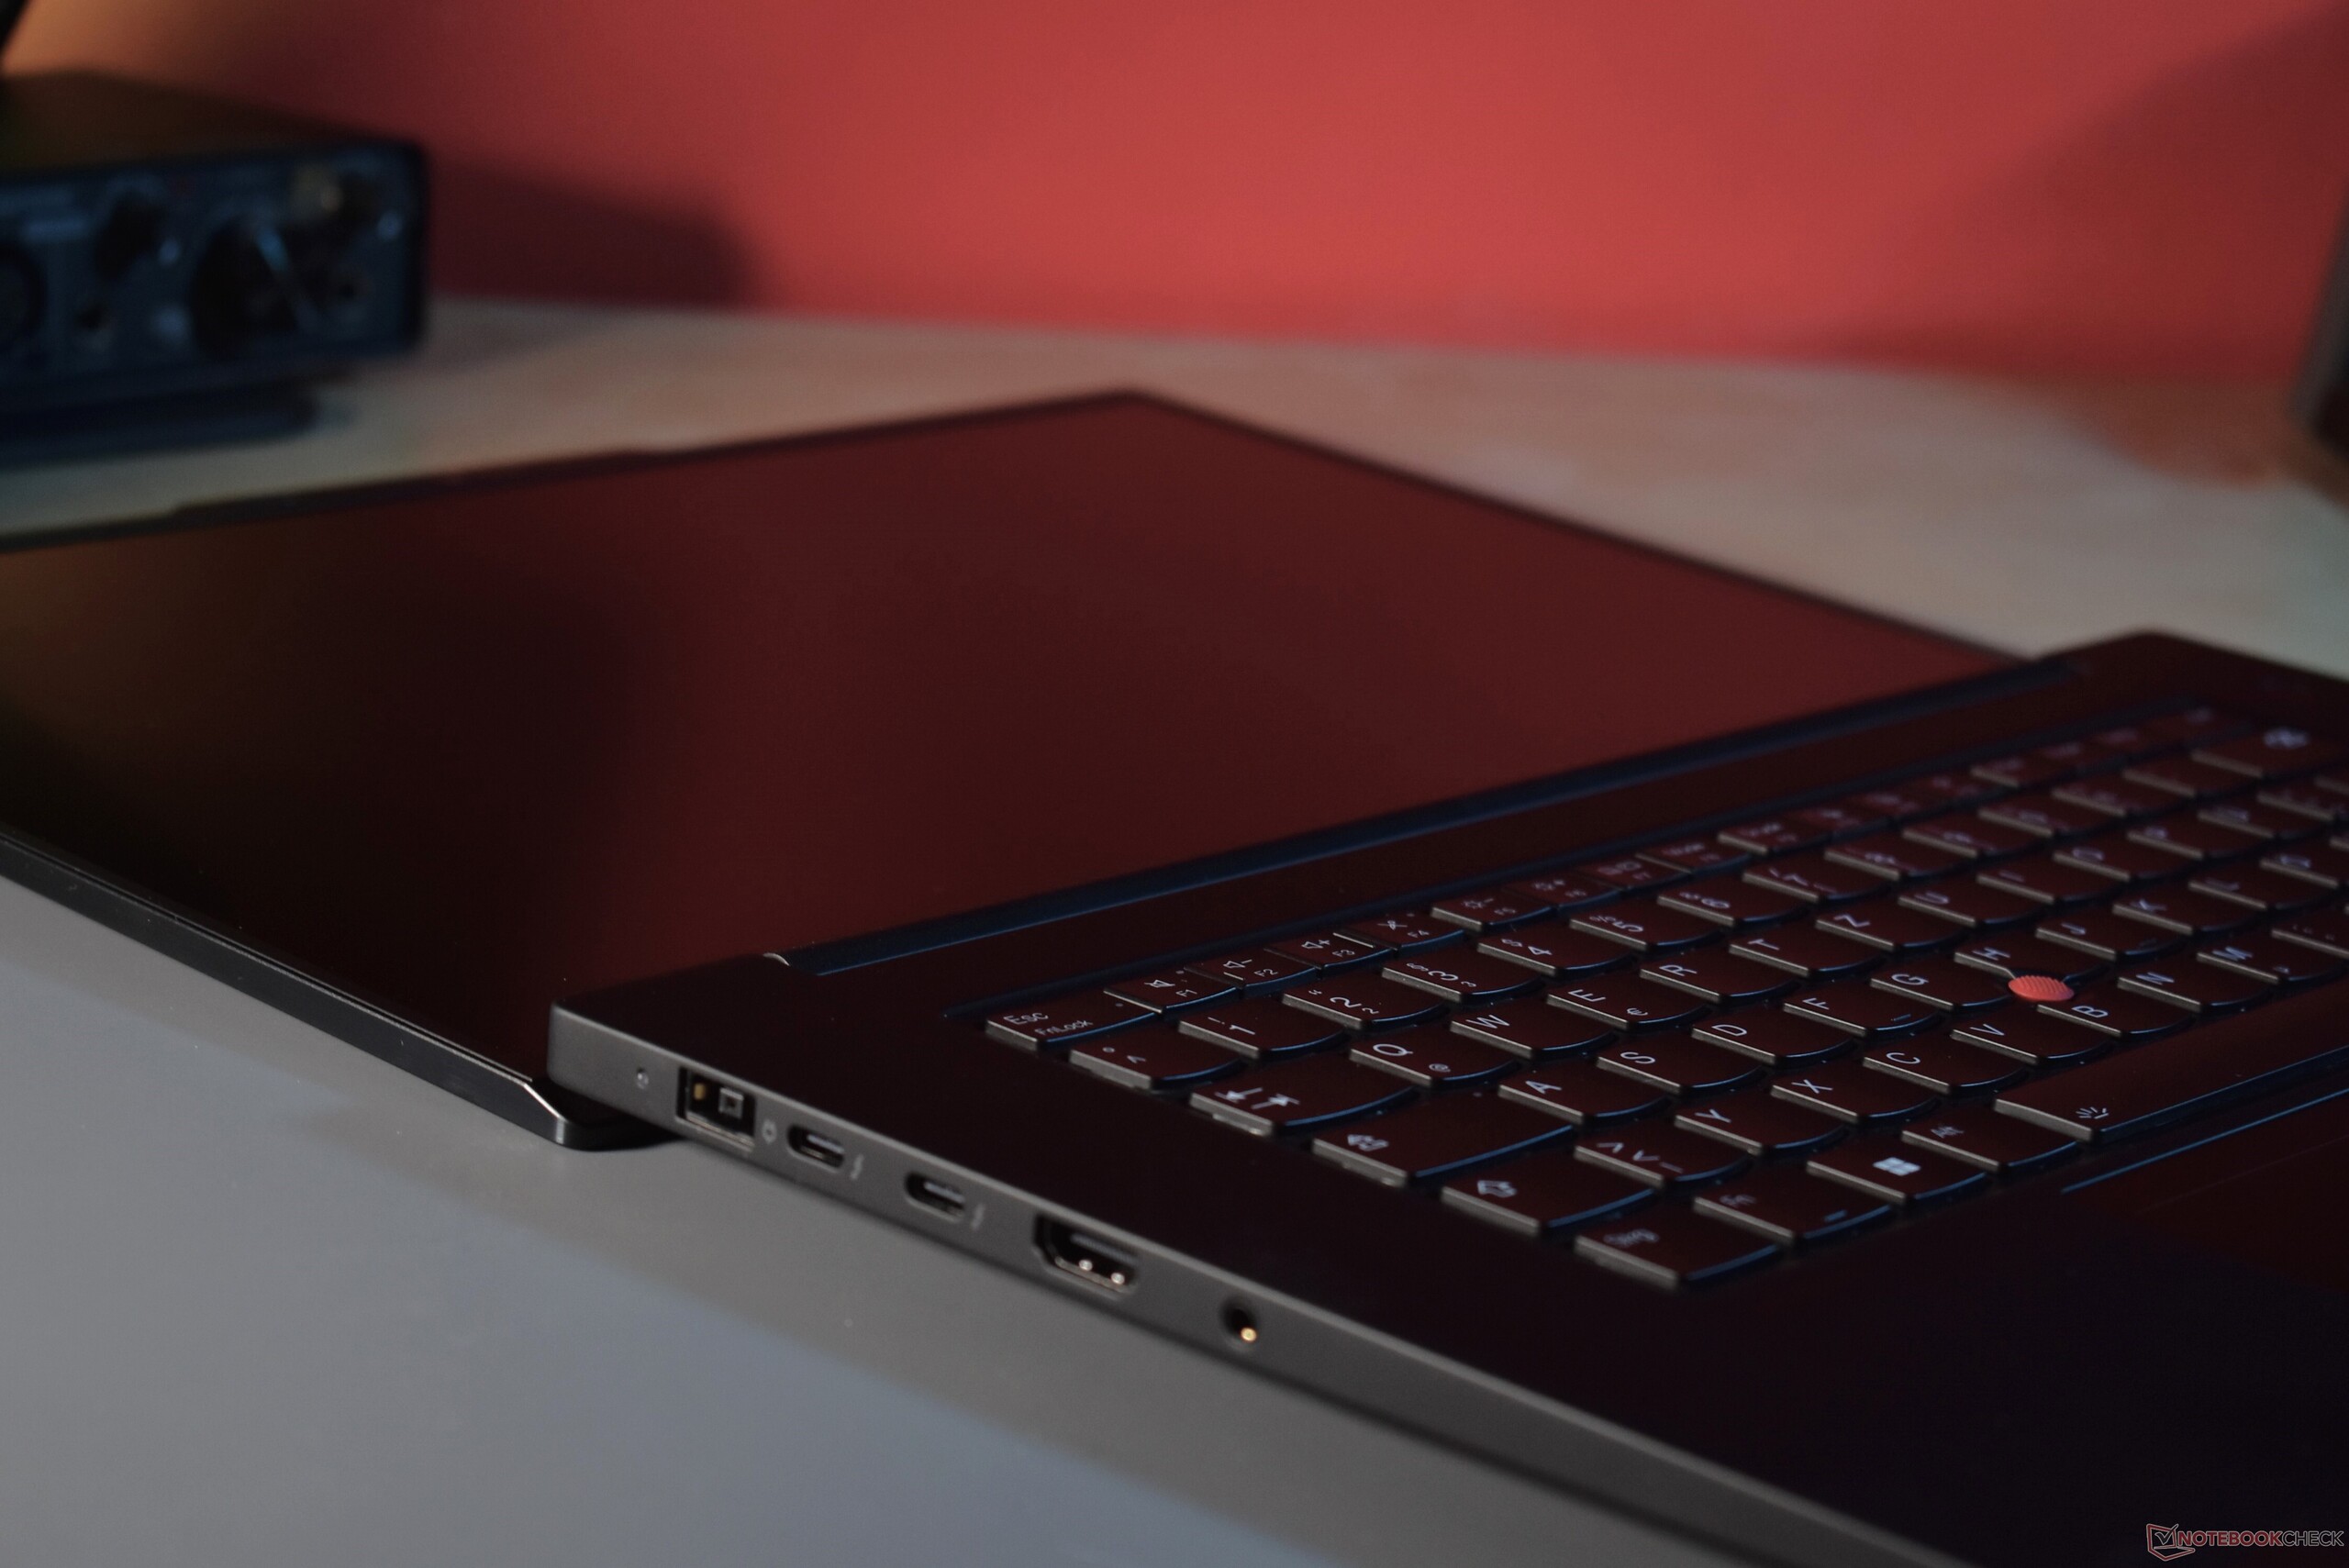
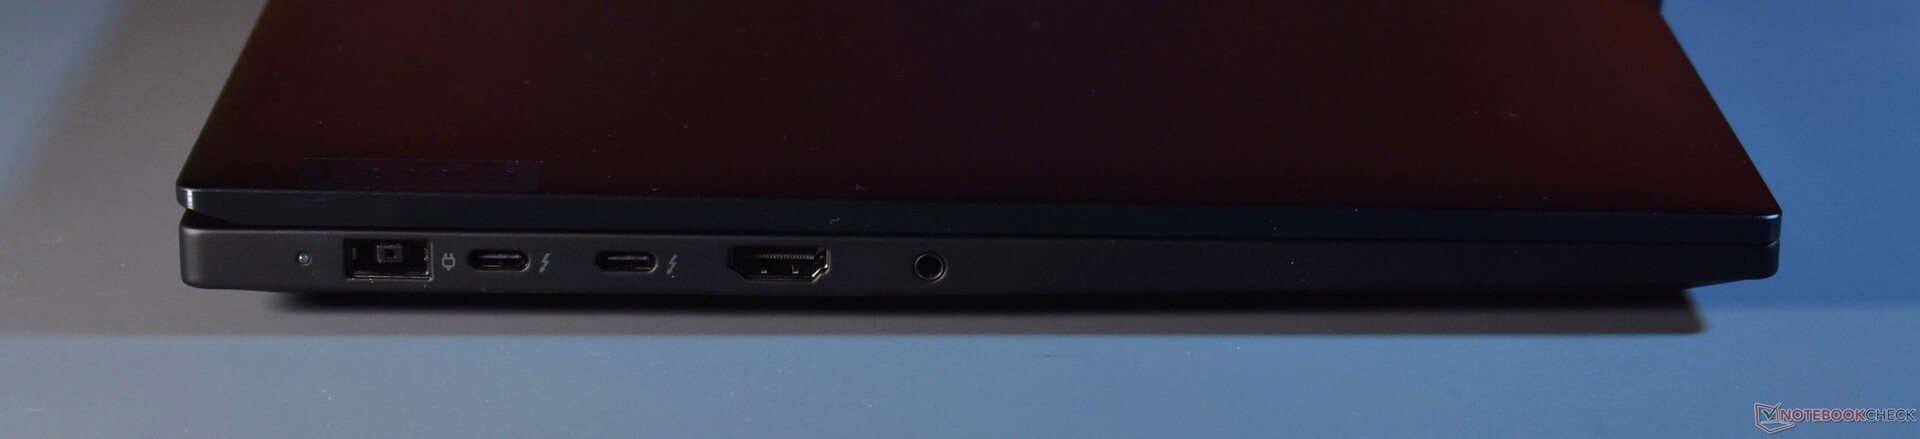
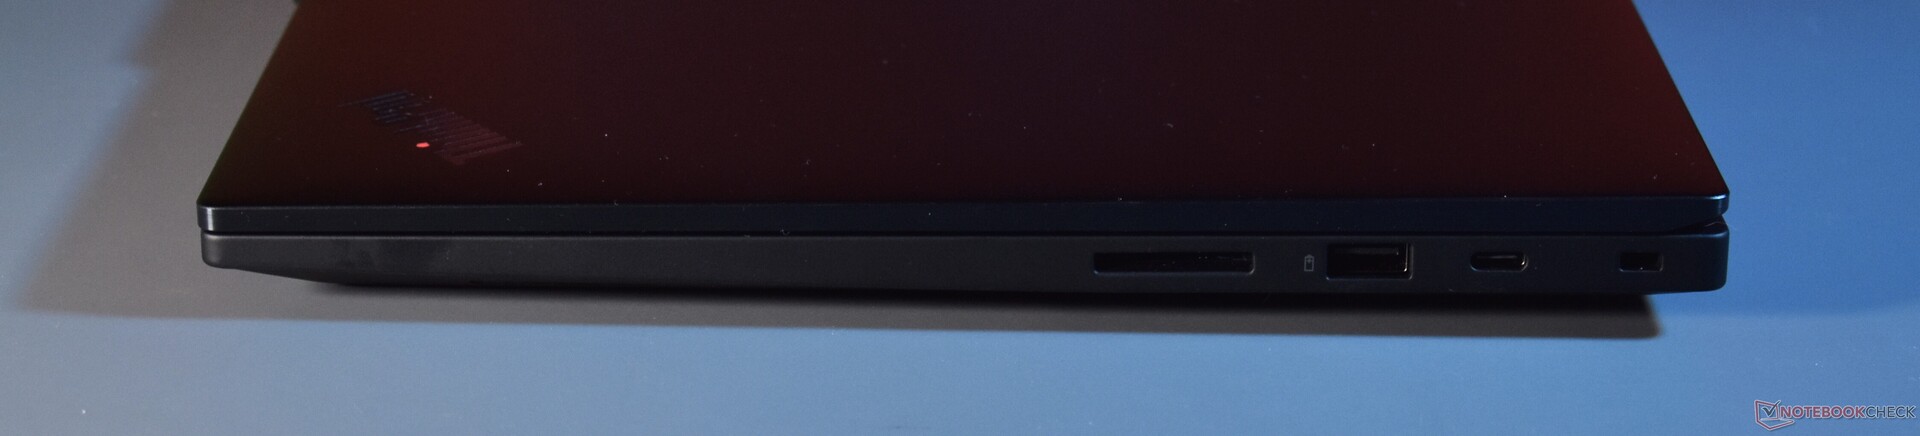
No hay una gran revolución para los puertos, Lenovo mantiene muchos conectores heredados. El único cambio sustancial: Uno de los dos puertos USB-A se sustituye por uno USB-C. De ese sabor, no hay tres puertos, con los dos de la izquierda soportando Thunderbolt 4. El nuevo puerto del lado derecho sí soporta al menos DisplayPort.
La carga es posible con cada uno de los puertos USB-C, aunque también hay un conector de carga Slim tip dedicado. Con un cargador USB-C de 100 W, el P1 G7 funciona sin problemas. Sólo bajo carga máxima, el rendimiento se verá probablemente reducido. Un cargador de 65 W puede cargar el P1 también - sin embargo, el portátil ThinkPad se quejará de ello, produciendo una notificación de que es un "cargador lento".
Lector de tarjetas SD
Sorprendente: El lector de tarjetas del Lenovo ThinkPad P1 Gen 7 vuelve a admitir tarjetas SD por completo, lo que lo hace útil para la ampliación permanente del almacenamiento. Más bien decepcionantes son las velocidades de transferencia, que yo medí con la tarjeta de referencia Angelbird AV Pro V60. El lector de tarjetas SD tiene una velocidad media.
| SD Card Reader | |
| average JPG Copy Test (av. of 3 runs) | |
| Dell XPS 16 9640 (Angelbird AV Pro V60) | |
| Media de la clase Workstation (49.6 - 200, n=12, últimos 2 años) | |
| Lenovo ThinkPad P1 G6 21FV001KUS (Toshiba Exceria Pro SDXC 64 GB UHS-II) | |
| Lenovo ThinkPad P1 Gen 7 21KV001SGE (AV Pro V60) | |
| maximum AS SSD Seq Read Test (1GB) | |
| Dell XPS 16 9640 (Angelbird AV Pro V60) | |
| Media de la clase Workstation (85.1 - 227, n=12, últimos 2 años) | |
| Lenovo ThinkPad P1 G6 21FV001KUS (Toshiba Exceria Pro SDXC 64 GB UHS-II) | |
| Lenovo ThinkPad P1 Gen 7 21KV001SGE (AV Pro V60) | |
Comunicación
El ThinkPad P1 Gen 7 está preparado para el futuro en lo que respecta a la solución Wi-Fi. Lenovo incorpora una solución Wi-Fi 7 de Intel, la BE200. Produce altas velocidades de transferencia.
Además de Wi-Fi, esta estación de trabajo ThinkPad sólo ofrece Bluetooth 5.4. Ethernet RJ45 no está presente, ni tampoco WWAN. la tecnología 4G o 5G se suprimió de la serie P1 hace unos años, y no parece que esta característica vaya a reaparecer pronto.
Cámara web
La cámara web del Lenovo ThinkPad P1 Gen 7 ofrece una resolución de cinco megapíxeles. En el modelo anterior, ésta era todavía una mejora opcional. La calidad de la webcam es comparativamente buena para un portátil, siendo las imágenes bastante nítidas con buena iluminación.


Seguridad
Dado que se trata de un modelo para empresas, el Lenovo ThinkPad P1 Gen 7 ofrece la mayoría de las funciones de seguridad que ofrecen los modelos estándar para tareas de oficina como la serie T. Entre estas características, encontramos una ranura de bloqueo Kensington, un lector de huellas dactilares en el botón de encendido, así como un chip dTPM, una detección de manipulación inferior para la cubierta de la base y una cámara de infrarrojos para Windows Hello. A diferencia del ThinkPad Z16, Lenovo dota al ThinkPad P1 G7 de un obturador de cámara físico para mejorar la privacidad. No forma parte del paquete un lector de tarjetas inteligentes.
Accesorios
Lenovo baja un escalón en lo que se refiere al cargador. En lugar de uno de 230 W, el P1 G7 solo incluye un cargador de 170 W, que es más ligero y compacto. Sigue siendo un cargador propietario con un conector de punta Slim, pero aquí también es posible la carga USB-C con hasta 100 W.
Mantenimiento
Lenovo facilita el acceso al interior del ThinkPad, ya que los seis tornillos que sujetan la cubierta inferior son cautivos, lo que evita que se pierdan. Los tornillos utilizan el estándar de cabeza Philips, por lo que no se necesitan herramientas especiales. Una vez que los tornillos están sueltos, la base se puede abrir empezando por la parte trasera, alrededor de las bisagras. Aquí los clips prácticamente se abren solos.
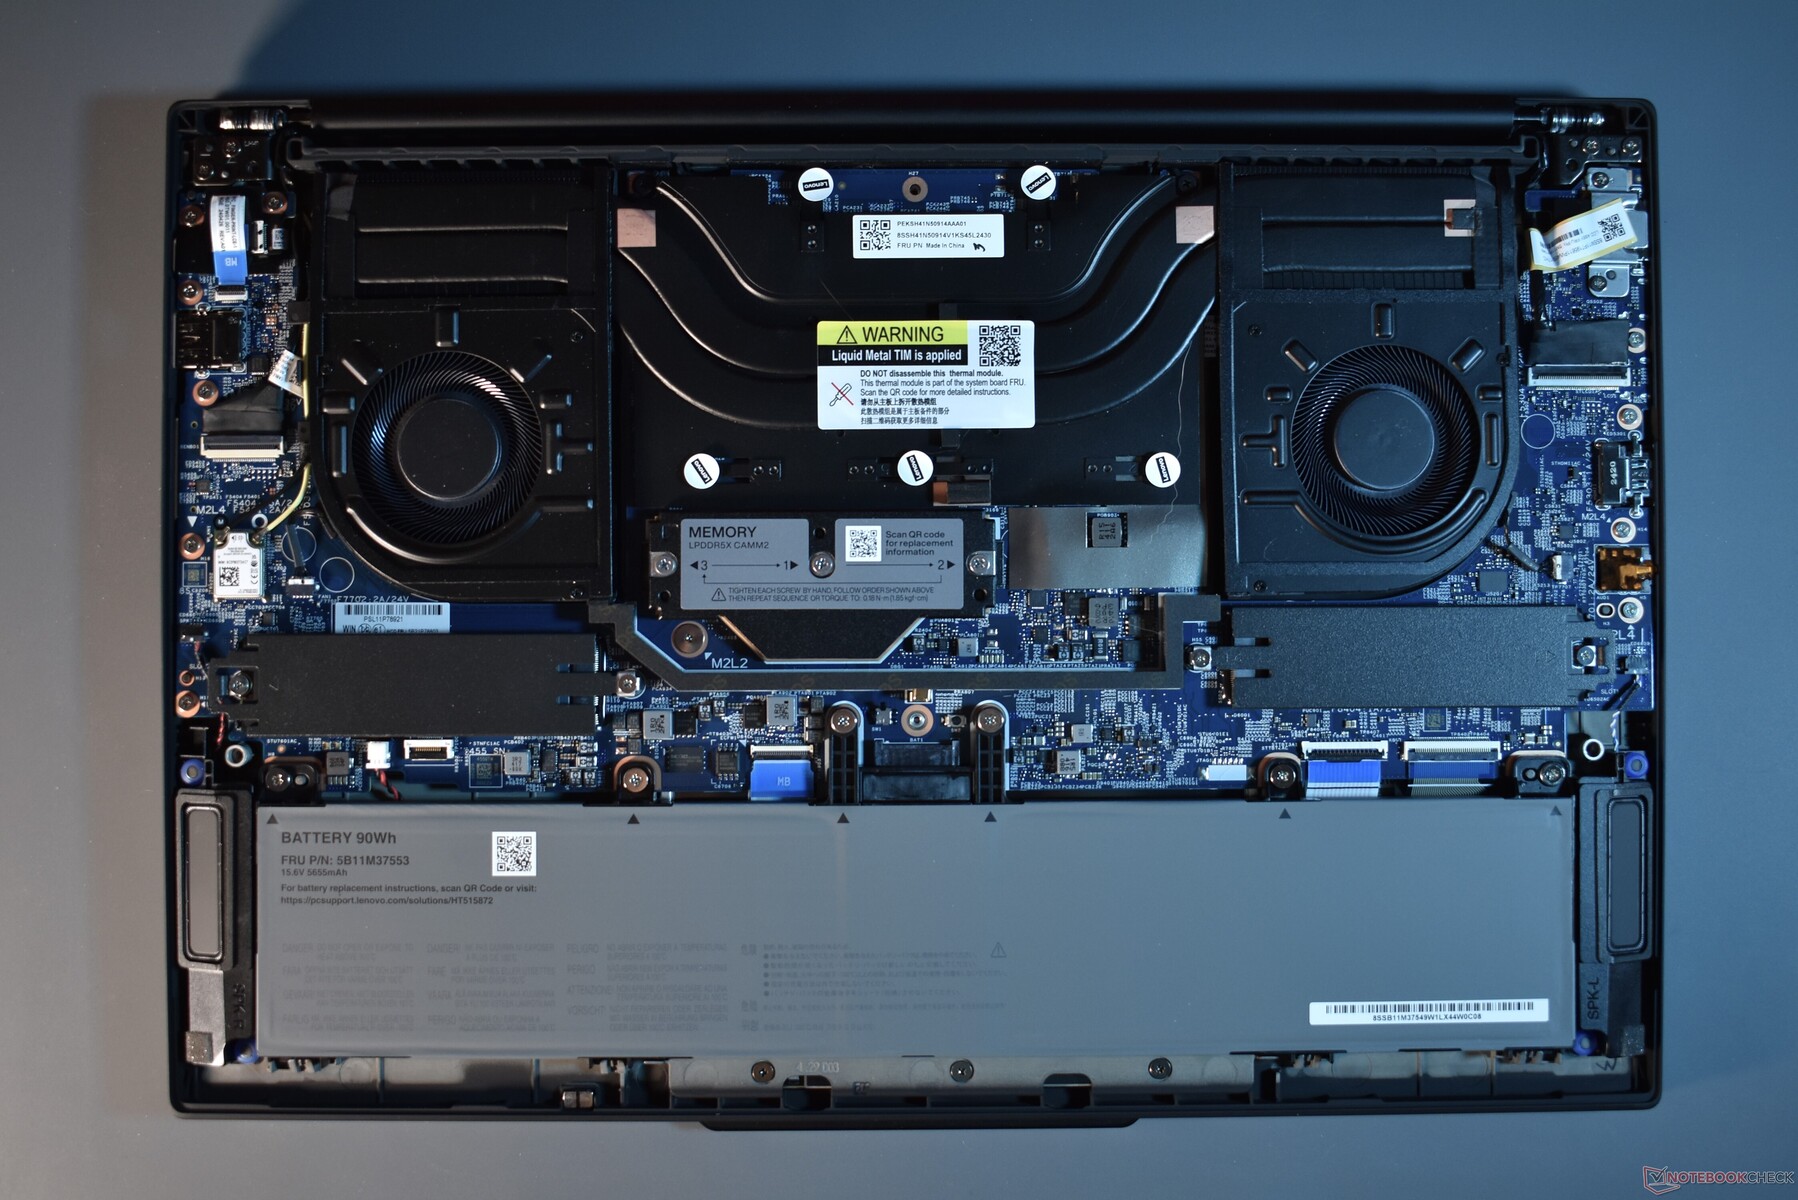
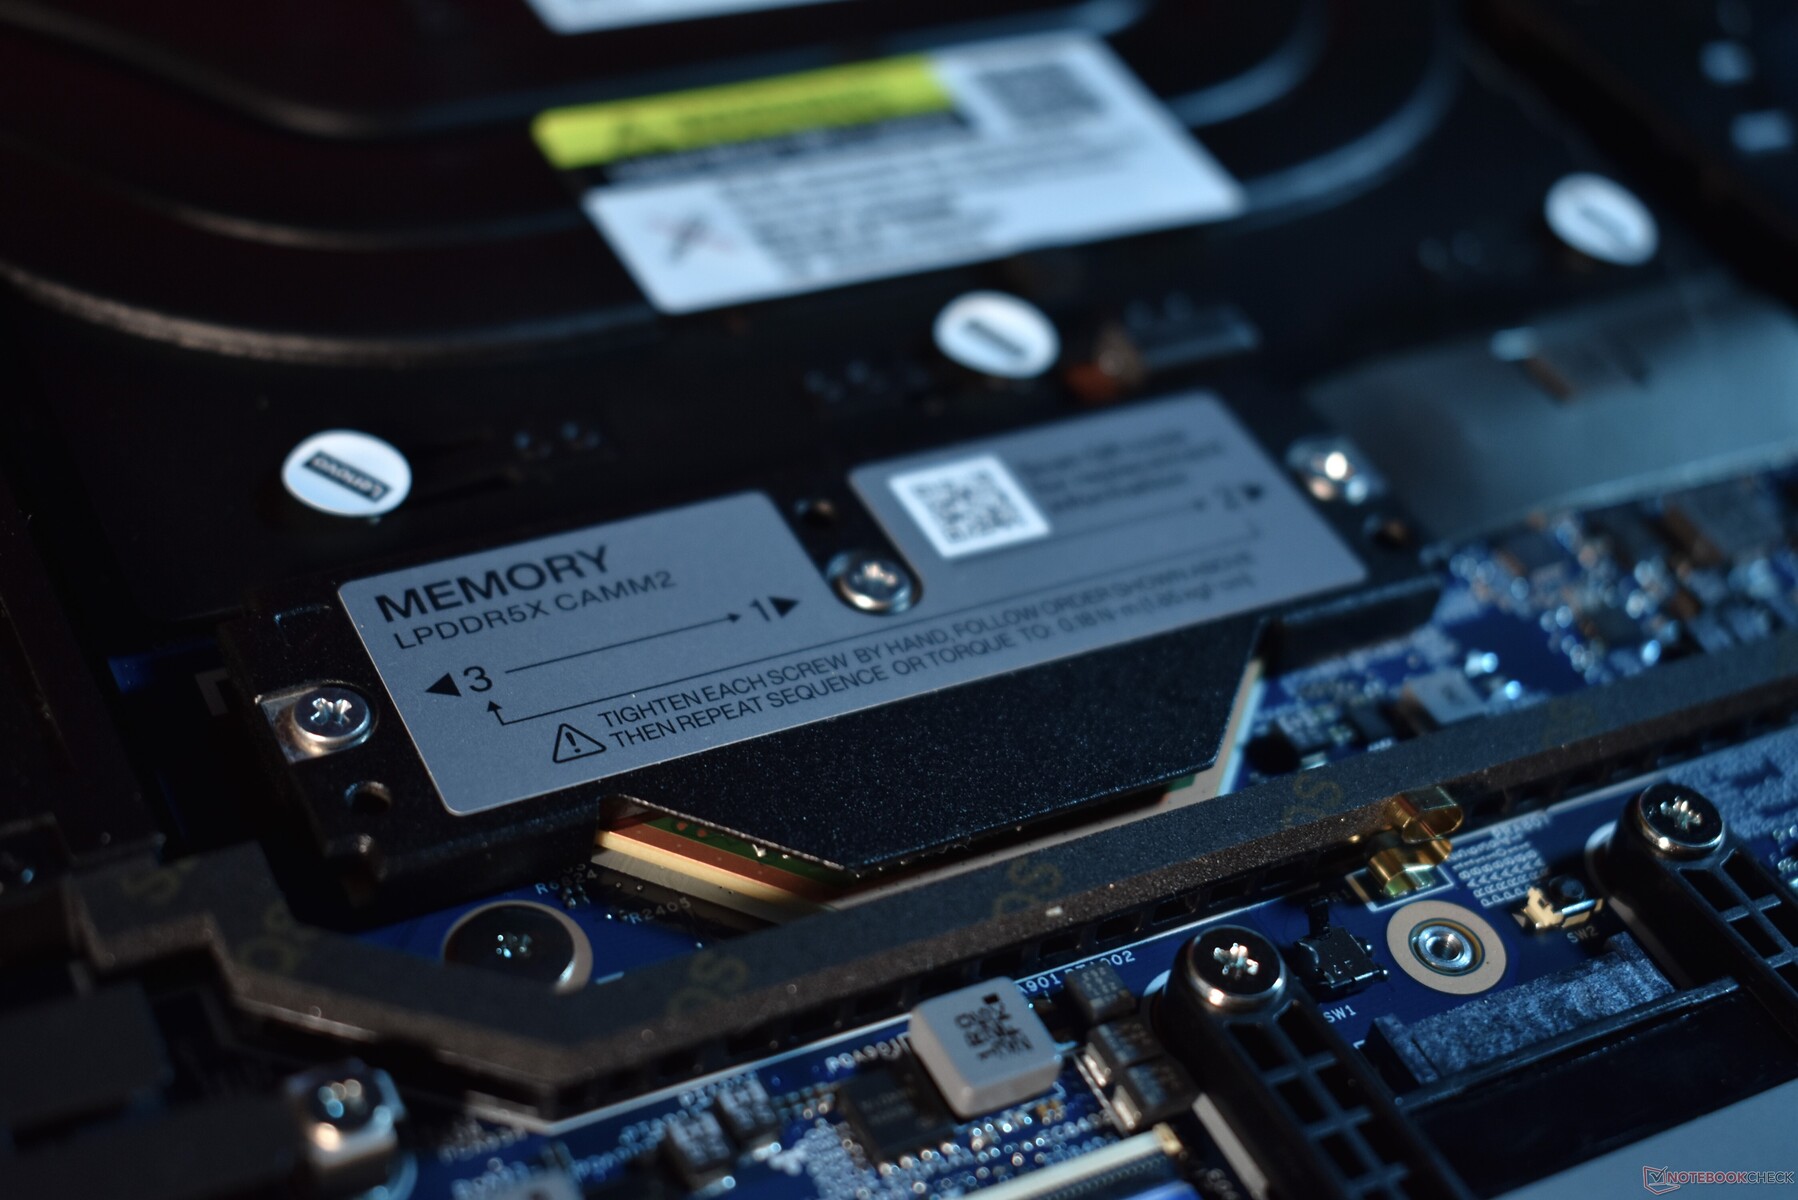
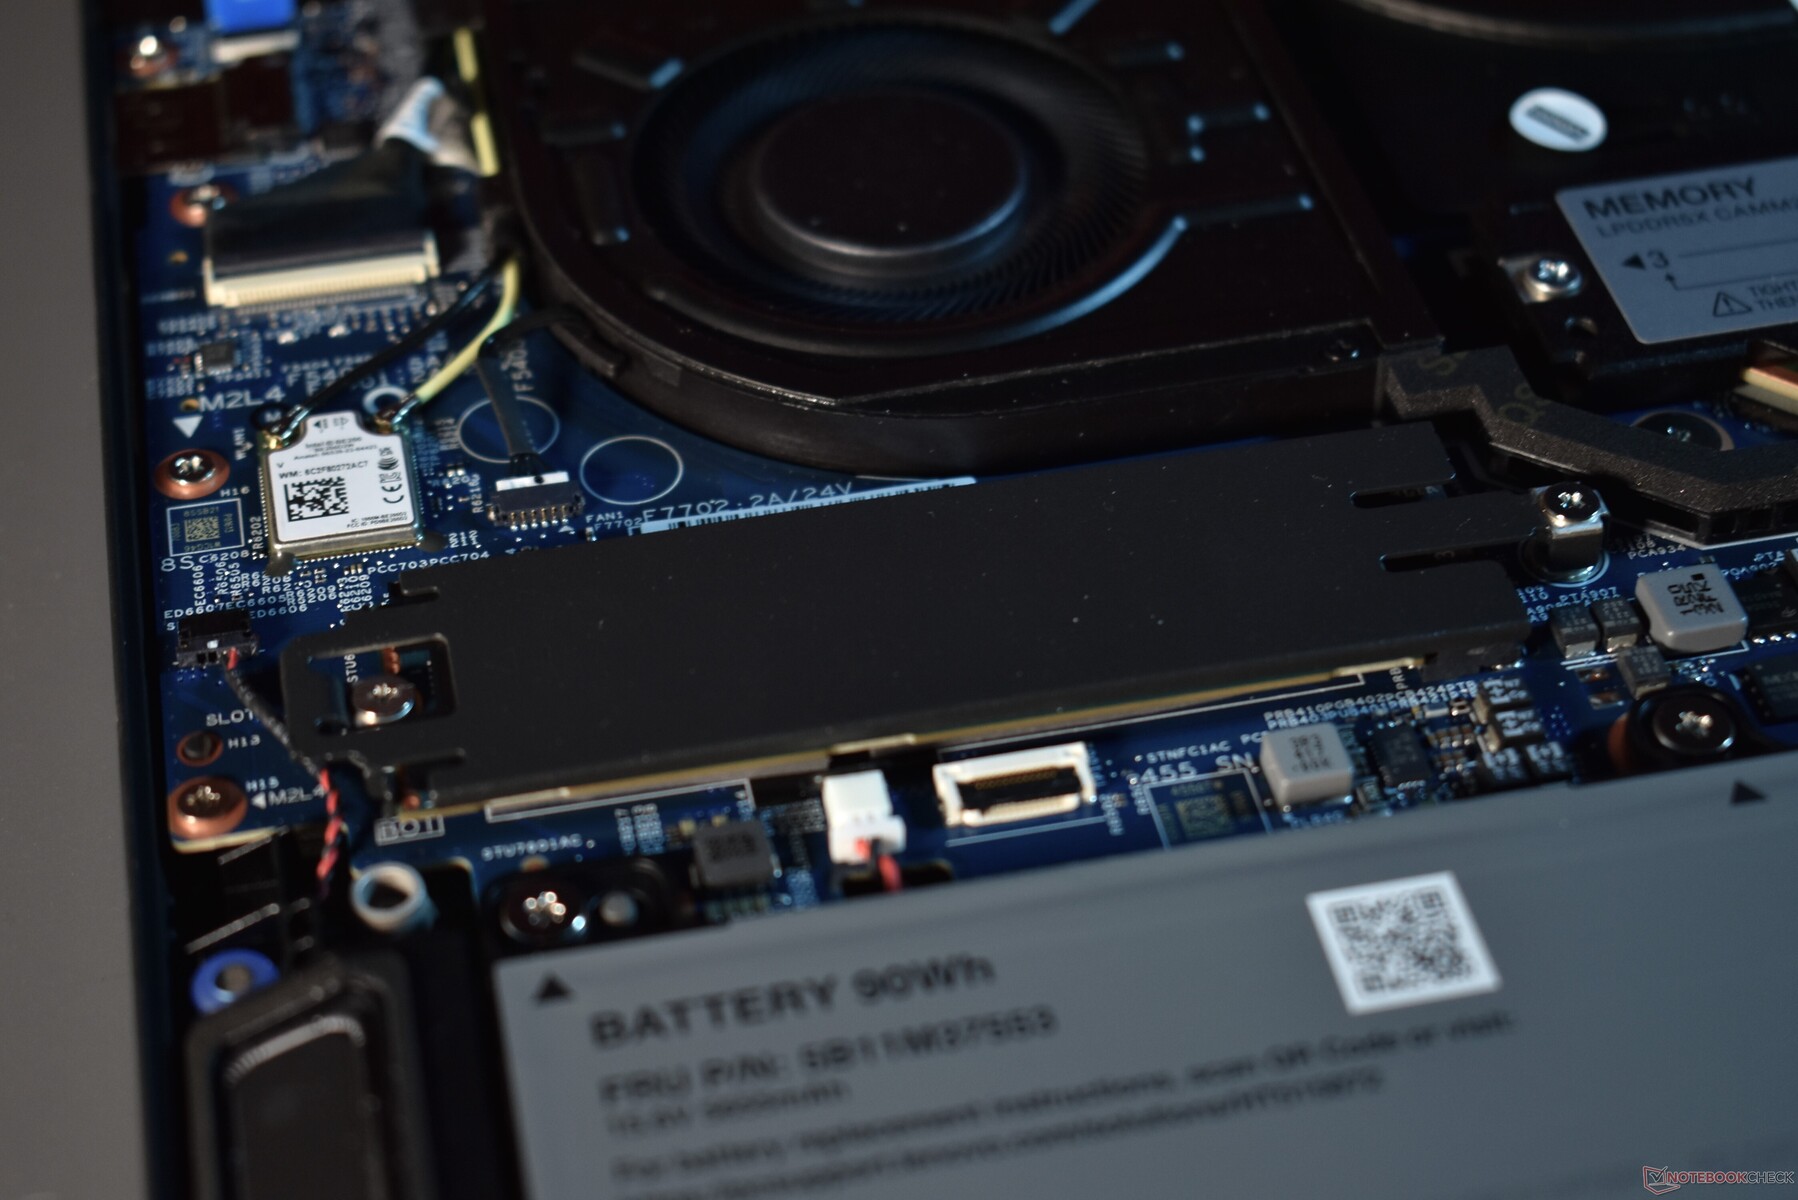
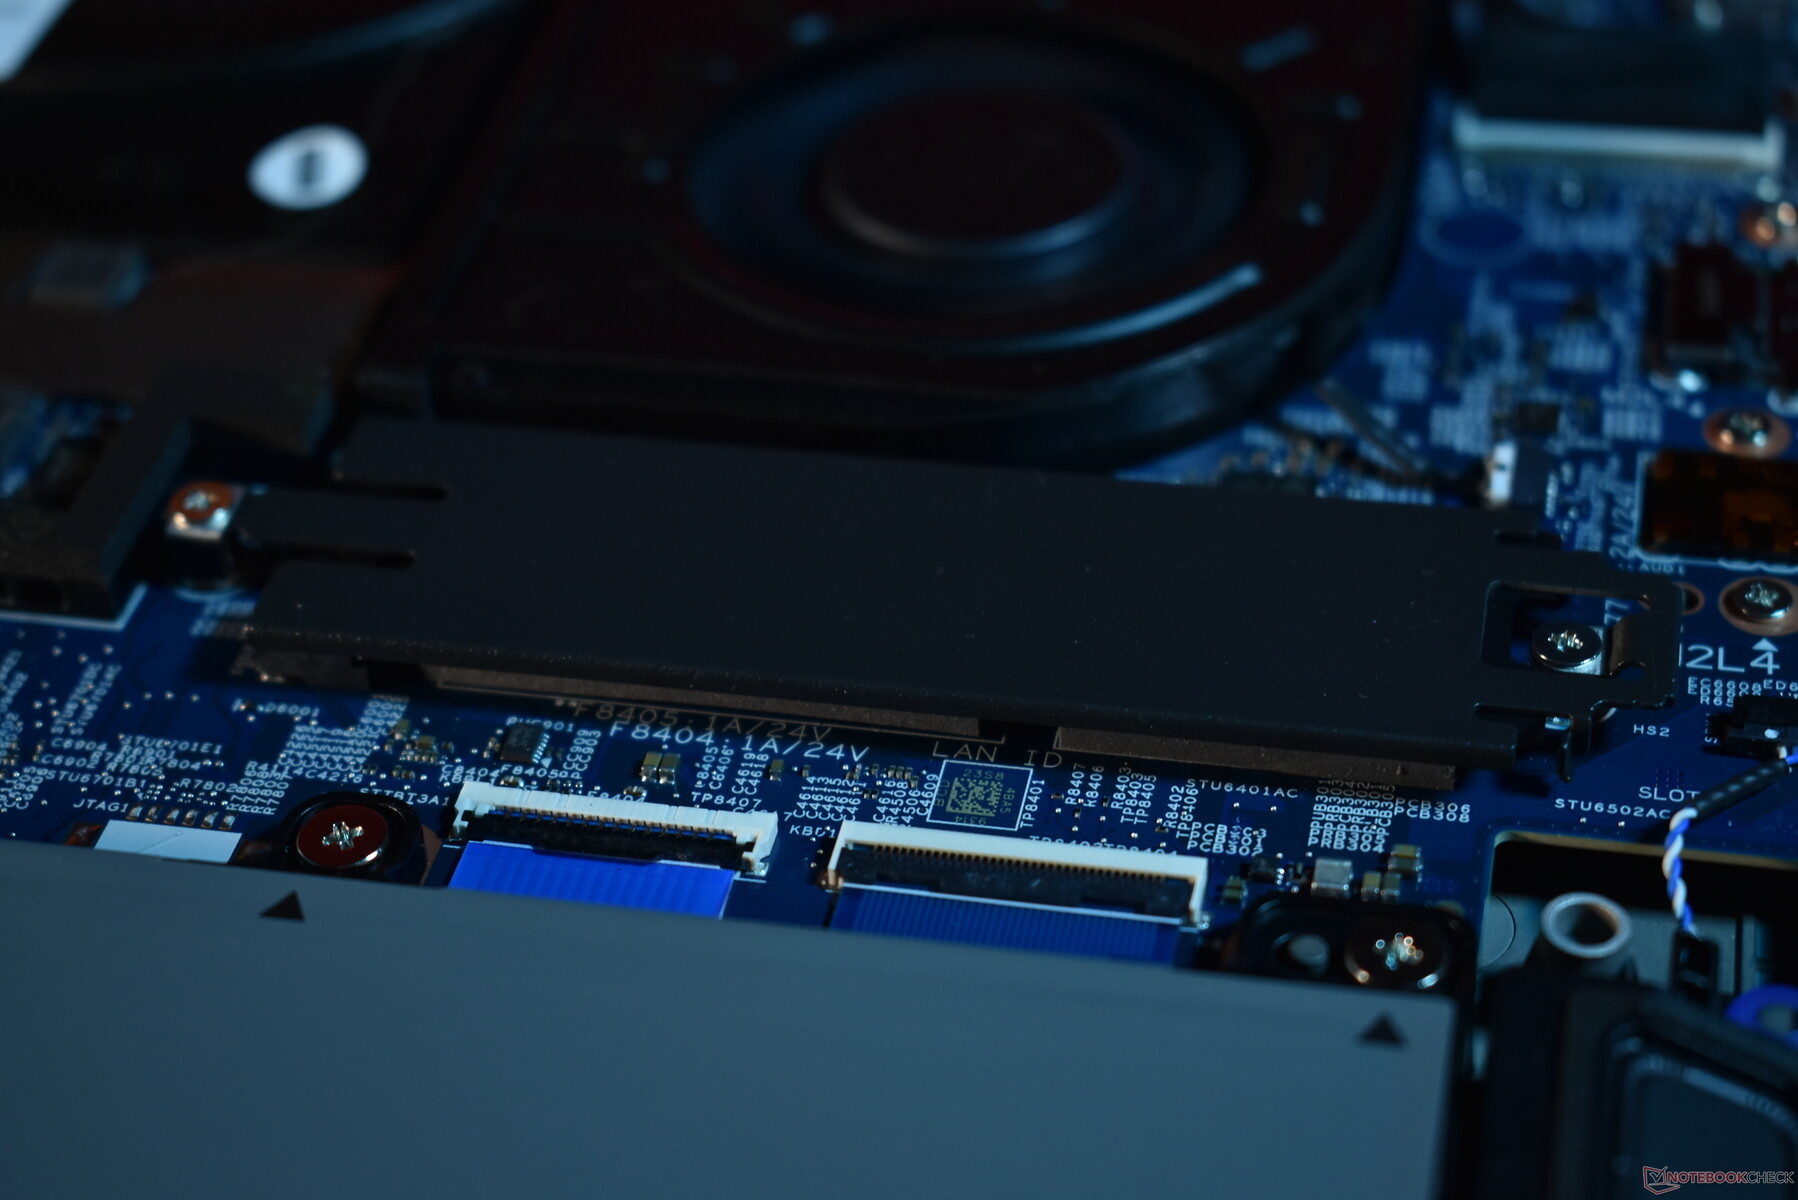
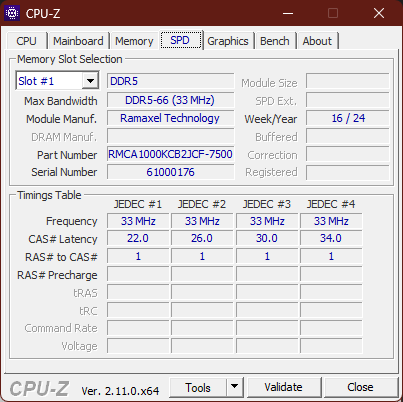
Lenovo ha rediseñado completamente el interior. El sistema de refrigeración es ligeramente más pequeño que el predecesor ThinkPad P1 Gen 6. Como ganancia, el ThinkPad P1 Gen 7 dispone siempre de dos ranuras M.2 2280, lo que sólo era el caso de las variantes más débiles del P1 Gen 6 . Además, las dos ranuras SO-DIMM no se encuentran por ninguna parte. En su lugar, Lenovo coloca un único módulo LPCAMM2: el Lenovo ThinkPad P1 Gen 7 es el primer portátil con este tipo de memoria. El módulo único lleva memoria de bajo consumo, que viene en tamaños de 16, 32 y 64 GB. El predecesor con memoria DDR5 más ineficiente ofrecía hasta 96 GB, aunque los módulos SO-DIMM también ocupaban mucho más espacio. Para extraer la memoria LPCAMM2, hay que aflojar tres tornillos. Encontrará una guía sobre cómo hacerlo en el código QR del módulo de memoria.
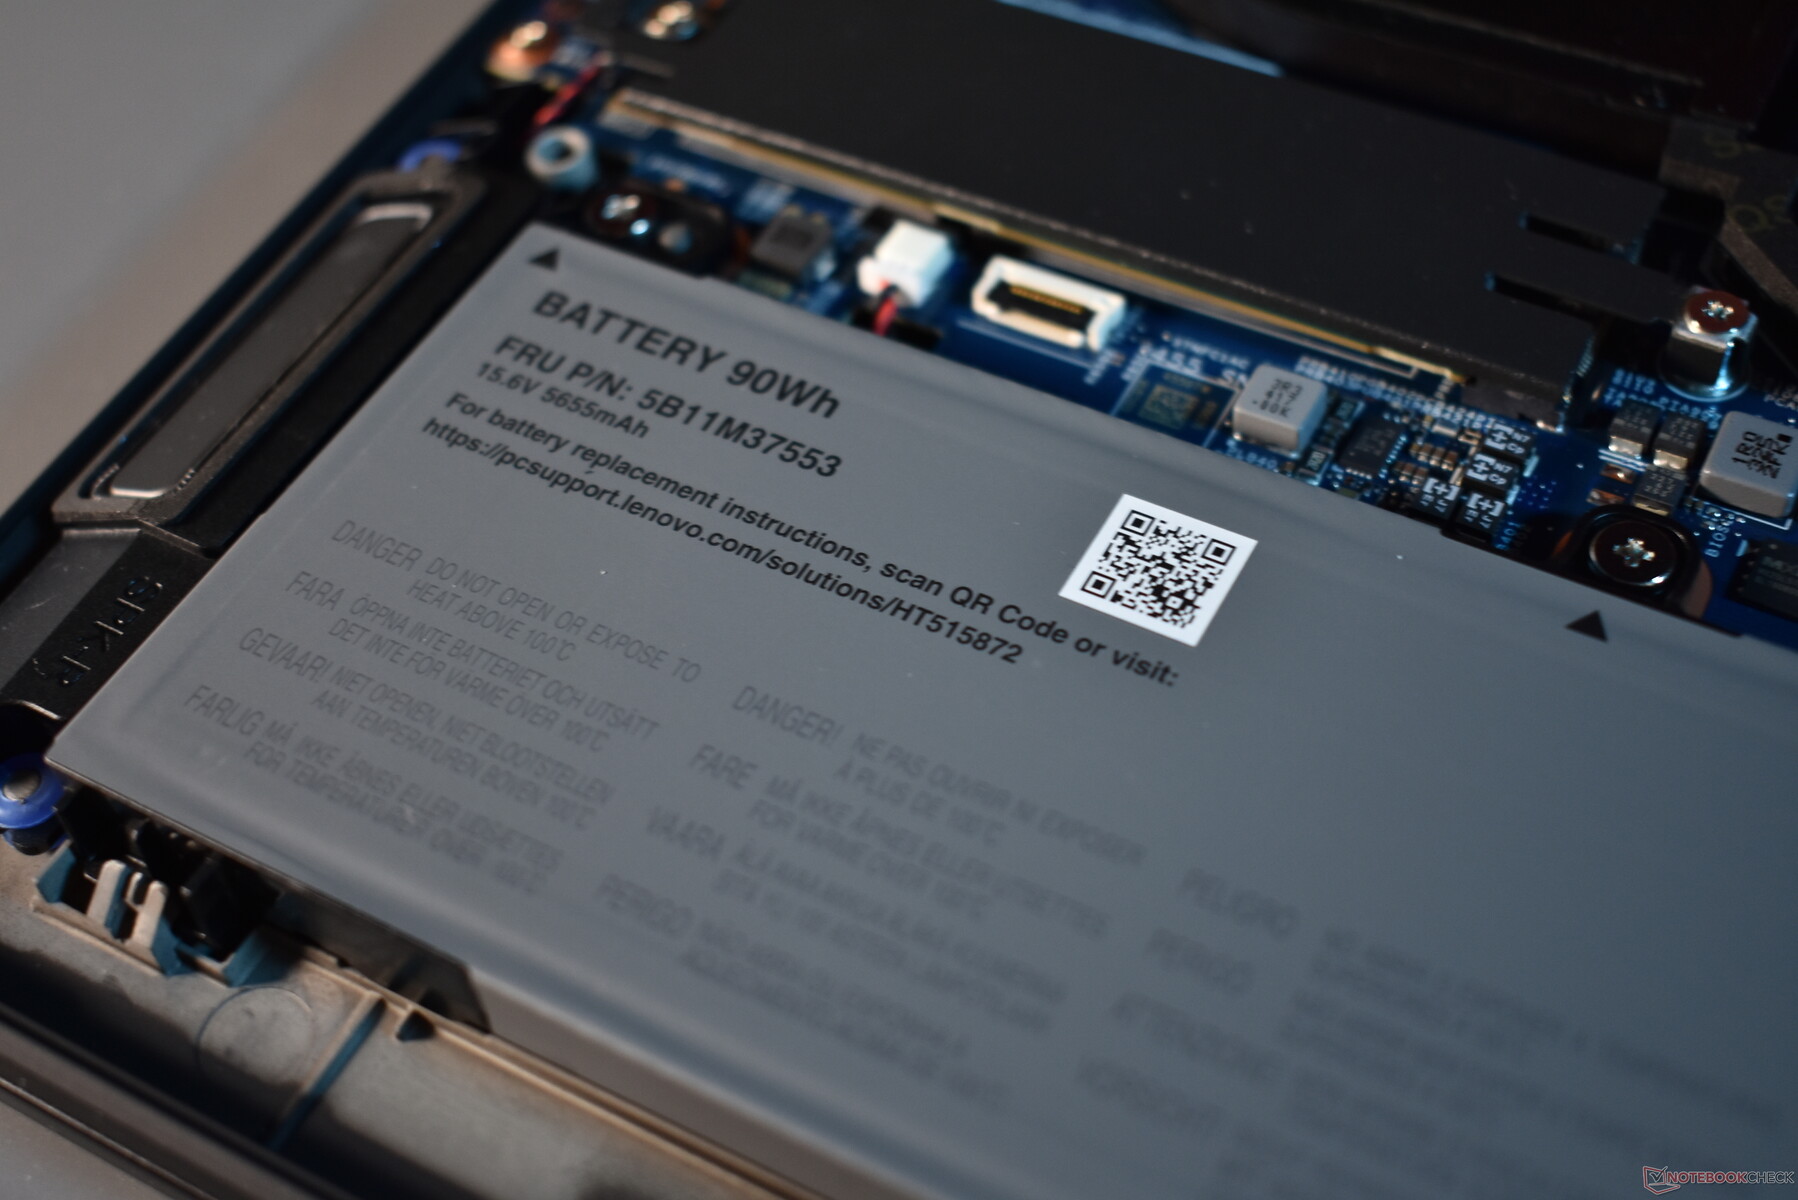
El módulo Wi-Fi está soldado. Hace tiempo que la WWAN no está presente en la línea P1, por lo que no hay ranura M.2 adicional para ello. Es bastante fácil cambiar la batería, Lenovo prescindió del cable-conector. En su lugar, la batería simplemente se enchufa directamente. Por supuesto, sigue estando asegurada con tornillos. Aquí también hay un código QR a un manual. Por primera vez con la línea P1, la batería puede ser cambiada por el usuario incluso en el periodo de garantía, ya que ahora es una Unidad Sustituible por el Cliente (CRU).
Lo que no es fácilmente sustituible es el teclado, hay que cambiar toda la unidad base para cambiar el teclado. Además, el sistema de refrigeración ya no es fácilmente accesible - Lenovo advierte a los clientes que no lo desmonten, debido al uso de pasta refrigerante de metal líquido.
Sostenibilidad
La mayoría de los portátiles ThinkPad de la generación 2024 utilizan materiales reciclados para partes de su casco exterior. No es el caso del ThinkPad P1 Gen 7, sólo se reciclan algunas piezas de plástico como las teclas. Al menos el embalaje del portátil ThinkPad es completamente compostable. Lenovo ofrece un máximo de cinco años de garantía, por lo que también hay cinco años de actualizaciones de software y soporte de piezas de repuesto. El valor de producción de CO₂ del ThinkPad P1 G7 se sitúa en 214 kg/CO₂ equivalente.
Garantía
Como se menciona en la sección de sostenibilidad, la garantía máxima alcanza los cinco años. Nuestra unidad ya viene con tres años de servicio in situ de serie. A nivel internacional, son tres años de garantía in situ.
Dispositivos de entrada: Botones TrackPoint integrados bien realizados por primera vez
Teclado
Lenovo ha rediseñado el teclado retroiluminado de dos niveles del ThinkPad P1 Gen 7 en muchos aspectos.
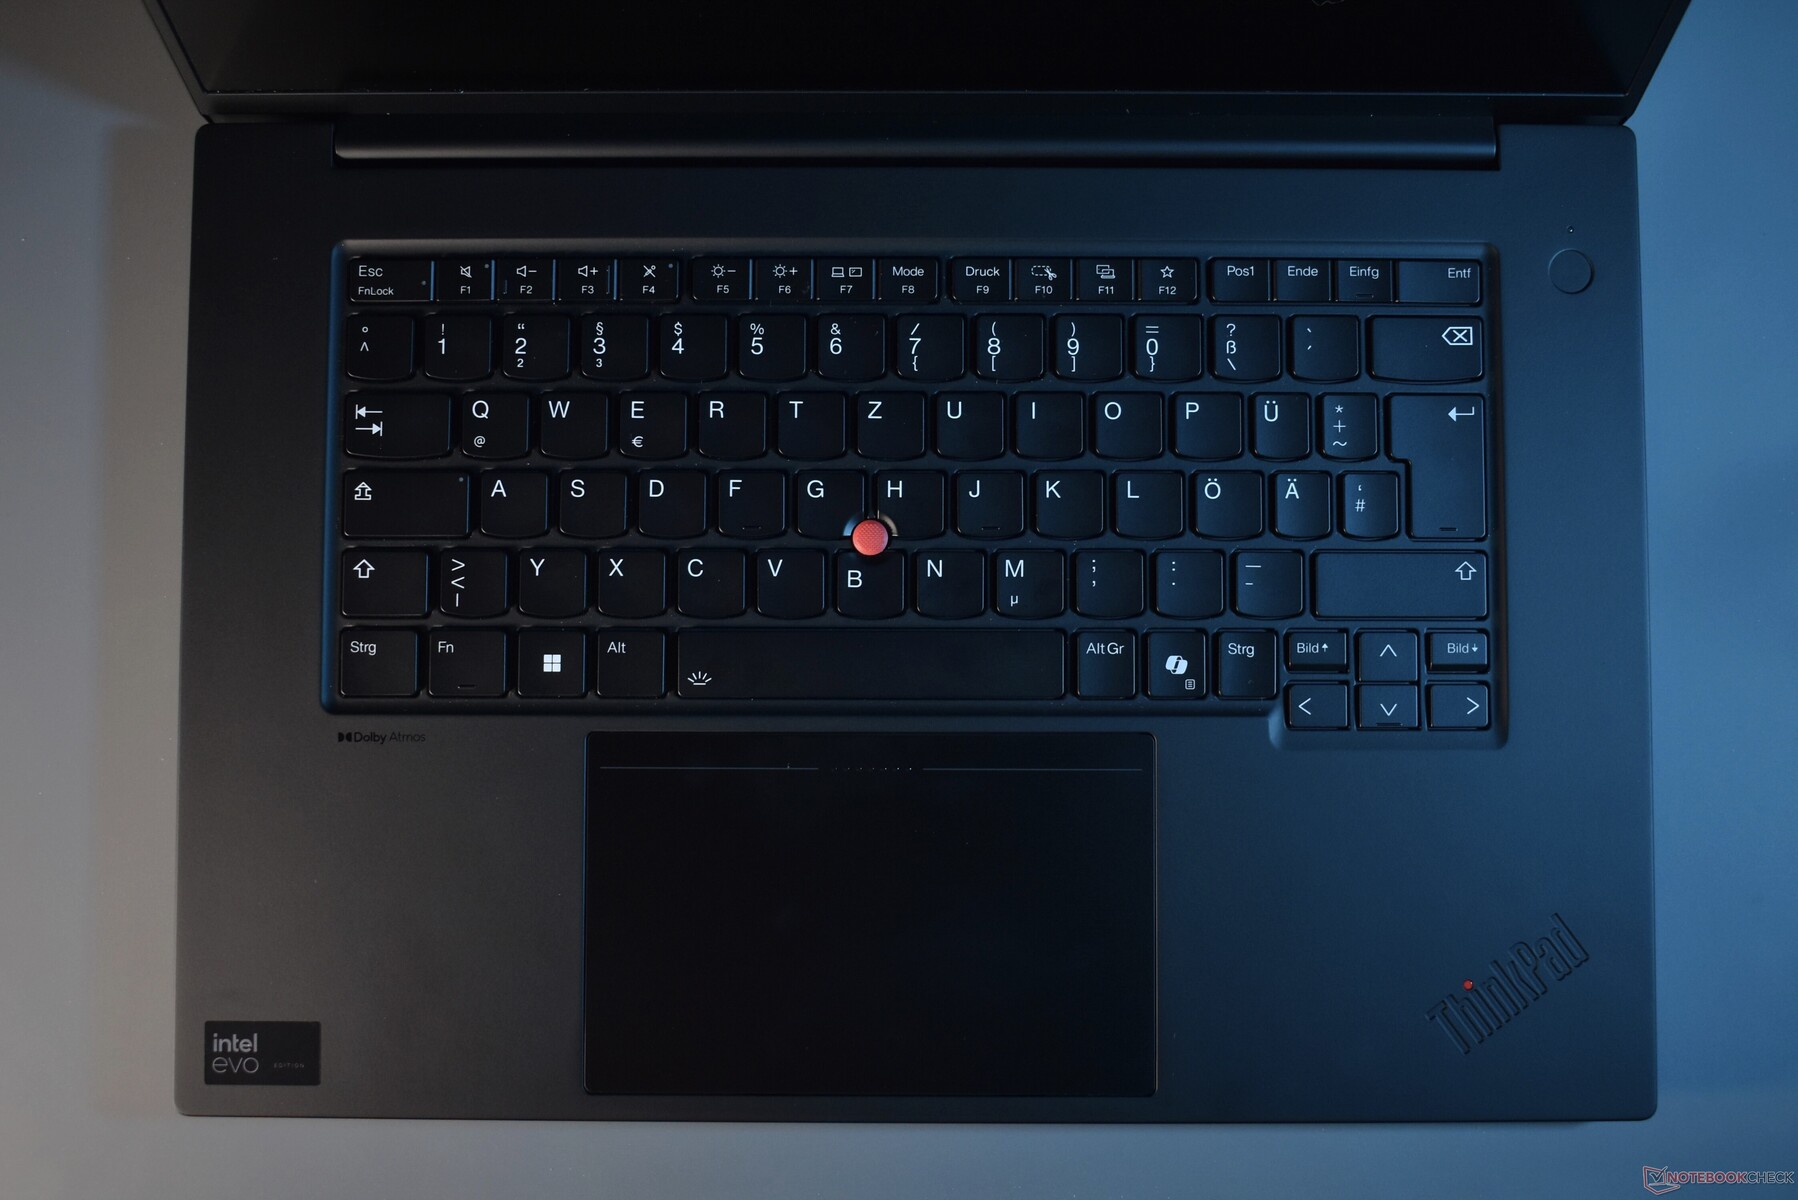
La distancia de desplazamiento sigue siendo la misma, 1,5 mm. El diseño de las teclas también se mantiene, pero Lenovo cambia las teclas exteriores del diseño en forma de sonrisa a uno rectangular, algo que ya hizo en la mayoría de los ThinkPad hace un tiempo. Lo mismo ocurre con el segundo cambio: Lenovo utiliza un teclado ligeramente más pequeño por primera vez en el ThinkPad P1. El nuevo teclado es aproximadamente un centímetro menos ancho. Esto parece extraño, ya que en el ThinkPad P1 hay espacio de sobra. Sin embargo, el ThinkPad P1 Gen 6 fue el último portátil ThinkPad de la gama con la antigua anchura estándar. Al final, el argumento del coste fue probablemente decisivo, ya que fabricar componentes de hardware especializados tiende a ser costoso. Al utilizar una distribución más pequeña como la de los modelos ThinkPad de 14 pulgadas, Lenovo puede compartir piezas entre líneas.
Para los usuarios europeos con la distribución ISO, el nuevo teclado es molesto ya que teclas importantes como las diéresis alemanas Ü y Ä son más pequeñas - en la distribución americana tipo ANSI con la tecla intro más pequeña, es menos problemático. Otras novedades afectan a todos los ThinkPad 2024, como las teclas FN/Ctrl intercambiadas, la tecla Copilot en lugar de PrtScr y los marcadores hápticos en teclas importantes como Intro o las teclas de volumen.
En general, el teclado es estupendo. La fuerza de accionamiento es ligeramente superior a la de otros portátiles ThinkPad, pero nos gusta. Escribir en este teclado es casi tan cómodo como en los ThinkPad más antiguos, a pesar de la menor distancia de recorrido. Con este teclado, escribir durante horas es fácil y sin esfuerzo.
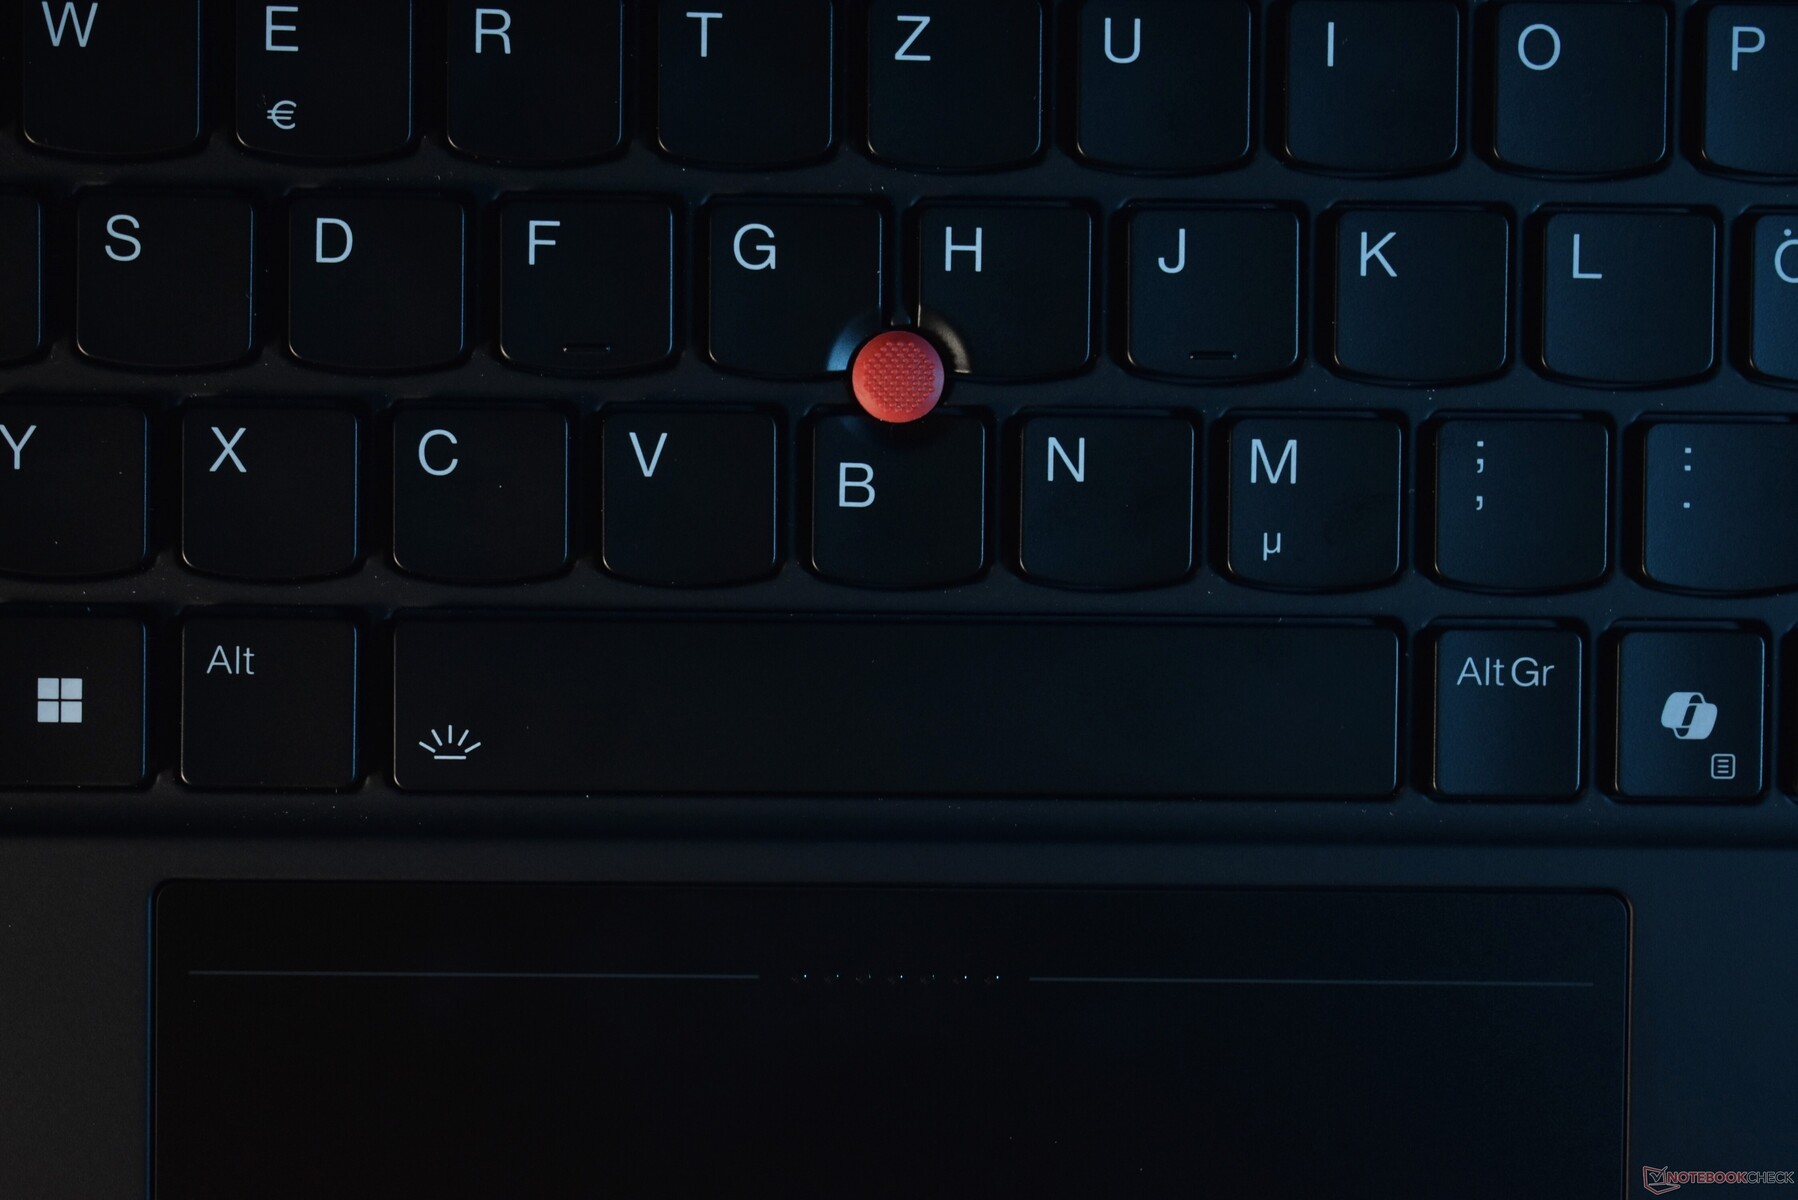
Touchpad y TrackPoint
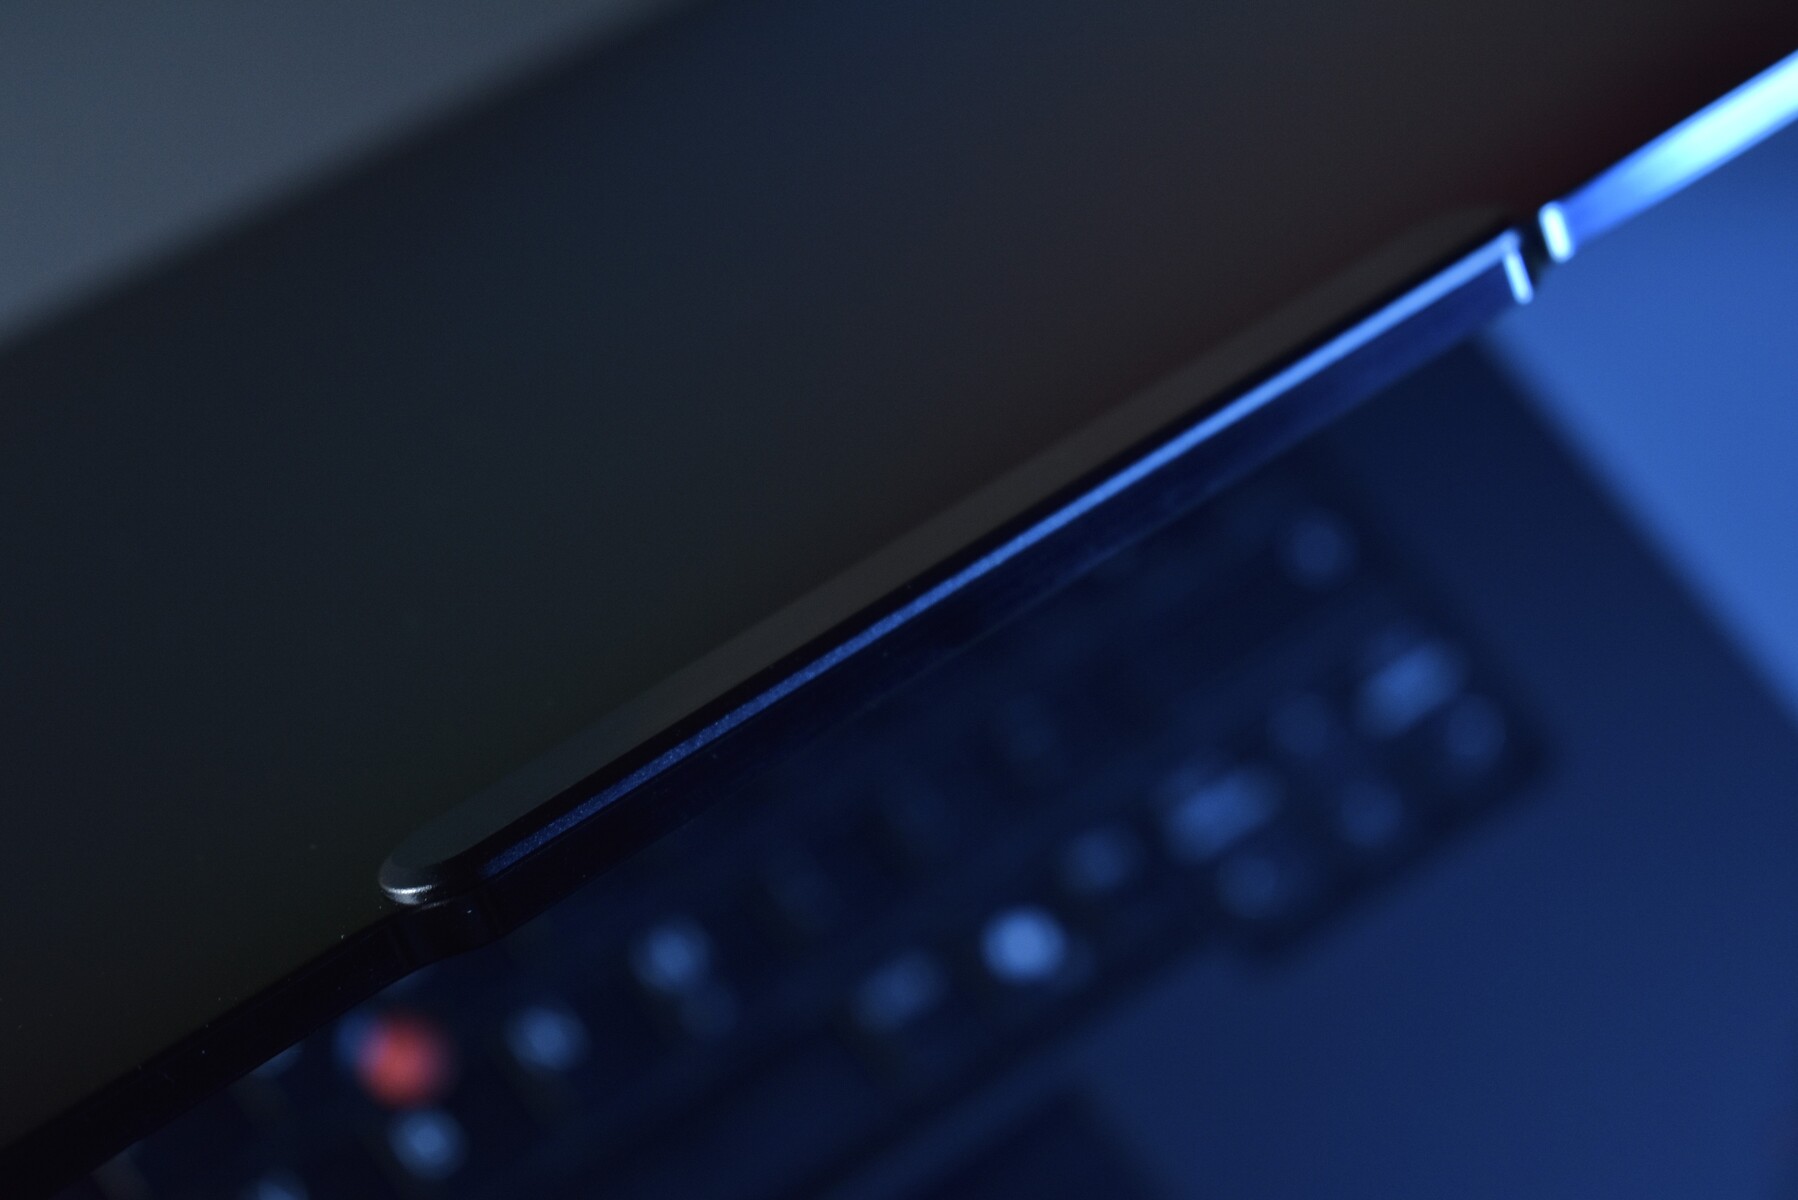
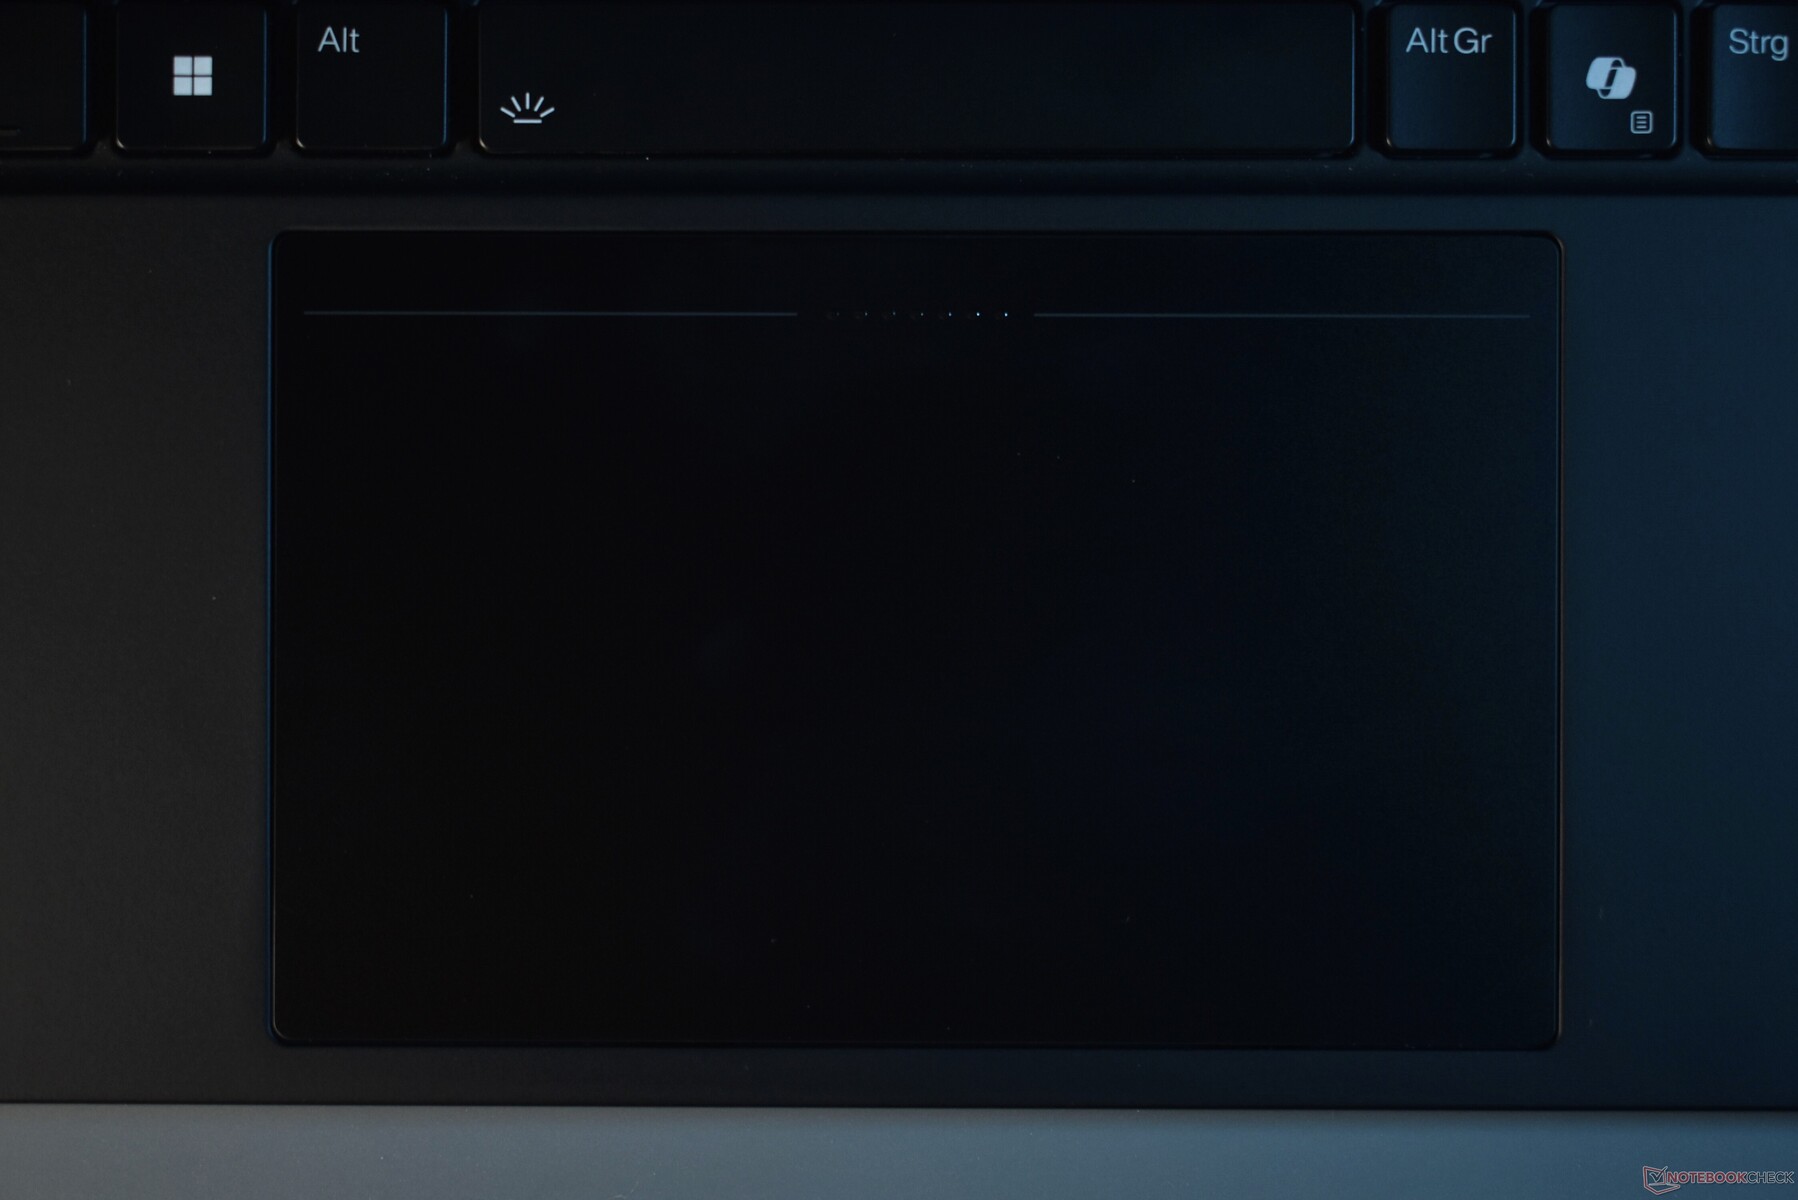
El panel táctil es el área en la que Lenovo se ha inspirado más claramente en el ThinkPad Z16. En lugar de la combinación de botones TrackPoint físicos y un clickpad mecánico como es habitual en el ThinkPad P1, Lenovo incorpora un trackpad háptico en el ThinkPad P1 Gen 7, fabricado por Sensel. Integradas en la superficie hay zonas de clic para el ThinkPad TrackPoint: el P1 Gen 7 cuenta ahora con botones TrackPoint integrados.
Este nuevo diseño permite a Lenovo aumentar el tamaño del touchpad sin sacrificar por completo la función TrackPoint. Con un tamaño de 13,5 x 8,5 cm, es el trackpad más grande de la reciente generación ThinkPad. La superficie es de cristal mate y, al tratarse de un clickpad háptico, puede pulsarse en cualquier lugar. La fuerza del clic se puede disminuir o aumentar en los ajustes de Windows. El efecto háptico también se puede desactivar por completo. El trackpad es sobresaliente en todos los sentidos entre los ThinkPad, jugando en la liga más alta del mercado de portátiles en general.
Si utiliza el TrackPoint rojo para dirigir el puntero del ratón, la parte superior del panel táctil sustituye a los botones dedicados del ratón. Como no hay botones separados, hay que utilizar los pequeños puntos del botón central para orientarse. Esta solución aún no es cien por cien tan buena como los botones dedicados, pero casi. En comparación con la versión anterior de la primera generación de la serie ThinkPad Z, la respuesta háptica es mucho más suave, lo que la hace más agradable de utilizar. La detección de la fuerza también funciona muy bien, con clics erróneos que rara vez ocurren, si es que alguna vez ocurren. Sólo observamos un problema: a veces, el touchpad tiende a congelarse cuando se utiliza con el TrackPoint y cuando una mano se apoya en la superficie del touchpad. Sensel nos prometió que una actualización del firmware solucionará esto en el futuro.
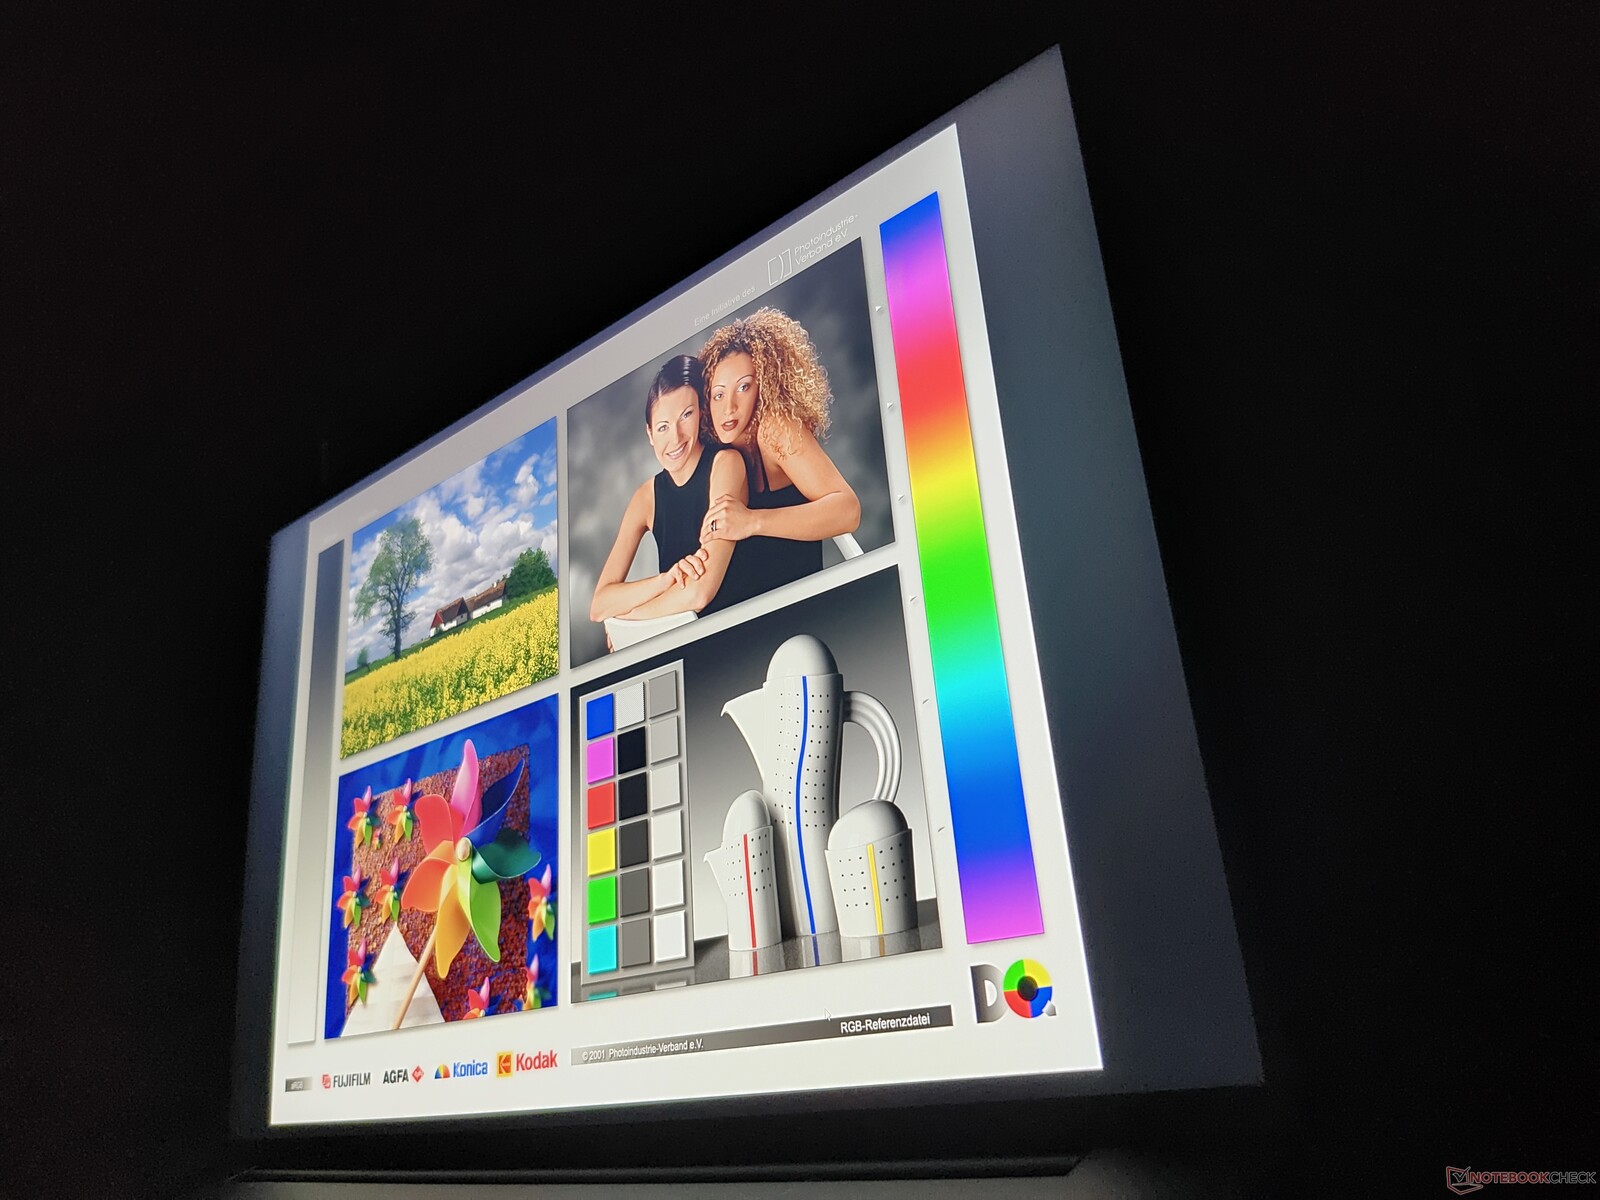
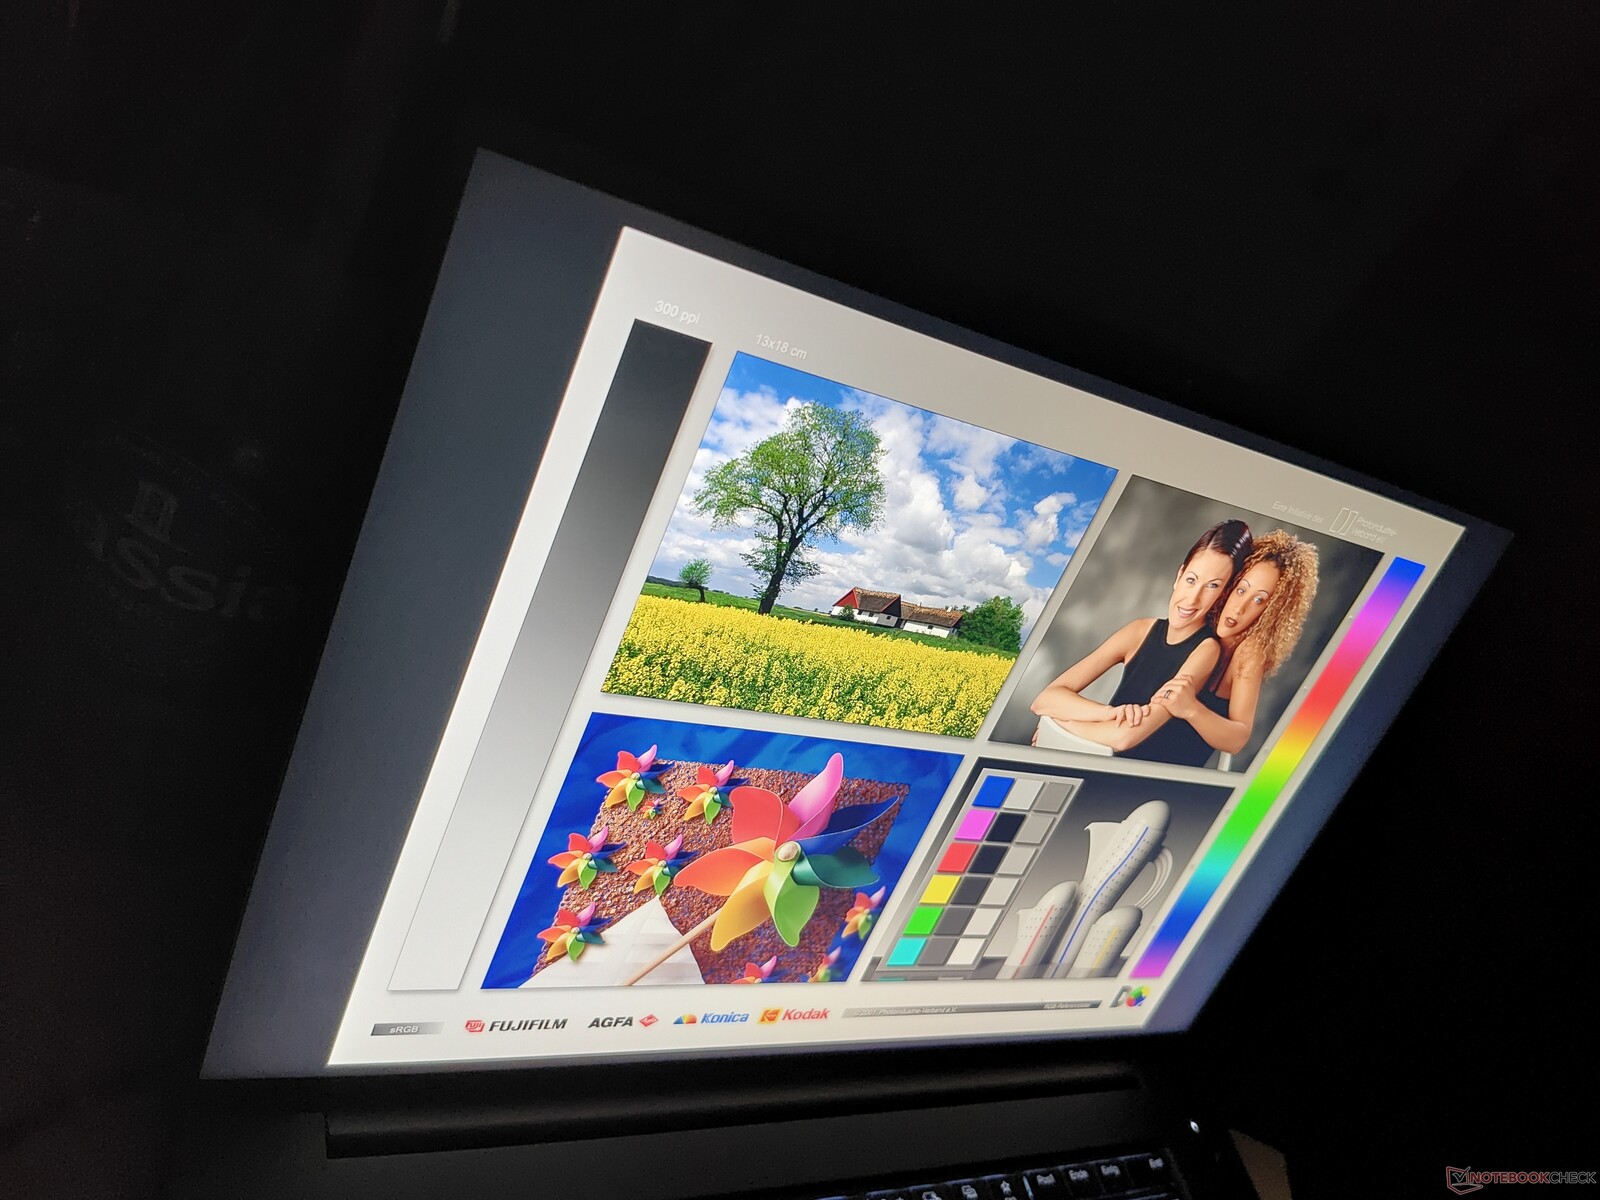
Pantalla: Pantalla rápida de 165 Hz
Lenovo realizó ajustes en muchas áreas, pero no en las pantallas. Las opciones de pantalla apenas cambiaron, siendo el único cambio en comparación con el ThinkPad P1 G6 que la opción de pantalla base es ahora 100 cd/m² más brillante. Todas las pantallas que se ofrecen tienen una relación de aspecto de 16:10 y un formato de 16 pulgadas.
- WUXGA (1.920 x 1.200), IPS, 400 cd/m², 100 % sRGB, mate
- WQXGA (2.560 x 1.600), IPS, 500 cd/m², 100 % sRGB, mate, 165 Hz
- WQUXGA (3.840 x 2.400), OLED, 400 cd/m², 100 % DCI-P3, semimate/semibrillante, HDR
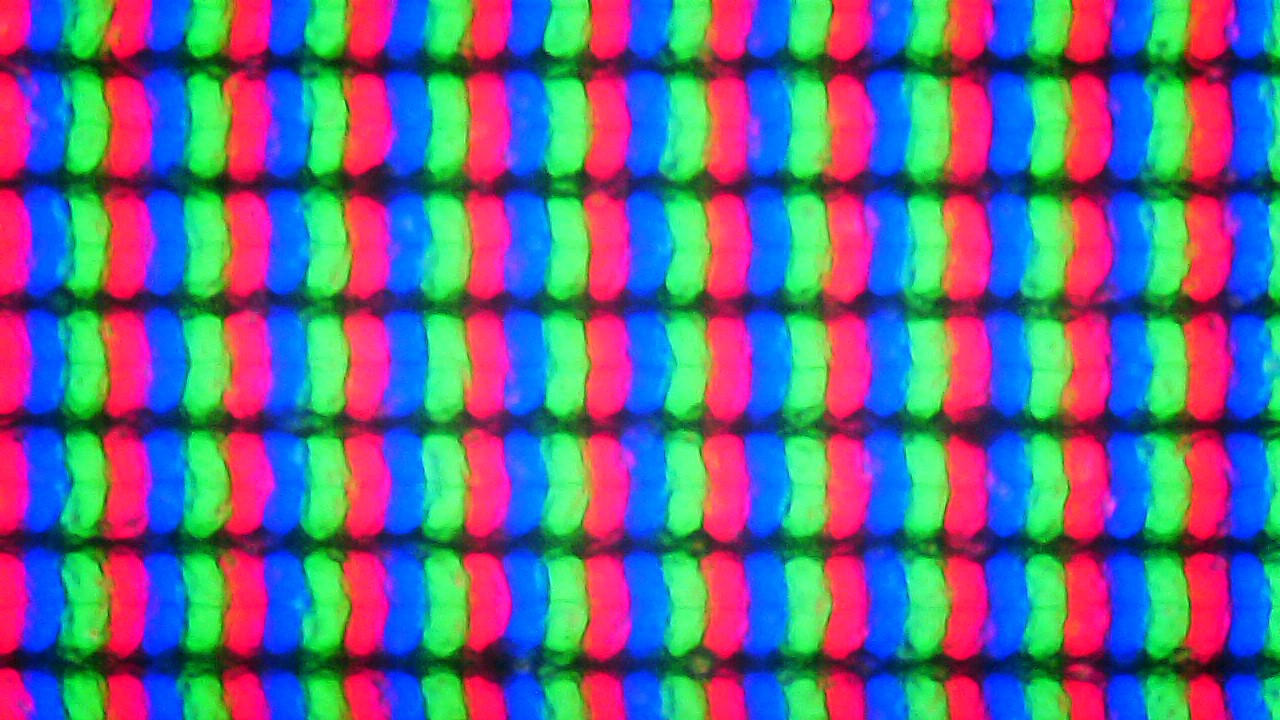
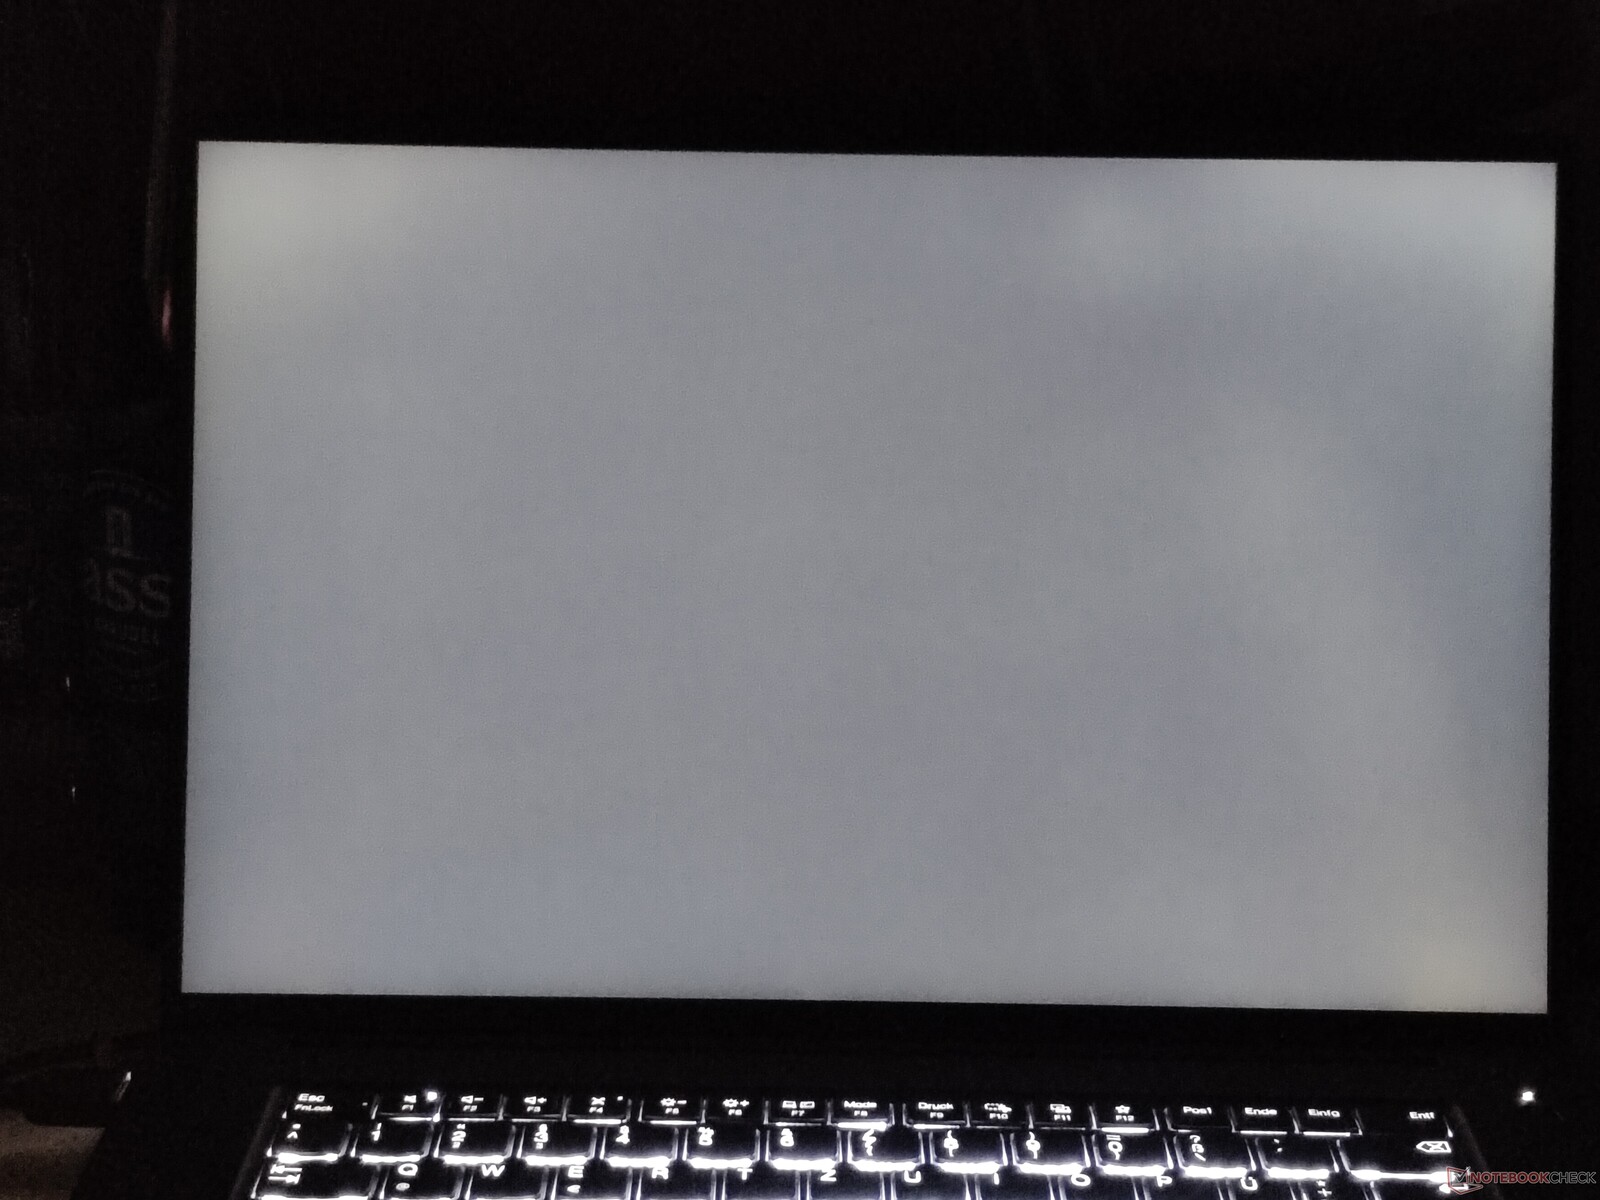
La pantalla LCD utilizada aquí ofrece el brillo prometido de 500 cd/m², con un brillo medio medido de 505 cd/m². Las pantallas OLED de la competencia ensambladas con Windows son superadas ampliamente, pero no así la pantalla miniLED del Apple MacBook Pro 16. En general, este panel no es realmente comparable con los portátiles de la competencia que hemos probado, debido a las diferentes tecnologías y resoluciones. La variante OLED del ThinkPad P1 Gen 7 sería una comparación más adecuada. Al menos, la frecuencia de actualización de 165 Hz está un nivel por encima del resto, aunque las pantallas OLED tienen mejores tiempos de respuesta. En este sentido, el MacBook no puede seguirle el ritmo. Un punto positivo: La pantalla LCD no tiene PWM, a diferencia de la competencia OLED y miniLED.
| |||||||||||||||||||||||||
iluminación: 89 %
Brillo con batería: 516 cd/m²
Contraste: 1259:1 (Negro: 0.41 cd/m²)
ΔE Color 3.5 | 0.5-29.43 Ø4.87, calibrated: 1.2
ΔE Greyscale 5.6 | 0.5-98 Ø5.1
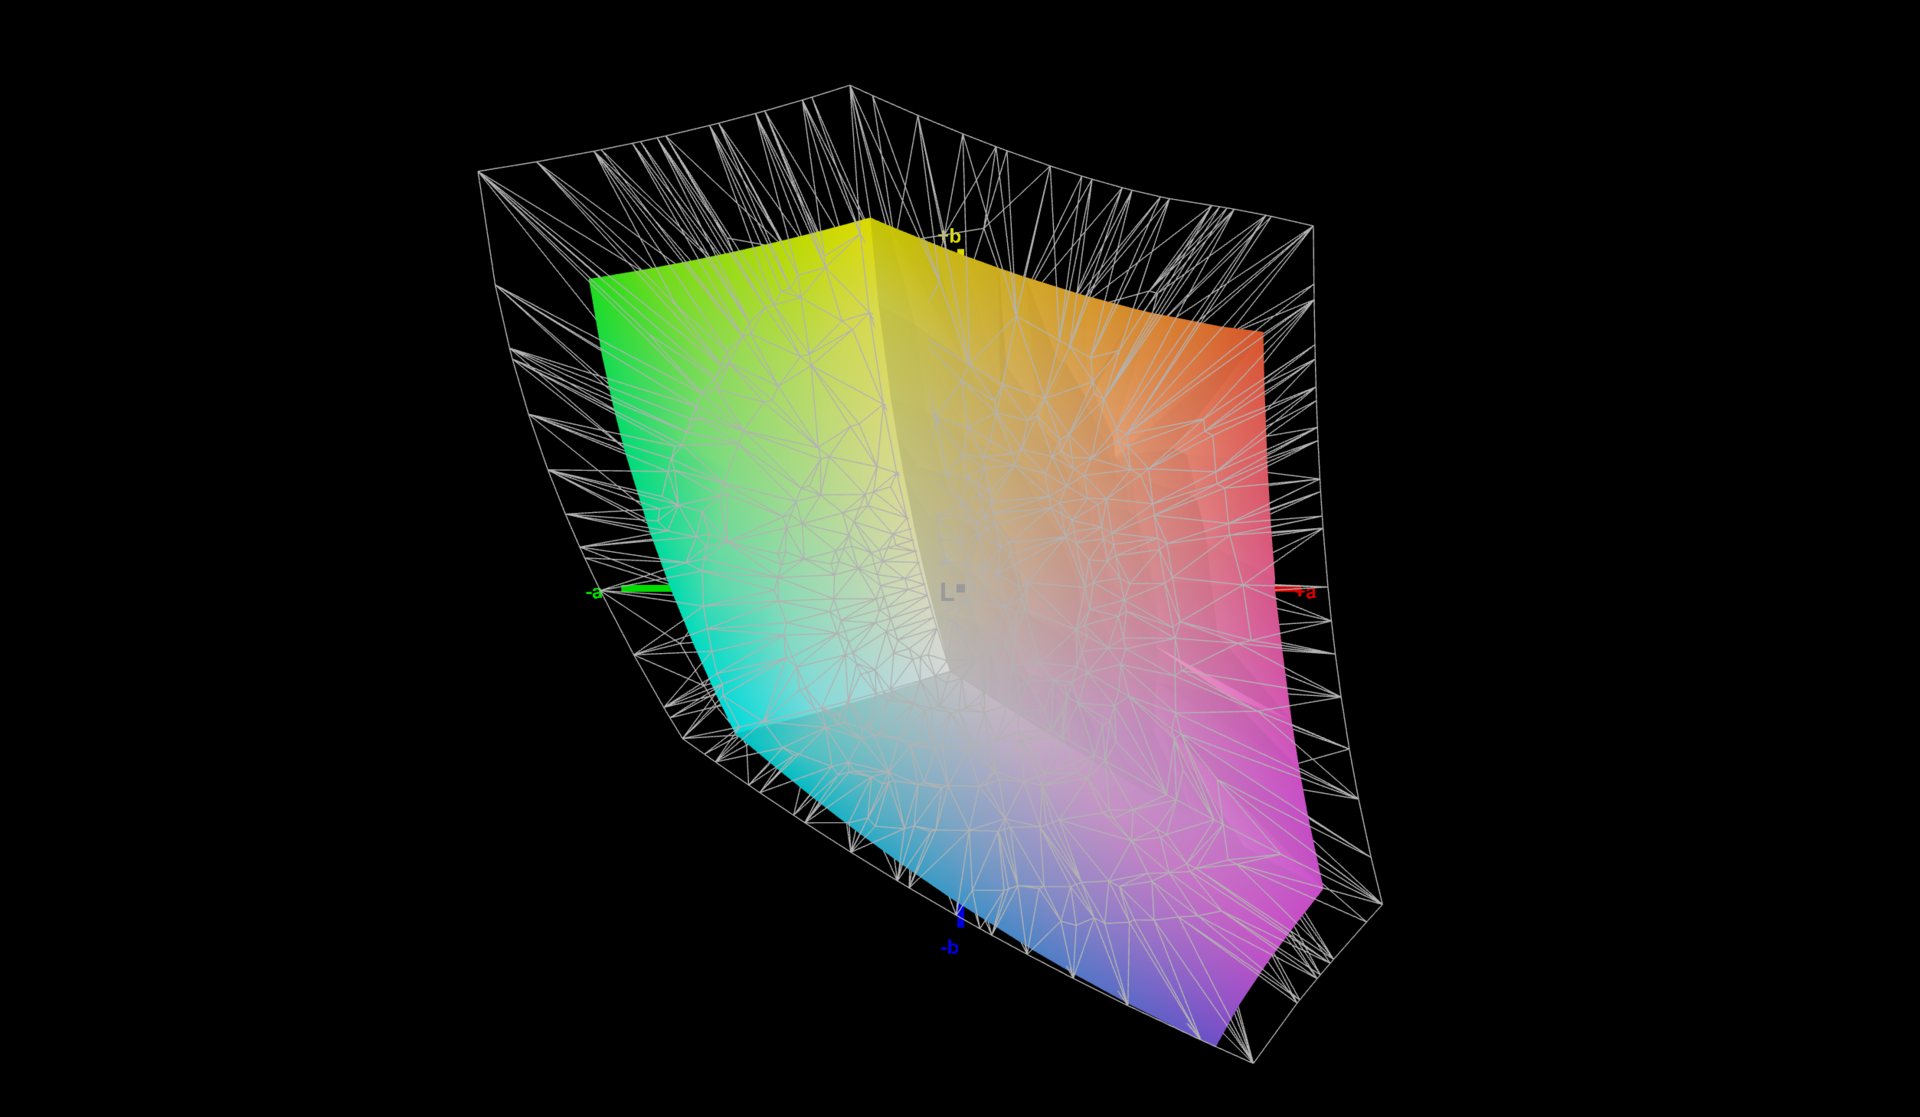
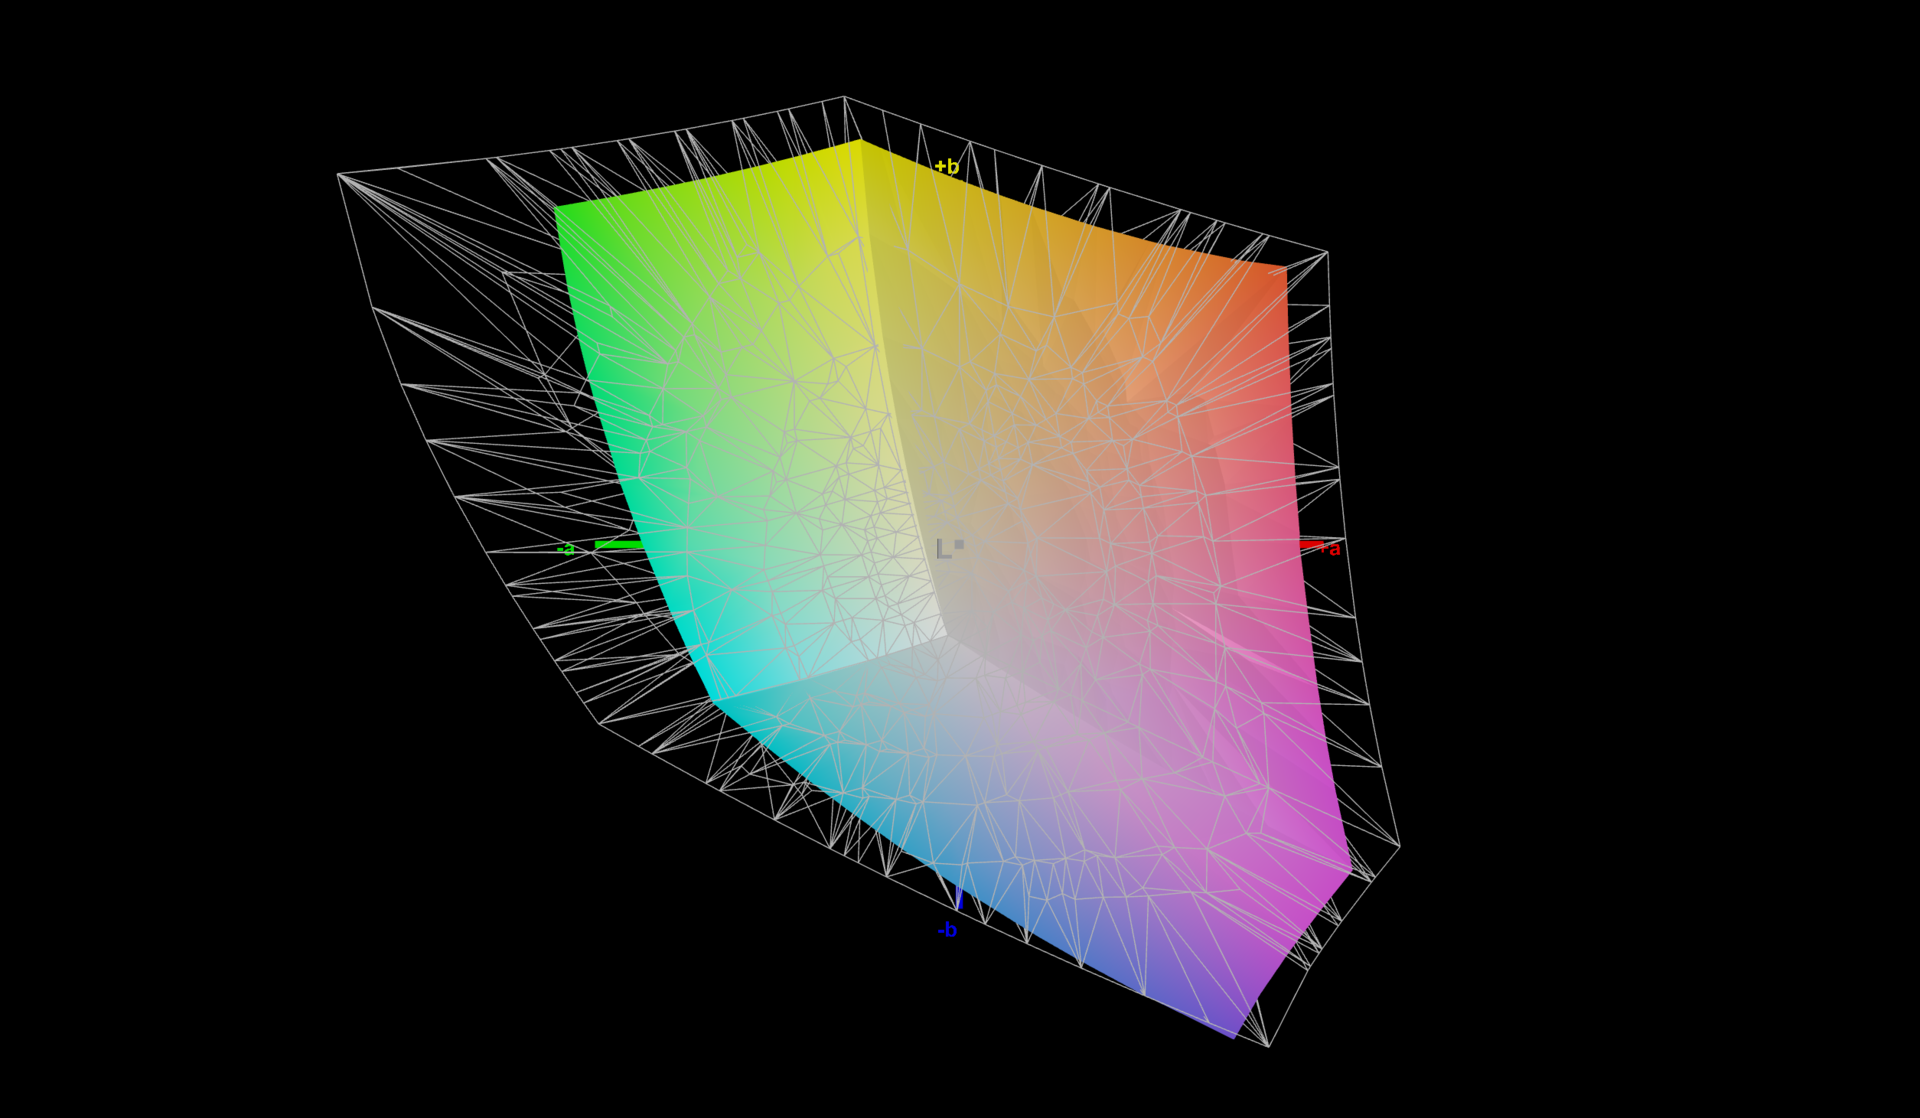
71.8% AdobeRGB 1998 (Argyll 2.2.0 3D)
97.6% sRGB (Argyll 2.2.0 3D)
69.4% Display P3 (Argyll 2.2.0 3D)
Gamma: 2.27
| Lenovo ThinkPad P1 Gen 7 21KV001SGE MNG007DA1-9 , IPS LED, 2560x1600, 16", 165 Hz | Lenovo ThinkPad P1 G6 21FV001KUS Samsung ATNA60YV04-0, OLED, 3480x2400, 16", 60 Hz | Dell XPS 16 9640 SDC4196, OLED, 3840x2400, 16.3", 90 Hz | Dell Precision 5690 Samsung 160YV03, OLED, 3840x2400, 16", 60 Hz | Apple MacBook Pro 16 2023 M3 Max Mini-LED, 3456x2234, 16", 120 Hz | |
|---|---|---|---|---|---|
| Display | 27% | 22% | 27% | 43% | |
| Display P3 Coverage | 69.4 | 99.8 44% | 98.3 42% | 99.8 44% | 99.2 43% |
| sRGB Coverage | 97.6 | 100 2% | 100 2% | 100 2% | |
| AdobeRGB 1998 Coverage | 71.8 | 97.9 36% | 87.8 22% | 96.6 35% | |
| Response Times | 85% | 93% | 85% | -404% | |
| Response Time Grey 50% / Grey 80% * | 11.2 ? | 1.69 ? 85% | 0.82 ? 93% | 1.7 ? 85% | 66.9 ? -497% |
| Response Time Black / White * | 10.6 ? | 1.73 ? 84% | 0.85 ? 92% | 1.7 ? 84% | 43.6 ? -311% |
| PWM Frequency | 60 ? | 360 ? | 60 ? | 14877 | |
| Screen | 28% | 22% | 6% | 41% | |
| Brightness middle | 516 | 375.1 -27% | 366 -29% | 348.1 -33% | 630 22% |
| Brightness | 505 | 379 -25% | 367 -27% | 351 -30% | 604 20% |
| Brightness Distribution | 89 | 98 10% | 96 8% | 97 9% | 94 6% |
| Black Level * | 0.41 | ||||
| Contrast | 1259 | ||||
| Colorchecker dE 2000 * | 3.5 | 1.16 67% | 1.3 63% | 4.18 -19% | 1.2 66% |
| Colorchecker dE 2000 max. * | 8.8 | 2.94 67% | 3.6 59% | 6.68 24% | 2.8 68% |
| Colorchecker dE 2000 calibrated * | 1.2 | 1 17% | 0.97 19% | ||
| Greyscale dE 2000 * | 5.6 | 1.4 75% | 2.2 61% | 1.7 70% | 1.9 66% |
| Gamma | 2.27 97% | 2.2 100% | 2.14 103% | 2.2 100% | 2.29 96% |
| CCT | 6071 107% | 6325 103% | 6680 97% | 6198 105% | 6812 95% |
| Media total (Programa/Opciones) | 47% /
38% | 46% /
34% | 39% /
24% | -107% /
-57% |
* ... más pequeño es mejor
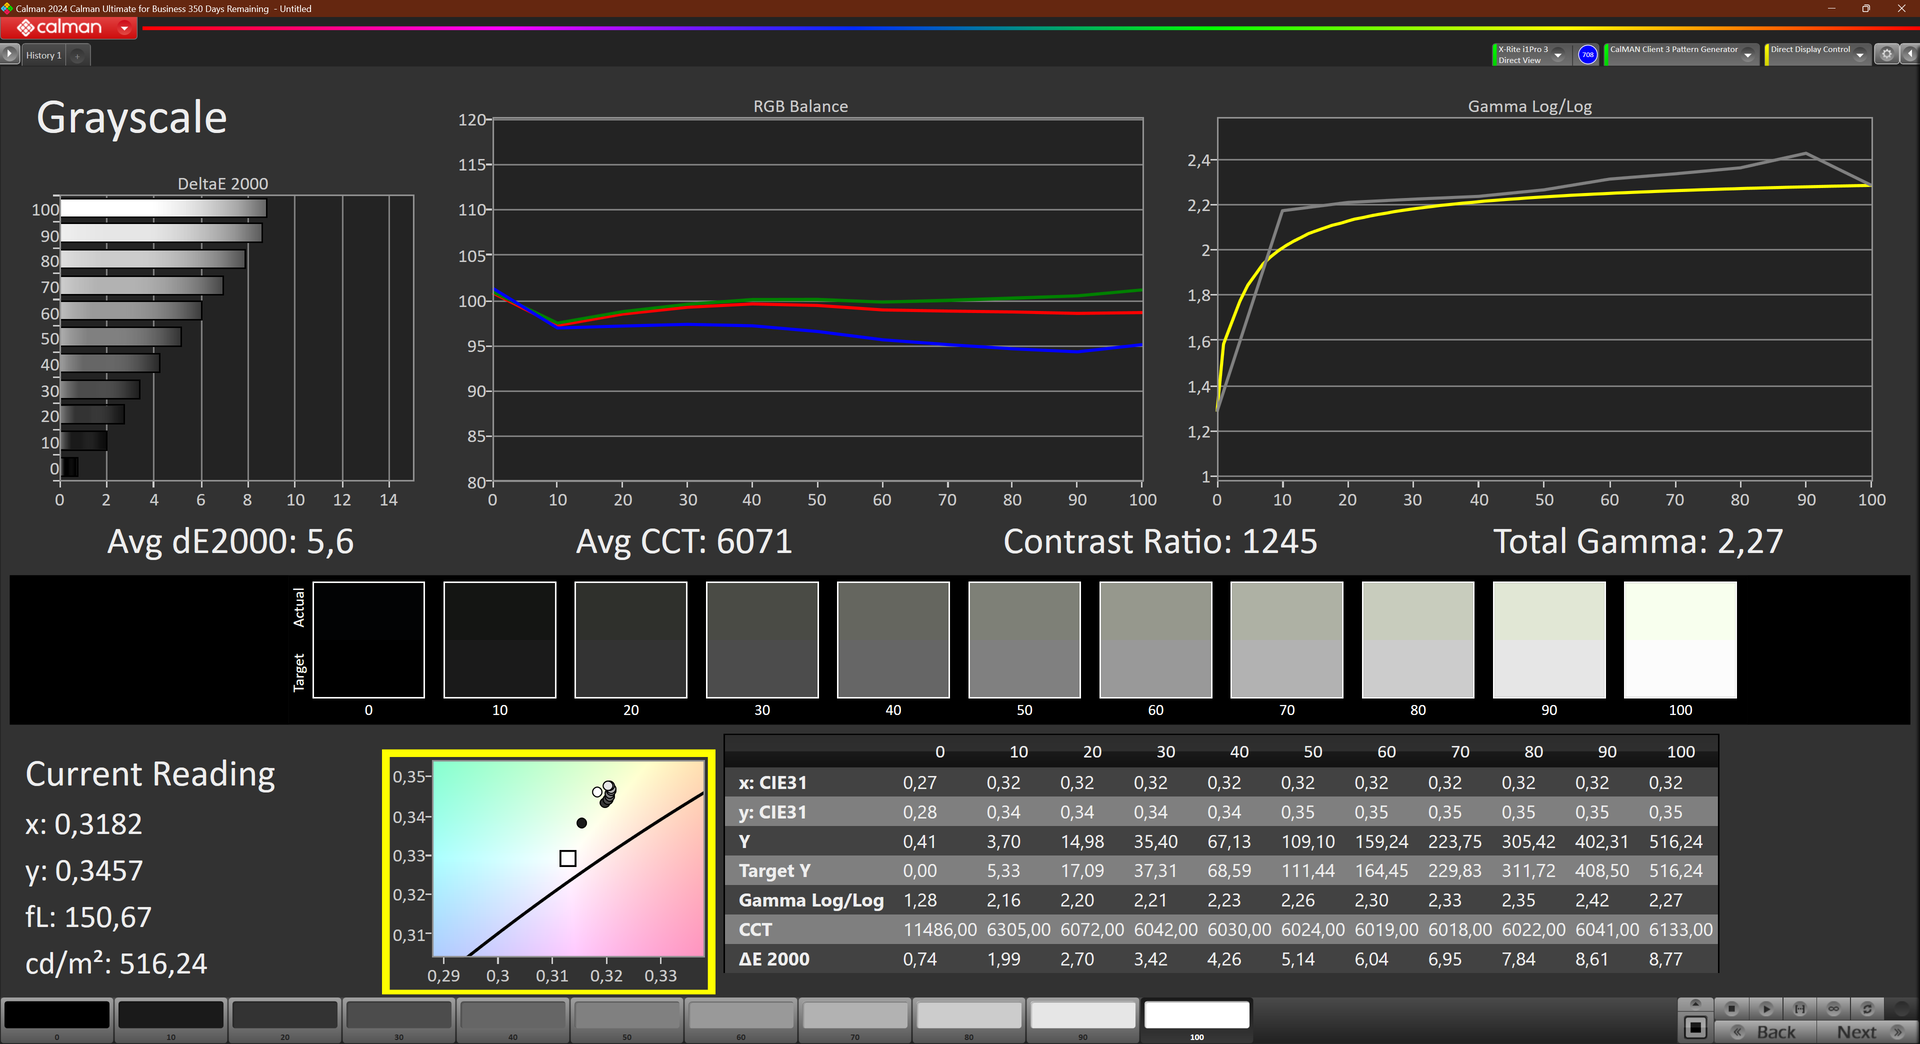
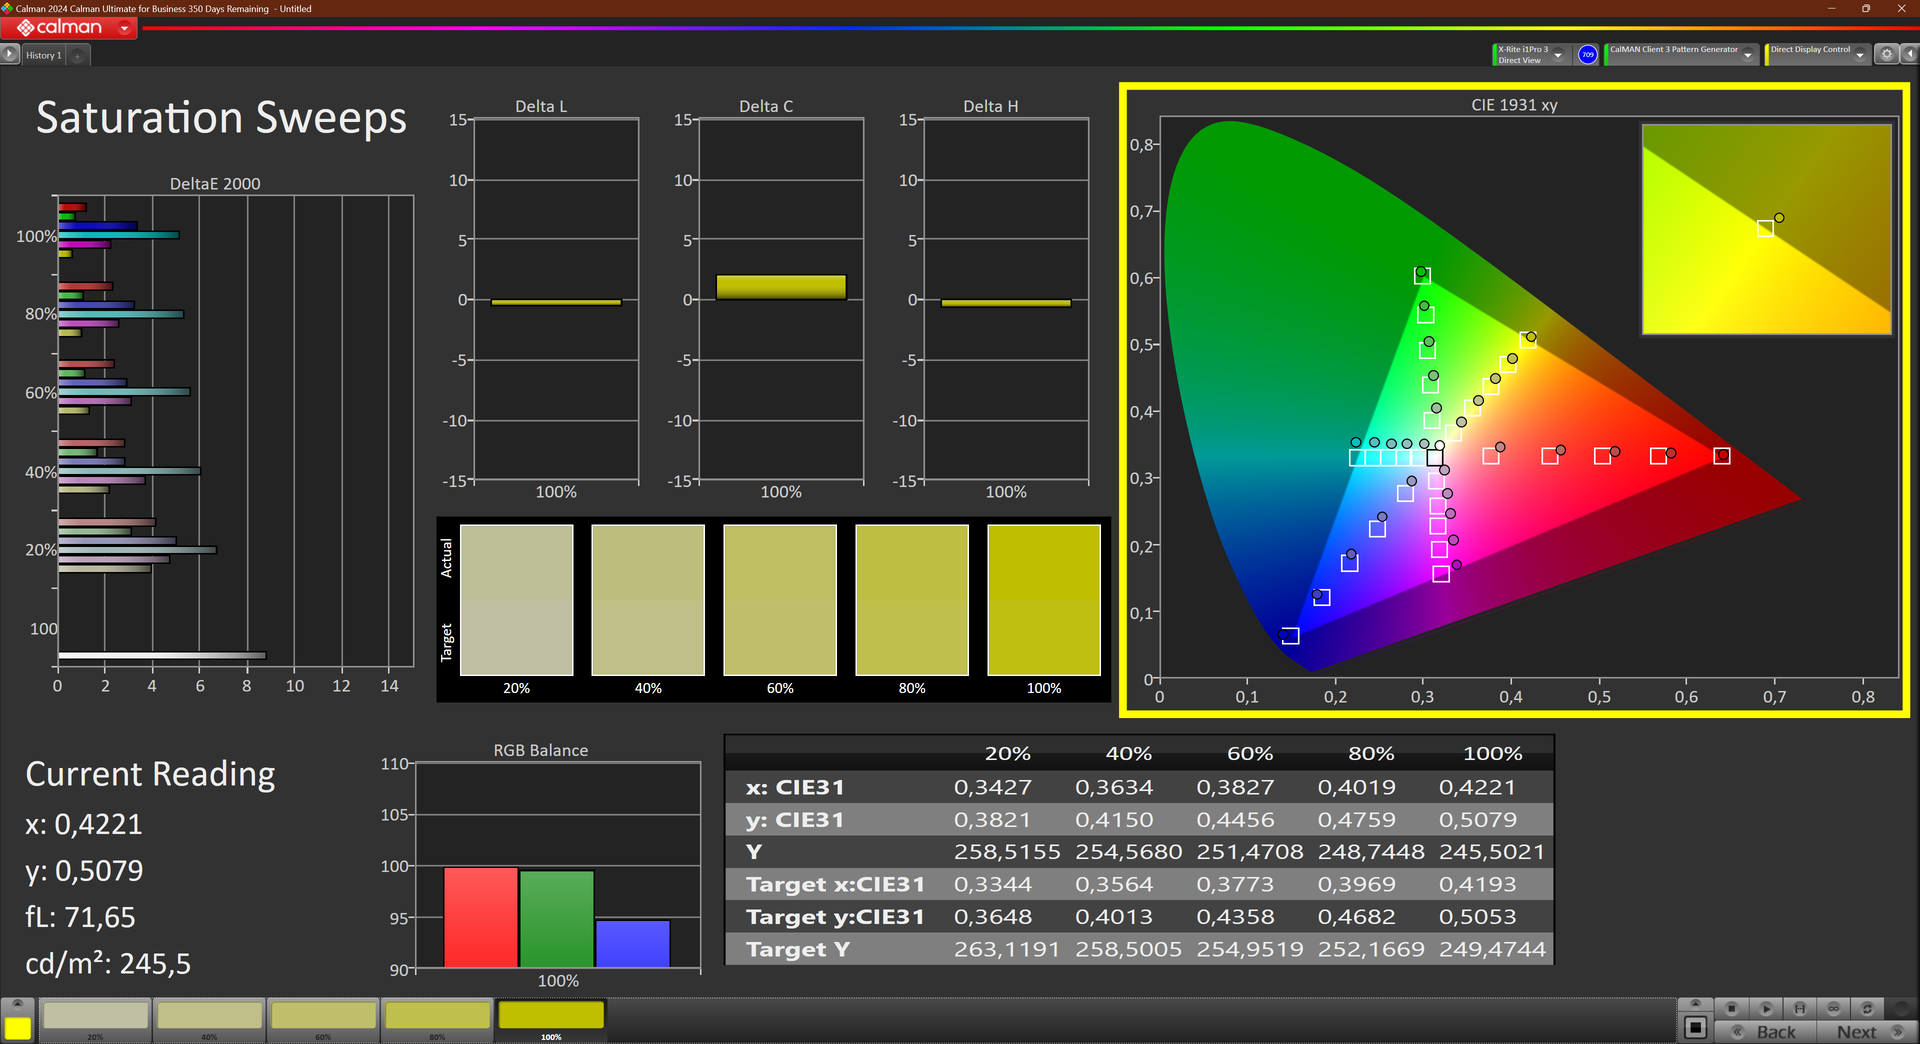
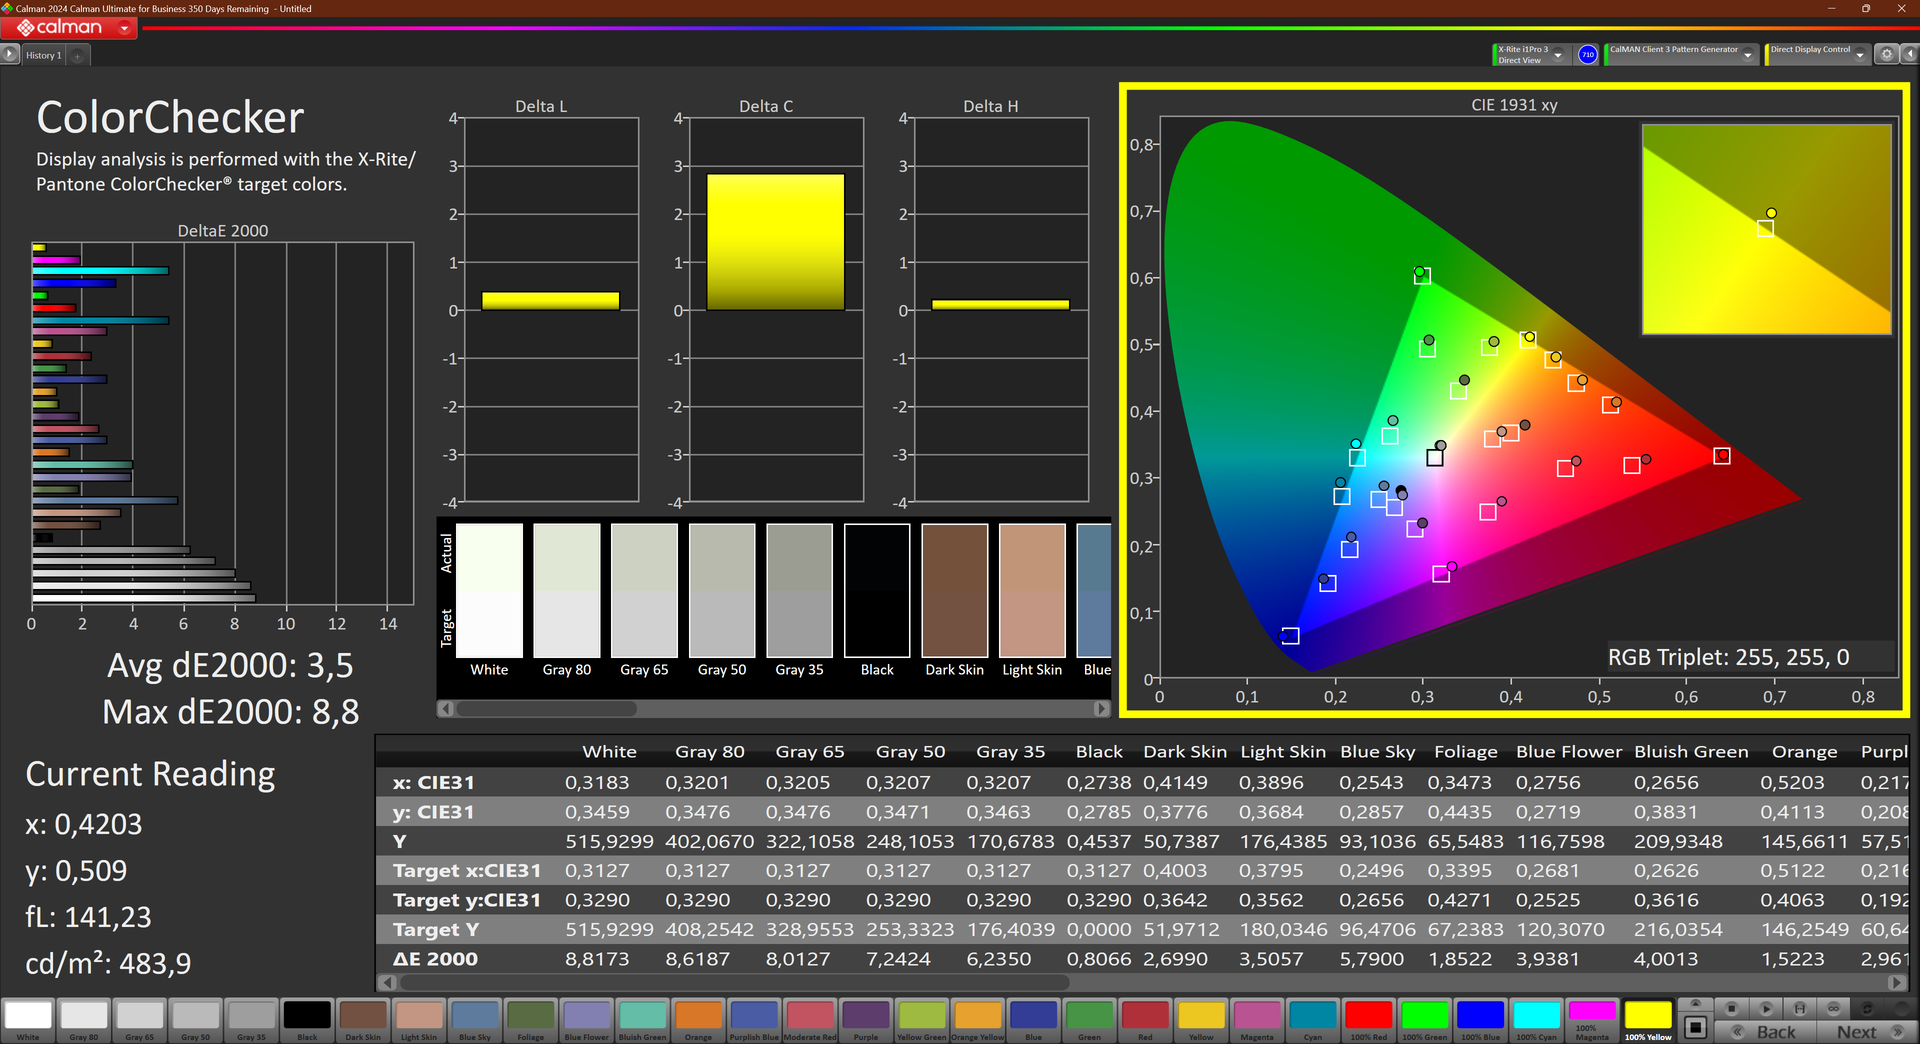
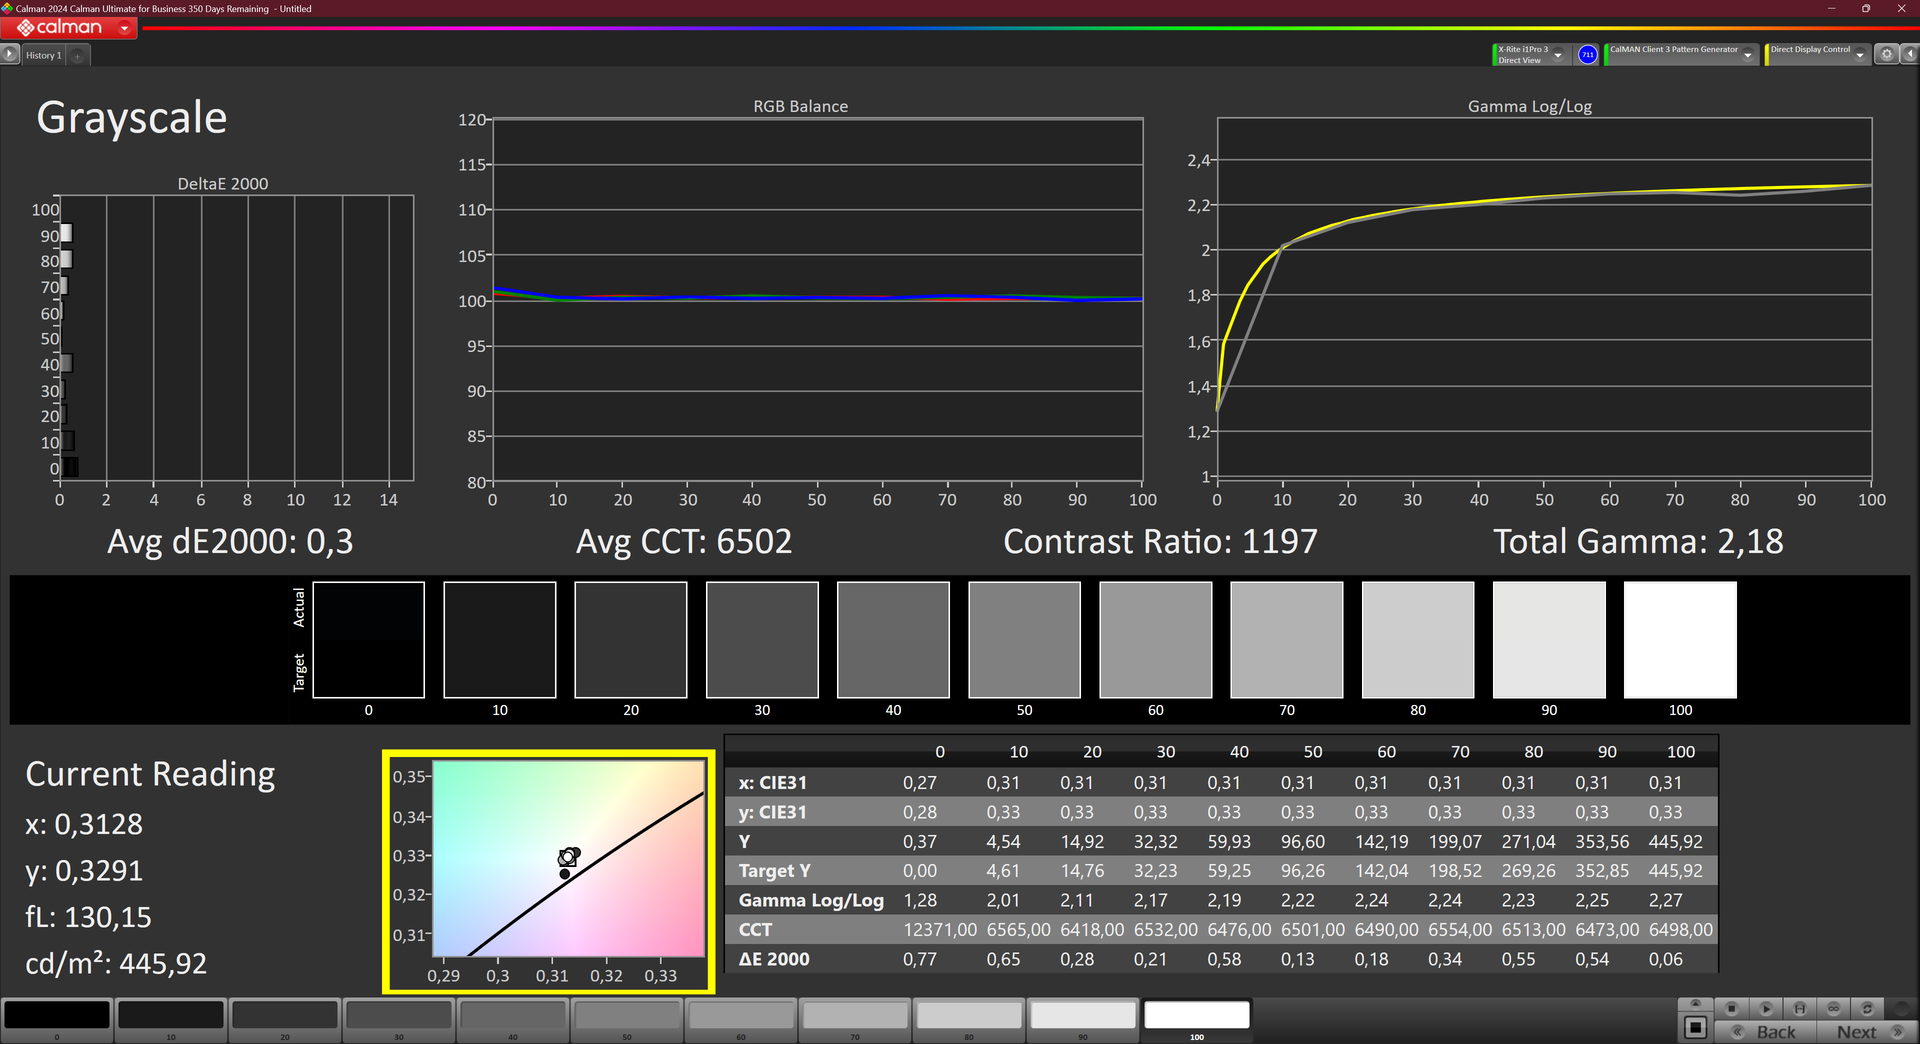
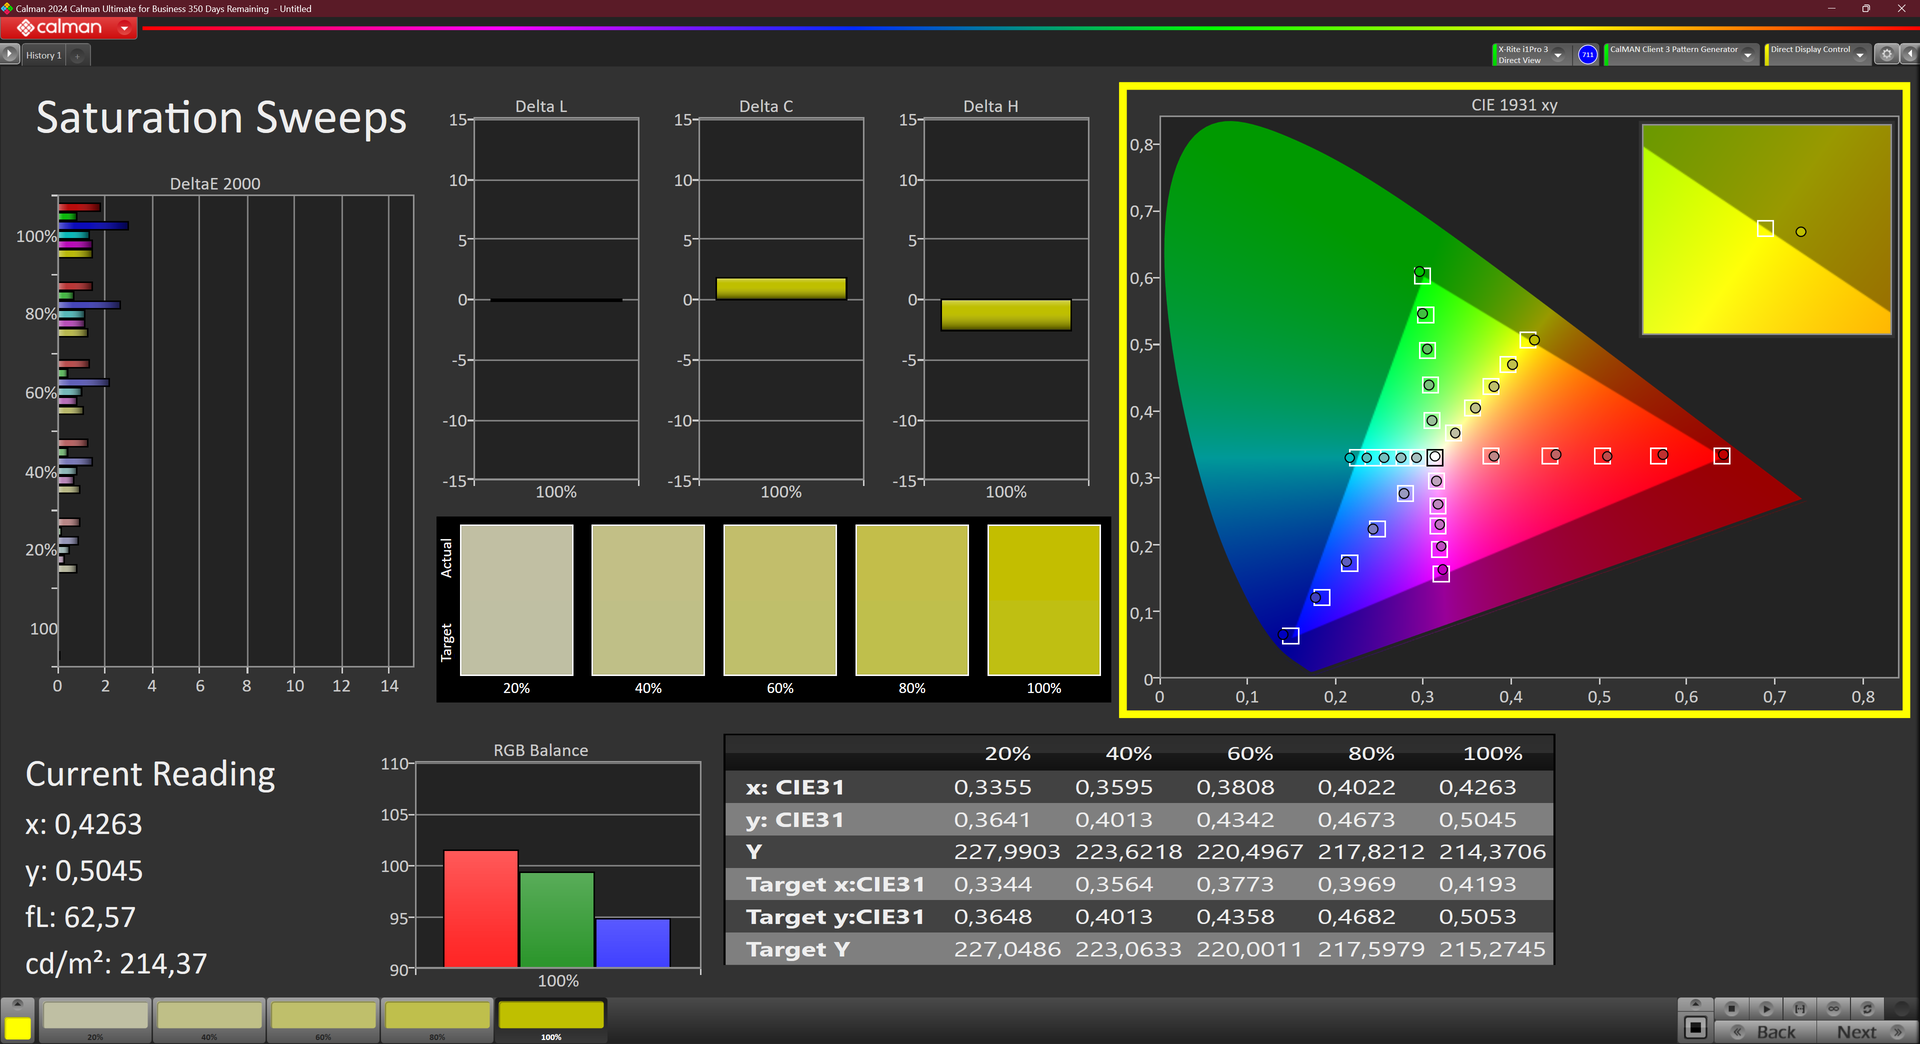

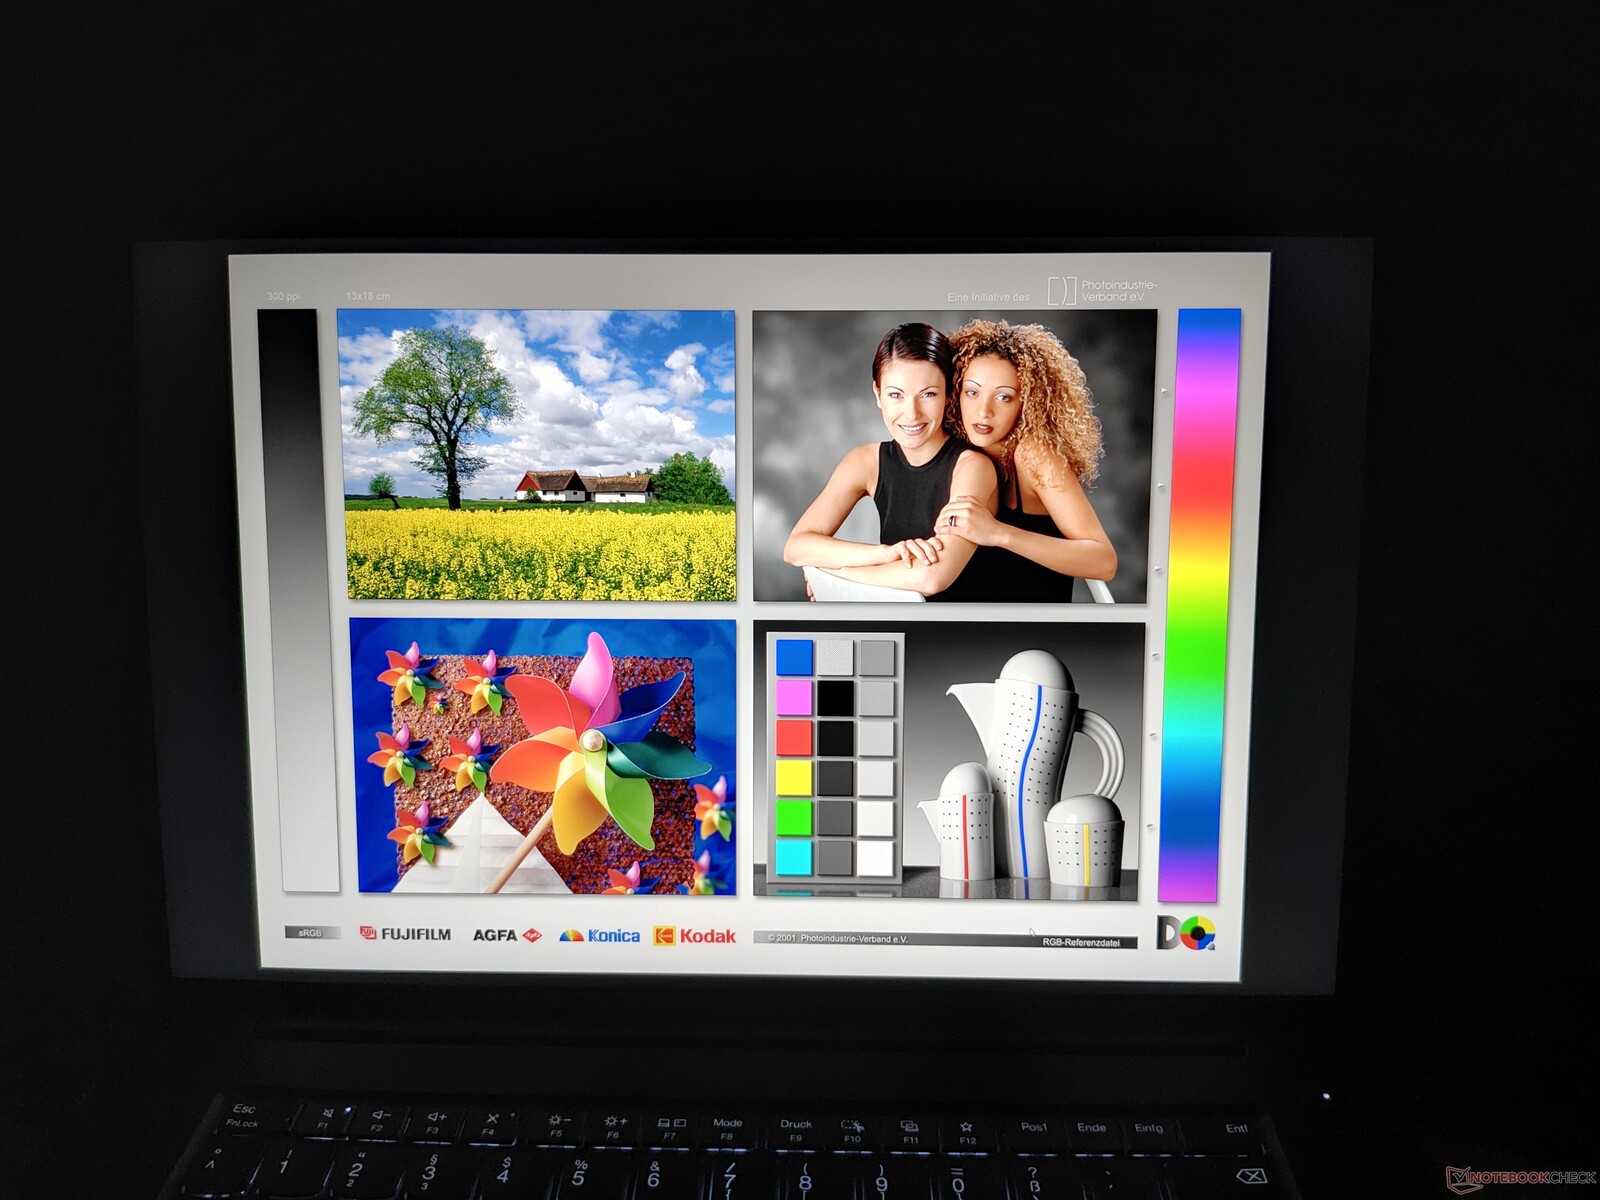
El perfil de color activado de fábrica muestra colores falsos, con los grises demasiado cálidos también. Con una calibración con el X-Rite i1Pro 3, pudimos corregirlo. El deltaE de Colorchecker, que nos da la desviación media de los colores neutros, disminuyó tras la calibración de 3,5 a 1,2.
La pantalla WQXGA del Lenovo ThinkPad P1 Gen 7 cubre el 97% de la gama de colores sRGB. Esto hace que el panel sea adecuado para trabajos sencillos en color. Para cualquier cosa avanzada, el panel OLED debería ser la elección.

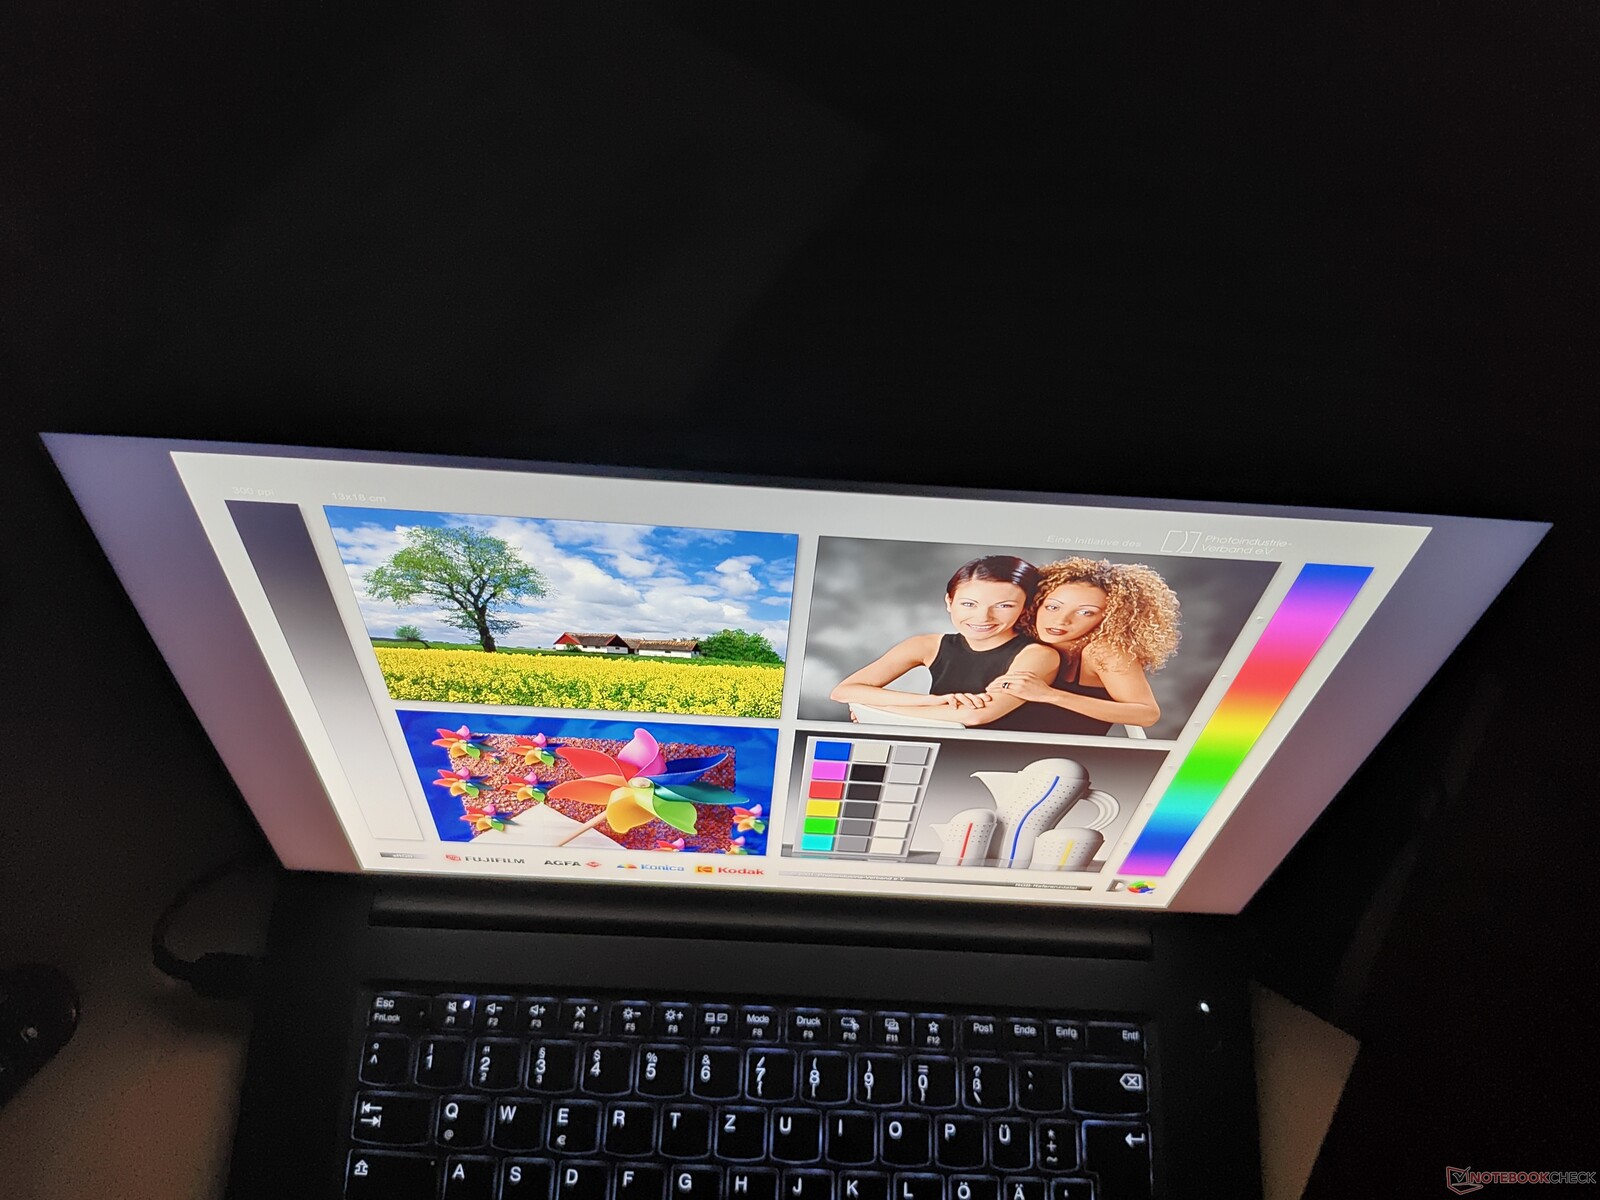
Al utilizar el Lenovo ThinkPad P1 Gen 7 en exteriores, el alto brillo de la pantalla mantiene visible el contenido de la misma. La superficie mate de la pantalla también favorece las capacidades en exteriores.
Tiempos de respuesta del display
| ↔ Tiempo de respuesta de Negro a Blanco | ||
|---|---|---|
| 10.6 ms ... subida ↗ y bajada ↘ combinada | ↗ 6.1 ms subida | 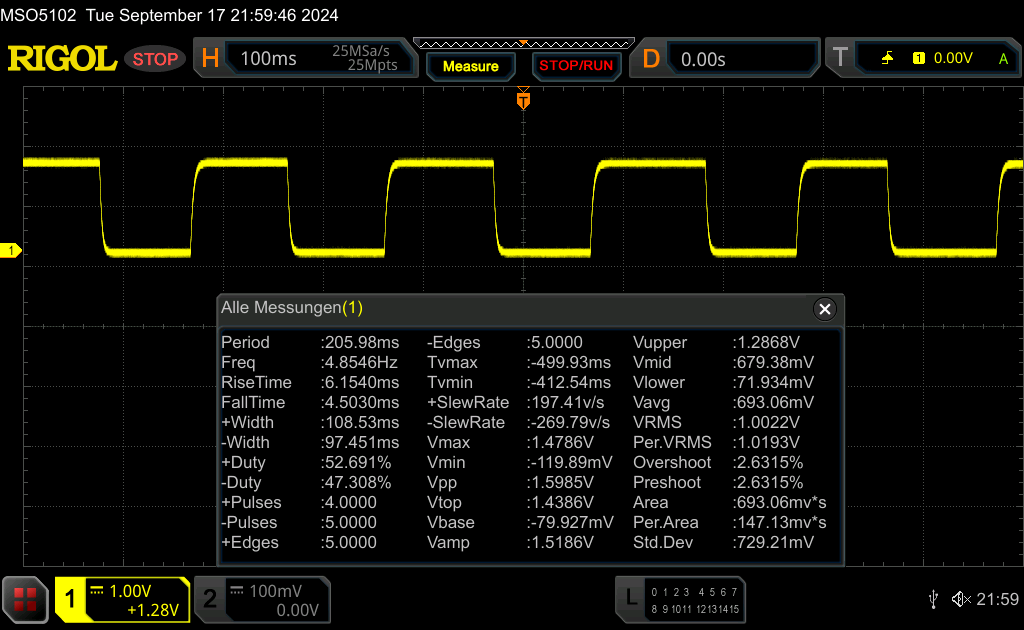 |
| ↘ 4.5 ms bajada | ||
| La pantalla mostró buenos tiempos de respuesta en nuestros tests pero podría ser demasiado lenta para los jugones competitivos. En comparación, todos los dispositivos de prueba van de ##min### (mínimo) a 240 (máximo) ms. » 26 % de todos los dispositivos son mejores. Esto quiere decir que el tiempo de respuesta medido es mejor que la media (20.8 ms) de todos los dispositivos testados. | ||
| ↔ Tiempo de respuesta 50% Gris a 80% Gris | ||
| 11.2 ms ... subida ↗ y bajada ↘ combinada | ↗ 5.6 ms subida | 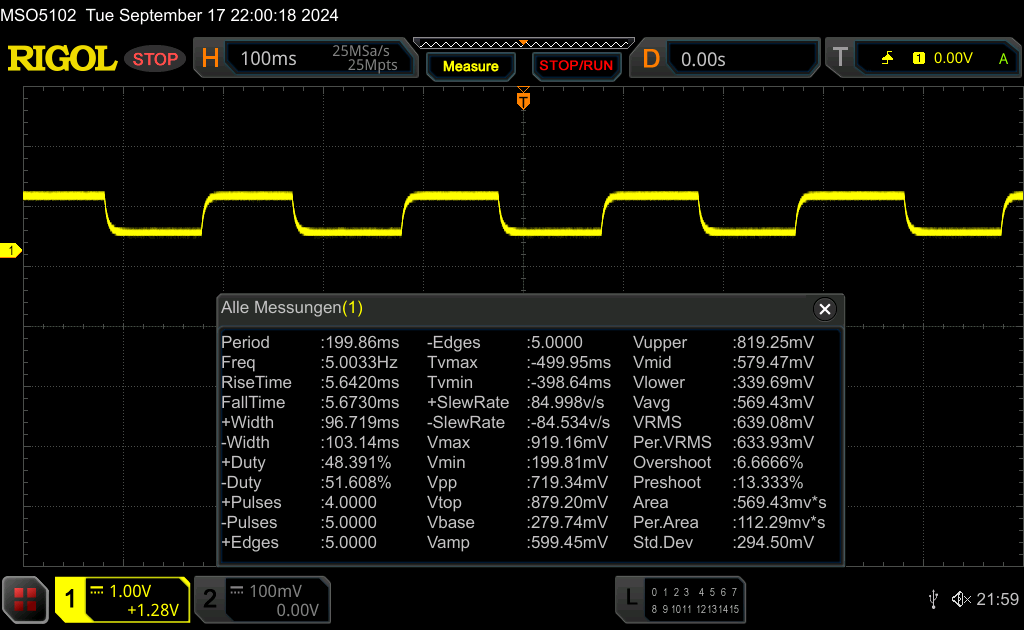 |
| ↘ 5.6 ms bajada | ||
| La pantalla mostró buenos tiempos de respuesta en nuestros tests pero podría ser demasiado lenta para los jugones competitivos. En comparación, todos los dispositivos de prueba van de ##min### (mínimo) a 636 (máximo) ms. » 22 % de todos los dispositivos son mejores. Esto quiere decir que el tiempo de respuesta medido es mejor que la media (32.5 ms) de todos los dispositivos testados. | ||
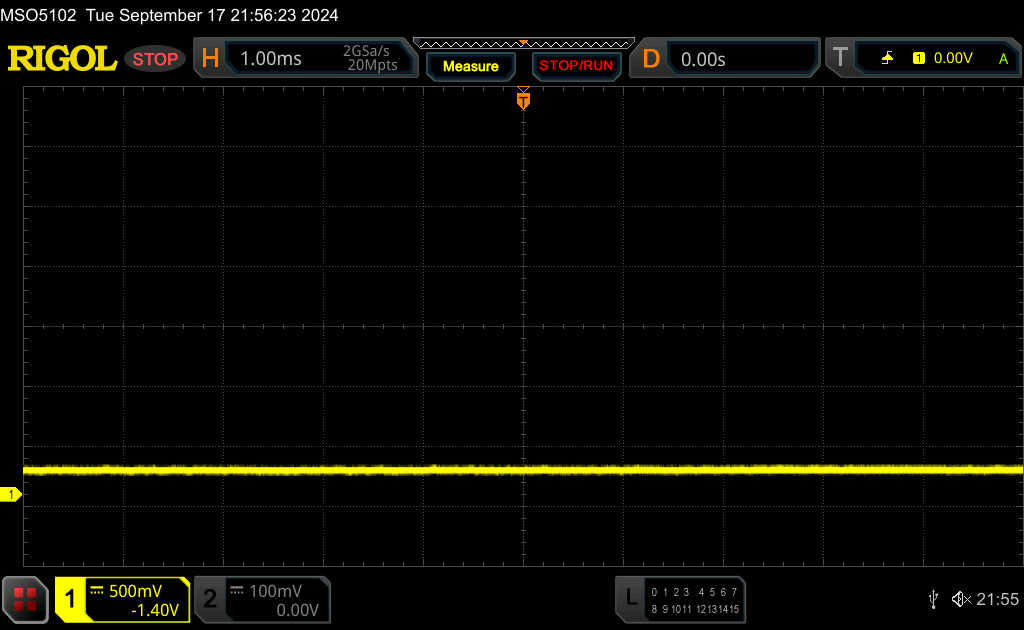
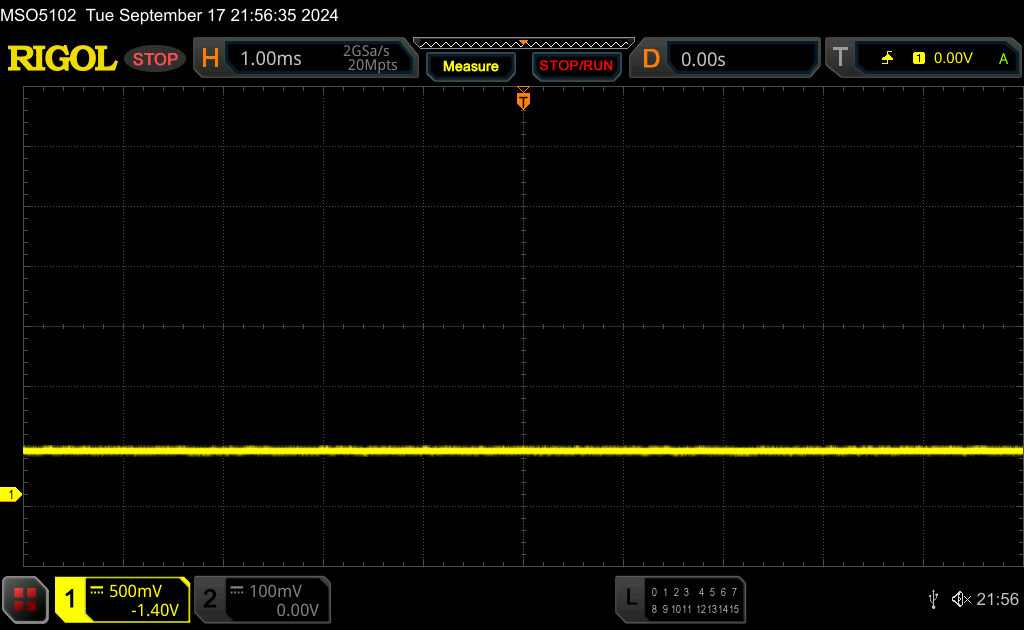
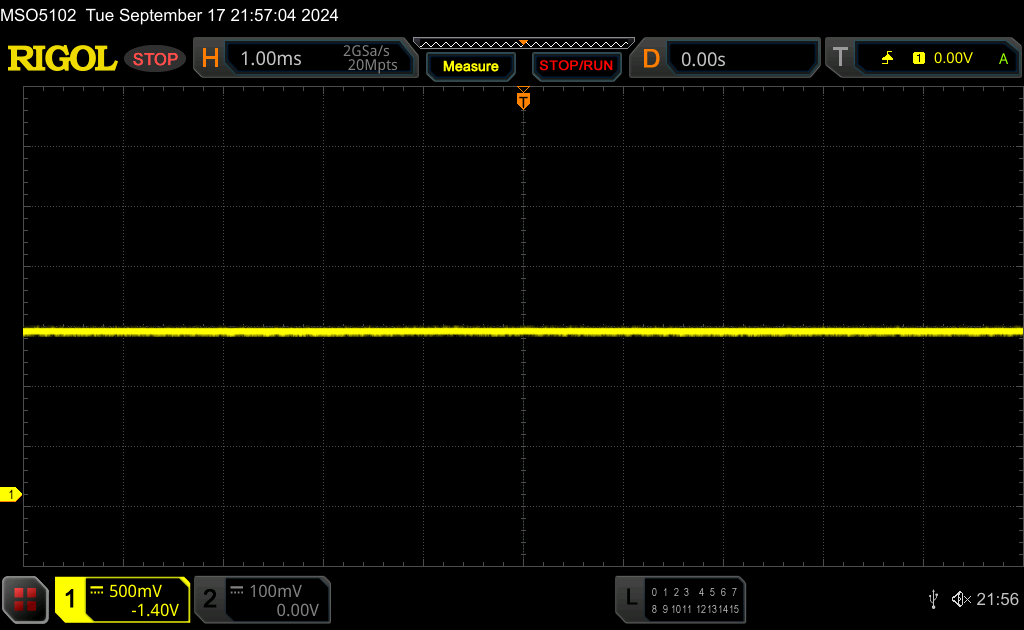
Parpadeo de Pantalla / PWM (Pulse-Width Modulation)
| Parpadeo de Pantalla / PWM no detectado |  | ||
Comparación: 53 % de todos los dispositivos testados no usaron PWM para atenuar el display. Si se usó, medimos una media de 8516 (mínimo: 5 - máxmo: 343500) Hz. | |||
Rendimiento: Meteor Lake sustituye a Raptor Lake
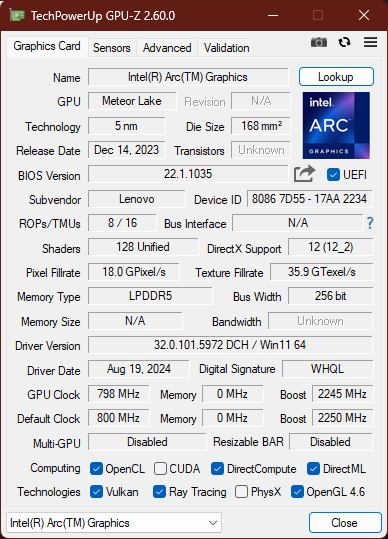
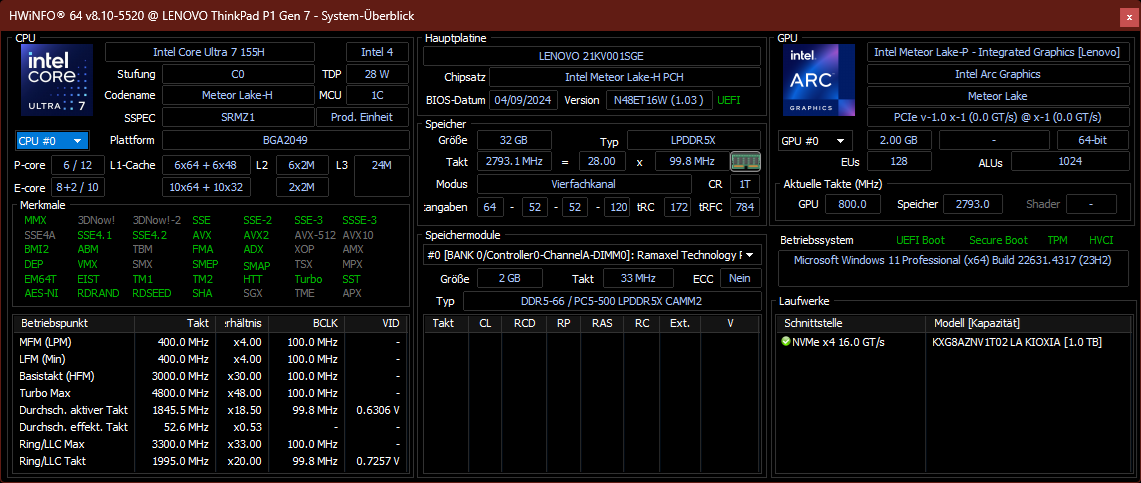
El Lenovo ThinkPad P1 Gen 7 solo se ofrece con CPU Intel, a diferencia del ThinkPad Z16 basado en AMD. En la hoja de especificaciones aparecen cuatro chips Meteor Lake H (Intel Core Ultra 5 135H, Core Ultra 7 155H, Core Ultra 7 165H, Core Ultra 9 185H), todos ellos compatibles con vPro Enterprise excepto el 155H. Aún más completa es la elección de GPU, con tres chips profesionales Nvidia RTX (RTX 1000 Ada, RTX 2000 Ada, RTX 3000 Ada) y dos chips Nvidia GeForce (GeForce RTX 4060, GeForce RTX 4070). Alternativamente, el P1 G7 también se puede configurar sin ninguna dGPU, en cuyo caso el Intel ARC toma el relevo.
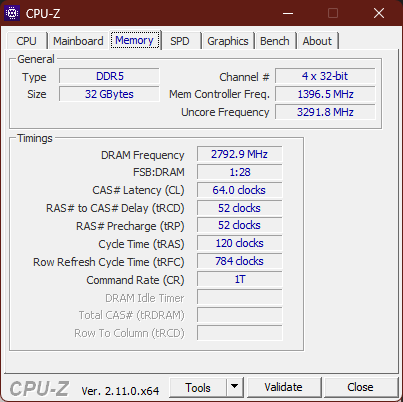
La capacidad de la RAM se sitúa en 16, 32 o 64 GB. El único módulo LPCAMM2 aporta memoria rápida LPDDR5X-7500 al ThinkPad P1 G7, sustituyendo a la DDR5-5600 del predecesor - pero sin soporte ECC, esta característica desaparece. Las dos unidades SSD M.2 2280 se conectan a través de NVMe PCIe 4.0, con un límite máximo de 8 TB (2x 4 TB). Son compatibles con RAID 0/1.
Condiciones de prueba
Los tres perfiles de energía disponibles se pueden seleccionar a través de los ajustes de Windows. Influyen en la configuración del TDP a través de los límites de potencia - siendo el Límite de Potencia 1 (PL1) el consumo de energía bajo carga sostenida y el PL2 el consumo máximo de energía bajo carga a corto plazo.
- La mejor duración de la batería: PL1 25 W / PL2 115 W
- Equilibrada: PL1 50 W / PL2 115 W
- Mejor rendimiento: PL1 70 W / PL2 115 W
La siguiente tabla muestra la diferencia de rendimiento entre los distintos perfiles de energía del ThinkPad P1 Gen 7.
| Perfil energético | PL1 | PL2 | CB R23 Multi | TGP | Time Spy Gráficos | CP 2077 QHD/Ultra | Prueba de estrés | Ruido máx. del ventilador |
|---|---|---|---|---|---|---|---|---|
| Mejor duración de la batería | 25 W | 115 W | 16388 | 45 W | 7150 | 30,3 FPS | CPU: 75 C GPU: 65 C |
43,18 dB(A) |
| Equilibrada | 50 W | 115 W | 17111 | 60 W | 8166 | 33,6 FPS | CPU: 100 C GPU: 80 C |
46,17 dB(A) |
| Mejor rendimiento | 70 W | 115 W | 18762 | 80 W | 9386 | 39,9 FPS | CPU: 103 C GPU: 88 C |
53,27 dB(a) |
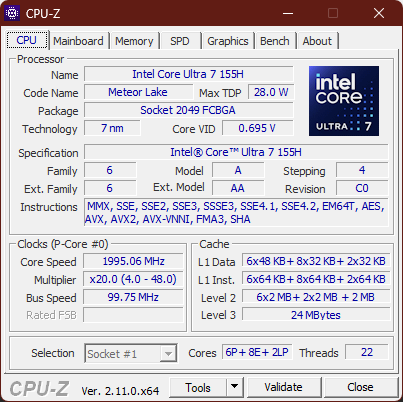
Procesador
Intel Core Ultra 7 155H forma parte de la serie Meteor Lake H centrada en el rendimiento. El consumo de energía típico se sitúa entre 28 y 45 W, pero como vemos con el Lenovo ThinkPad P1 Gen 7, es posible que los OEM establezcan un límite mucho más alto. La CPU tiene 16 núcleos y 22 hilos con hyperthreading, siendo un diseño 6+8+2 con seis grandes núcleos P, ocho núcleos E y dos núcleos E de bajo consumo. Los núcleos tienen velocidades de reloj variables (núcleos P: 1.4 a 4,8 GHz, núcleos E: 0.9 a 3,9 GHz, núcleos LP E: 0.7 a 2,5 GHz). Las comparaciones con otras CPU son posibles con nuestra Lista de CPU.
Los elevados límites de potencia permiten al Lenovo ThinkPad P1 Gen 7 eclipsar a su predecesor P1 Gen 6 en la prueba multinúcleo. La estación de trabajo ThinkPad más reciente también ofrece este rendimiento bajo carga sostenida sin ninguna ralentización. Al ejecutar tareas de un solo núcleo, el P1 Gen 7 pierde frente a su predecesor, ya que Raptor Lake en general supera a Meteor Lake en esta disciplina, con un mayor consumo de energía. En general, el rendimiento de la CPU del P1 Gen 7 es más que suficiente para una estación de trabajo moderna y está más o menos a la par con la competencia de Dell.
En el modo de batería, el rendimiento de la CPU se estrangula ligeramente. Medimos una pérdida de rendimiento del 13 por ciento.
Cinebench R15 Multi Dauertest
Cinebench R23: Multi Core | Single Core
Cinebench R20: CPU (Multi Core) | CPU (Single Core)
Cinebench R15: CPU Multi 64Bit | CPU Single 64Bit
Blender: v2.79 BMW27 CPU
7-Zip 18.03: 7z b 4 | 7z b 4 -mmt1
Geekbench 6.4: Multi-Core | Single-Core
Geekbench 5.5: Multi-Core | Single-Core
HWBOT x265 Benchmark v2.2: 4k Preset
LibreOffice : 20 Documents To PDF
R Benchmark 2.5: Overall mean
| CPU Performance Rating | |
| Apple MacBook Pro 16 2023 M3 Pro -8! | |
| Lenovo ThinkPad P1 G6 21FV001KUS | |
| Dell Precision 5690 | |
| Media de la clase Workstation | |
| Lenovo ThinkPad P1 Gen 7 21KV001SGE | |
| Dell XPS 16 9640 | |
| HP ZBook Power 16 G11 A | |
| Medio Intel Core Ultra 7 155H | |
| Cinebench R23 / Multi Core | |
| Dell Precision 5690 | |
| Lenovo ThinkPad P1 Gen 7 21KV001SGE | |
| Media de la clase Workstation (11507 - 30706, n=25, últimos 2 años) | |
| Dell XPS 16 9640 | |
| Lenovo ThinkPad P1 G6 21FV001KUS | |
| HP ZBook Power 16 G11 A | |
| Apple MacBook Pro 16 2023 M3 Pro | |
| Medio Intel Core Ultra 7 155H (9769 - 19007, n=52) | |
| Cinebench R23 / Single Core | |
| Lenovo ThinkPad P1 G6 21FV001KUS | |
| Apple MacBook Pro 16 2023 M3 Pro | |
| Media de la clase Workstation (1581 - 2178, n=25, últimos 2 años) | |
| Dell Precision 5690 | |
| Lenovo ThinkPad P1 Gen 7 21KV001SGE | |
| Dell XPS 16 9640 | |
| HP ZBook Power 16 G11 A | |
| Medio Intel Core Ultra 7 155H (1496 - 1815, n=52) | |
| Cinebench R20 / CPU (Multi Core) | |
| Dell Precision 5690 | |
| Lenovo ThinkPad P1 Gen 7 21KV001SGE | |
| Media de la clase Workstation (4530 - 11816, n=25, últimos 2 años) | |
| Dell XPS 16 9640 | |
| Lenovo ThinkPad P1 G6 21FV001KUS | |
| HP ZBook Power 16 G11 A | |
| Medio Intel Core Ultra 7 155H (3798 - 7409, n=50) | |
| Cinebench R20 / CPU (Single Core) | |
| Lenovo ThinkPad P1 G6 21FV001KUS | |
| Media de la clase Workstation (612 - 827, n=25, últimos 2 años) | |
| Dell Precision 5690 | |
| Lenovo ThinkPad P1 Gen 7 21KV001SGE | |
| HP ZBook Power 16 G11 A | |
| Dell XPS 16 9640 | |
| Medio Intel Core Ultra 7 155H (601 - 696, n=50) | |
| Cinebench R15 / CPU Multi 64Bit | |
| Dell Precision 5690 | |
| Media de la clase Workstation (1863 - 4784, n=25, últimos 2 años) | |
| Lenovo ThinkPad P1 Gen 7 21KV001SGE | |
| Dell XPS 16 9640 | |
| Lenovo ThinkPad P1 G6 21FV001KUS | |
| HP ZBook Power 16 G11 A | |
| Medio Intel Core Ultra 7 155H (1932 - 2880, n=56) | |
| Apple MacBook Pro 16 2023 M3 Pro | |
| Cinebench R15 / CPU Single 64Bit | |
| Lenovo ThinkPad P1 G6 21FV001KUS | |
| HP ZBook Power 16 G11 A | |
| Media de la clase Workstation (167 - 307, n=25, últimos 2 años) | |
| Dell Precision 5690 | |
| Lenovo ThinkPad P1 Gen 7 21KV001SGE | |
| Dell XPS 16 9640 | |
| Medio Intel Core Ultra 7 155H (99.6 - 268, n=52) | |
| Blender / v2.79 BMW27 CPU | |
| Apple MacBook Pro 16 2023 M3 Pro | |
| Medio Intel Core Ultra 7 155H (175 - 381, n=47) | |
| Dell Precision 5690 | |
| HP ZBook Power 16 G11 A | |
| Media de la clase Workstation (102 - 270, n=25, últimos 2 años) | |
| Lenovo ThinkPad P1 G6 21FV001KUS | |
| Dell XPS 16 9640 | |
| Lenovo ThinkPad P1 Gen 7 21KV001SGE | |
| 7-Zip 18.03 / 7z b 4 | |
| Dell Precision 5690 | |
| Media de la clase Workstation (51096 - 109760, n=25, últimos 2 años) | |
| Lenovo ThinkPad P1 G6 21FV001KUS | |
| Lenovo ThinkPad P1 Gen 7 21KV001SGE | |
| Dell XPS 16 9640 | |
| HP ZBook Power 16 G11 A | |
| Medio Intel Core Ultra 7 155H (41739 - 70254, n=50) | |
| 7-Zip 18.03 / 7z b 4 -mmt1 | |
| Lenovo ThinkPad P1 G6 21FV001KUS | |
| HP ZBook Power 16 G11 A | |
| Media de la clase Workstation (4981 - 6960, n=25, últimos 2 años) | |
| Lenovo ThinkPad P1 Gen 7 21KV001SGE | |
| Dell XPS 16 9640 | |
| Medio Intel Core Ultra 7 155H (4594 - 5621, n=50) | |
| Dell Precision 5690 | |
| Geekbench 6.4 / Multi-Core | |
| Apple MacBook Pro 16 2023 M3 Pro | |
| Dell Precision 5690 | |
| Dell XPS 16 9640 | |
| Media de la clase Workstation (10200 - 16855, n=23, últimos 2 años) | |
| Lenovo ThinkPad P1 Gen 7 21KV001SGE | |
| Lenovo ThinkPad P1 G6 21FV001KUS | |
| HP ZBook Power 16 G11 A | |
| Medio Intel Core Ultra 7 155H (7732 - 13656, n=55) | |
| Geekbench 6.4 / Single-Core | |
| Apple MacBook Pro 16 2023 M3 Pro | |
| Lenovo ThinkPad P1 G6 21FV001KUS | |
| HP ZBook Power 16 G11 A | |
| Media de la clase Workstation (2352 - 2949, n=23, últimos 2 años) | |
| Dell Precision 5690 | |
| Dell XPS 16 9640 | |
| Lenovo ThinkPad P1 Gen 7 21KV001SGE | |
| Medio Intel Core Ultra 7 155H (1901 - 2473, n=52) | |
| Geekbench 5.5 / Multi-Core | |
| Apple MacBook Pro 16 2023 M3 Pro | |
| Dell Precision 5690 | |
| Dell XPS 16 9640 | |
| Media de la clase Workstation (8863 - 19316, n=25, últimos 2 años) | |
| Lenovo ThinkPad P1 Gen 7 21KV001SGE | |
| Lenovo ThinkPad P1 G6 21FV001KUS | |
| Medio Intel Core Ultra 7 155H (10017 - 13556, n=52) | |
| HP ZBook Power 16 G11 A | |
| Geekbench 5.5 / Single-Core | |
| Apple MacBook Pro 16 2023 M3 Pro | |
| Lenovo ThinkPad P1 G6 21FV001KUS | |
| HP ZBook Power 16 G11 A | |
| Media de la clase Workstation (1740 - 2095, n=25, últimos 2 años) | |
| Dell Precision 5690 | |
| Lenovo ThinkPad P1 Gen 7 21KV001SGE | |
| Dell XPS 16 9640 | |
| Medio Intel Core Ultra 7 155H (1462 - 1824, n=52) | |
| HWBOT x265 Benchmark v2.2 / 4k Preset | |
| Dell Precision 5690 | |
| Lenovo ThinkPad P1 Gen 7 21KV001SGE | |
| Dell XPS 16 9640 | |
| Media de la clase Workstation (14.4 - 33, n=25, últimos 2 años) | |
| Lenovo ThinkPad P1 G6 21FV001KUS | |
| HP ZBook Power 16 G11 A | |
| Medio Intel Core Ultra 7 155H (9.93 - 21.2, n=50) | |
| LibreOffice / 20 Documents To PDF | |
| HP ZBook Power 16 G11 A | |
| Medio Intel Core Ultra 7 155H (37.5 - 79.2, n=49) | |
| Media de la clase Workstation (36.5 - 56.9, n=25, últimos 2 años) | |
| Dell XPS 16 9640 | |
| Lenovo ThinkPad P1 G6 21FV001KUS | |
| Lenovo ThinkPad P1 Gen 7 21KV001SGE | |
| Dell Precision 5690 | |
| R Benchmark 2.5 / Overall mean | |
| Dell XPS 16 9640 | |
| Medio Intel Core Ultra 7 155H (0.4457 - 0.53, n=49) | |
| Lenovo ThinkPad P1 Gen 7 21KV001SGE | |
| Dell Precision 5690 | |
| HP ZBook Power 16 G11 A | |
| Media de la clase Workstation (0.3825 - 0.4888, n=25, últimos 2 años) | |
| Lenovo ThinkPad P1 G6 21FV001KUS | |
* ... más pequeño es mejor
AIDA64: FP32 Ray-Trace | FPU Julia | CPU SHA3 | CPU Queen | FPU SinJulia | FPU Mandel | CPU AES | CPU ZLib | FP64 Ray-Trace | CPU PhotoWorxx
| Performance Rating | |
| Media de la clase Workstation | |
| Dell Precision 5690 | |
| Dell XPS 16 9640 | |
| Lenovo ThinkPad P1 Gen 7 21KV001SGE | |
| Lenovo ThinkPad P1 G6 21FV001KUS | |
| Medio Intel Core Ultra 7 155H | |
| AIDA64 / FP32 Ray-Trace | |
| Media de la clase Workstation (10658 - 61611, n=25, últimos 2 años) | |
| Dell Precision 5690 | |
| Lenovo ThinkPad P1 Gen 7 21KV001SGE | |
| Dell XPS 16 9640 | |
| Lenovo ThinkPad P1 G6 21FV001KUS | |
| Medio Intel Core Ultra 7 155H (6670 - 18470, n=50) | |
| AIDA64 / FPU Julia | |
| Dell Precision 5690 | |
| Media de la clase Workstation (56664 - 183843, n=25, últimos 2 años) | |
| Lenovo ThinkPad P1 Gen 7 21KV001SGE | |
| Dell XPS 16 9640 | |
| Lenovo ThinkPad P1 G6 21FV001KUS | |
| Medio Intel Core Ultra 7 155H (40905 - 93181, n=50) | |
| AIDA64 / CPU SHA3 | |
| Dell Precision 5690 | |
| Media de la clase Workstation (2608 - 8341, n=25, últimos 2 años) | |
| Lenovo ThinkPad P1 Gen 7 21KV001SGE | |
| Dell XPS 16 9640 | |
| Lenovo ThinkPad P1 G6 21FV001KUS | |
| Medio Intel Core Ultra 7 155H (1940 - 4436, n=50) | |
| AIDA64 / CPU Queen | |
| Lenovo ThinkPad P1 G6 21FV001KUS | |
| Media de la clase Workstation (84022 - 144411, n=25, últimos 2 años) | |
| Dell Precision 5690 | |
| Lenovo ThinkPad P1 Gen 7 21KV001SGE | |
| Dell XPS 16 9640 | |
| Medio Intel Core Ultra 7 155H (64698 - 94181, n=50) | |
| AIDA64 / FPU SinJulia | |
| Media de la clase Workstation (7906 - 29343, n=25, últimos 2 años) | |
| Dell Precision 5690 | |
| Lenovo ThinkPad P1 G6 21FV001KUS | |
| Dell XPS 16 9640 | |
| Lenovo ThinkPad P1 Gen 7 21KV001SGE | |
| Medio Intel Core Ultra 7 155H (5639 - 10647, n=50) | |
| AIDA64 / FPU Mandel | |
| Media de la clase Workstation (27301 - 97385, n=25, últimos 2 años) | |
| Dell Precision 5690 | |
| Lenovo ThinkPad P1 Gen 7 21KV001SGE | |
| Dell XPS 16 9640 | |
| Lenovo ThinkPad P1 G6 21FV001KUS | |
| Medio Intel Core Ultra 7 155H (18236 - 47685, n=50) | |
| AIDA64 / CPU AES | |
| Dell Precision 5690 | |
| Media de la clase Workstation (56077 - 187841, n=25, últimos 2 años) | |
| Lenovo ThinkPad P1 Gen 7 21KV001SGE | |
| Dell XPS 16 9640 | |
| Lenovo ThinkPad P1 G6 21FV001KUS | |
| Medio Intel Core Ultra 7 155H (45713 - 152179, n=50) | |
| AIDA64 / CPU ZLib | |
| Dell Precision 5690 | |
| Lenovo ThinkPad P1 Gen 7 21KV001SGE | |
| Dell XPS 16 9640 | |
| Lenovo ThinkPad P1 G6 21FV001KUS | |
| Media de la clase Workstation (742 - 2057, n=25, últimos 2 años) | |
| Medio Intel Core Ultra 7 155H (557 - 1250, n=50) | |
| AIDA64 / FP64 Ray-Trace | |
| Media de la clase Workstation (5580 - 32891, n=25, últimos 2 años) | |
| Dell Precision 5690 | |
| Lenovo ThinkPad P1 Gen 7 21KV001SGE | |
| Lenovo ThinkPad P1 G6 21FV001KUS | |
| Dell XPS 16 9640 | |
| Medio Intel Core Ultra 7 155H (3569 - 9802, n=50) | |
| AIDA64 / CPU PhotoWorxx | |
| Dell XPS 16 9640 | |
| Dell Precision 5690 | |
| Medio Intel Core Ultra 7 155H (32719 - 54223, n=50) | |
| Media de la clase Workstation (24325 - 93684, n=25, últimos 2 años) | |
| Lenovo ThinkPad P1 Gen 7 21KV001SGE | |
| Lenovo ThinkPad P1 G6 21FV001KUS | |
Rendimiento del sistema
No hay nada de lo que quejarse en lo que respecta al rendimiento del sistema. Como es de esperar de una unidad tan cara, el Lenovo ThinkPad P1 Gen 7 funciona muy rápido.
Los benchmarks de memoria son interesantes: La memoria LPCAMM2 es mucho más rápida que la RAM DDR5 del predecesor, pero sigue estando por detrás de la competencia soldada de Dell.
CrossMark: Overall | Productivity | Creativity | Responsiveness
WebXPRT 3: Overall
WebXPRT 4: Overall
Mozilla Kraken 1.1: Total
| PCMark 10 / Score | |
| Dell Precision 5690 | |
| Lenovo ThinkPad P1 G6 21FV001KUS | |
| Media de la clase Workstation (6336 - 8587, n=25, últimos 2 años) | |
| Lenovo ThinkPad P1 Gen 7 21KV001SGE | |
| Dell XPS 16 9640 | |
| Medio Intel Core Ultra 7 155H, NVIDIA GeForce RTX 4060 Laptop GPU (6751 - 7370, n=5) | |
| PCMark 10 / Essentials | |
| Lenovo ThinkPad P1 G6 21FV001KUS | |
| Dell Precision 5690 | |
| Media de la clase Workstation (9647 - 12197, n=25, últimos 2 años) | |
| Lenovo ThinkPad P1 Gen 7 21KV001SGE | |
| Dell XPS 16 9640 | |
| Medio Intel Core Ultra 7 155H, NVIDIA GeForce RTX 4060 Laptop GPU (9476 - 10446, n=5) | |
| PCMark 10 / Productivity | |
| Dell Precision 5690 | |
| Lenovo ThinkPad P1 G6 21FV001KUS | |
| Media de la clase Workstation (8829 - 10820, n=25, últimos 2 años) | |
| Dell XPS 16 9640 | |
| Lenovo ThinkPad P1 Gen 7 21KV001SGE | |
| Medio Intel Core Ultra 7 155H, NVIDIA GeForce RTX 4060 Laptop GPU (8079 - 9477, n=5) | |
| PCMark 10 / Digital Content Creation | |
| Lenovo ThinkPad P1 G6 21FV001KUS | |
| Dell Precision 5690 | |
| Lenovo ThinkPad P1 Gen 7 21KV001SGE | |
| Media de la clase Workstation (7589 - 15093, n=25, últimos 2 años) | |
| Medio Intel Core Ultra 7 155H, NVIDIA GeForce RTX 4060 Laptop GPU (9811 - 11620, n=5) | |
| Dell XPS 16 9640 | |
| CrossMark / Overall | |
| Apple MacBook Pro 16 2023 M3 Pro | |
| Dell XPS 16 9640 | |
| Lenovo ThinkPad P1 G6 21FV001KUS | |
| Dell Precision 5690 | |
| Media de la clase Workstation (1574 - 2037, n=23, últimos 2 años) | |
| Lenovo ThinkPad P1 Gen 7 21KV001SGE | |
| Medio Intel Core Ultra 7 155H, NVIDIA GeForce RTX 4060 Laptop GPU (1540 - 1746, n=5) | |
| CrossMark / Productivity | |
| Apple MacBook Pro 16 2023 M3 Pro | |
| Dell XPS 16 9640 | |
| Dell Precision 5690 | |
| Lenovo ThinkPad P1 G6 21FV001KUS | |
| Media de la clase Workstation (1546 - 1902, n=23, últimos 2 años) | |
| Lenovo ThinkPad P1 Gen 7 21KV001SGE | |
| Medio Intel Core Ultra 7 155H, NVIDIA GeForce RTX 4060 Laptop GPU (1436 - 1684, n=5) | |
| CrossMark / Creativity | |
| Apple MacBook Pro 16 2023 M3 Pro | |
| Lenovo ThinkPad P1 G6 21FV001KUS | |
| Dell Precision 5690 | |
| Media de la clase Workstation (1655 - 2412, n=23, últimos 2 años) | |
| Dell XPS 16 9640 | |
| Lenovo ThinkPad P1 Gen 7 21KV001SGE | |
| Medio Intel Core Ultra 7 155H, NVIDIA GeForce RTX 4060 Laptop GPU (1811 - 1929, n=5) | |
| CrossMark / Responsiveness | |
| Dell XPS 16 9640 | |
| Dell Precision 5690 | |
| Lenovo ThinkPad P1 G6 21FV001KUS | |
| Media de la clase Workstation (1304 - 1730, n=23, últimos 2 años) | |
| Apple MacBook Pro 16 2023 M3 Pro | |
| Medio Intel Core Ultra 7 155H, NVIDIA GeForce RTX 4060 Laptop GPU (1165 - 1631, n=5) | |
| Lenovo ThinkPad P1 Gen 7 21KV001SGE | |
| WebXPRT 3 / Overall | |
| Apple MacBook Pro 16 2023 M3 Pro | |
| Lenovo ThinkPad P1 G6 21FV001KUS | |
| Media de la clase Workstation (259 - 415, n=26, últimos 2 años) | |
| Dell Precision 5690 | |
| Lenovo ThinkPad P1 Gen 7 21KV001SGE | |
| Dell XPS 16 9640 | |
| Medio Intel Core Ultra 7 155H, NVIDIA GeForce RTX 4060 Laptop GPU (274 - 290, n=5) | |
| WebXPRT 4 / Overall | |
| Lenovo ThinkPad P1 G6 21FV001KUS | |
| Dell Precision 5690 | |
| Media de la clase Workstation (199.4 - 338, n=22, últimos 2 años) | |
| Lenovo ThinkPad P1 Gen 7 21KV001SGE | |
| Dell XPS 16 9640 | |
| Medio Intel Core Ultra 7 155H, NVIDIA GeForce RTX 4060 Laptop GPU (236 - 262, n=5) | |
| Mozilla Kraken 1.1 / Total | |
| Medio Intel Core Ultra 7 155H, NVIDIA GeForce RTX 4060 Laptop GPU (519 - 585, n=5) | |
| Lenovo ThinkPad P1 Gen 7 21KV001SGE | |
| Media de la clase Workstation (433 - 591, n=26, últimos 2 años) | |
| Dell Precision 5690 | |
| Lenovo ThinkPad P1 G6 21FV001KUS | |
| Apple MacBook Pro 16 2023 M3 Pro | |
* ... más pequeño es mejor
| PCMark 10 Score | 7370 puntos | |
ayuda | ||
| AIDA64 / Memory Copy | |
| Dell XPS 16 9640 | |
| Dell Precision 5690 | |
| Medio Intel Core Ultra 7 155H (62397 - 96791, n=50) | |
| Media de la clase Workstation (34323 - 158632, n=25, últimos 2 años) | |
| Lenovo ThinkPad P1 Gen 7 21KV001SGE | |
| Lenovo ThinkPad P1 G6 21FV001KUS | |
| AIDA64 / Memory Read | |
| Dell Precision 5690 | |
| Dell XPS 16 9640 | |
| Medio Intel Core Ultra 7 155H (60544 - 90647, n=50) | |
| Media de la clase Workstation (30787 - 121177, n=25, últimos 2 años) | |
| Lenovo ThinkPad P1 Gen 7 21KV001SGE | |
| Lenovo ThinkPad P1 G6 21FV001KUS | |
| AIDA64 / Memory Write | |
| Media de la clase Workstation (39166 - 212172, n=25, últimos 2 años) | |
| Dell Precision 5690 | |
| Dell XPS 16 9640 | |
| Medio Intel Core Ultra 7 155H (58692 - 93451, n=50) | |
| Lenovo ThinkPad P1 Gen 7 21KV001SGE | |
| Lenovo ThinkPad P1 G6 21FV001KUS | |
| AIDA64 / Memory Latency | |
| Medio Intel Core Ultra 7 155H (116.2 - 233, n=50) | |
| Dell Precision 5690 | |
| Dell XPS 16 9640 | |
| Lenovo ThinkPad P1 Gen 7 21KV001SGE | |
| Media de la clase Workstation (83.4 - 165.2, n=25, últimos 2 años) | |
| Lenovo ThinkPad P1 G6 21FV001KUS | |
* ... más pequeño es mejor
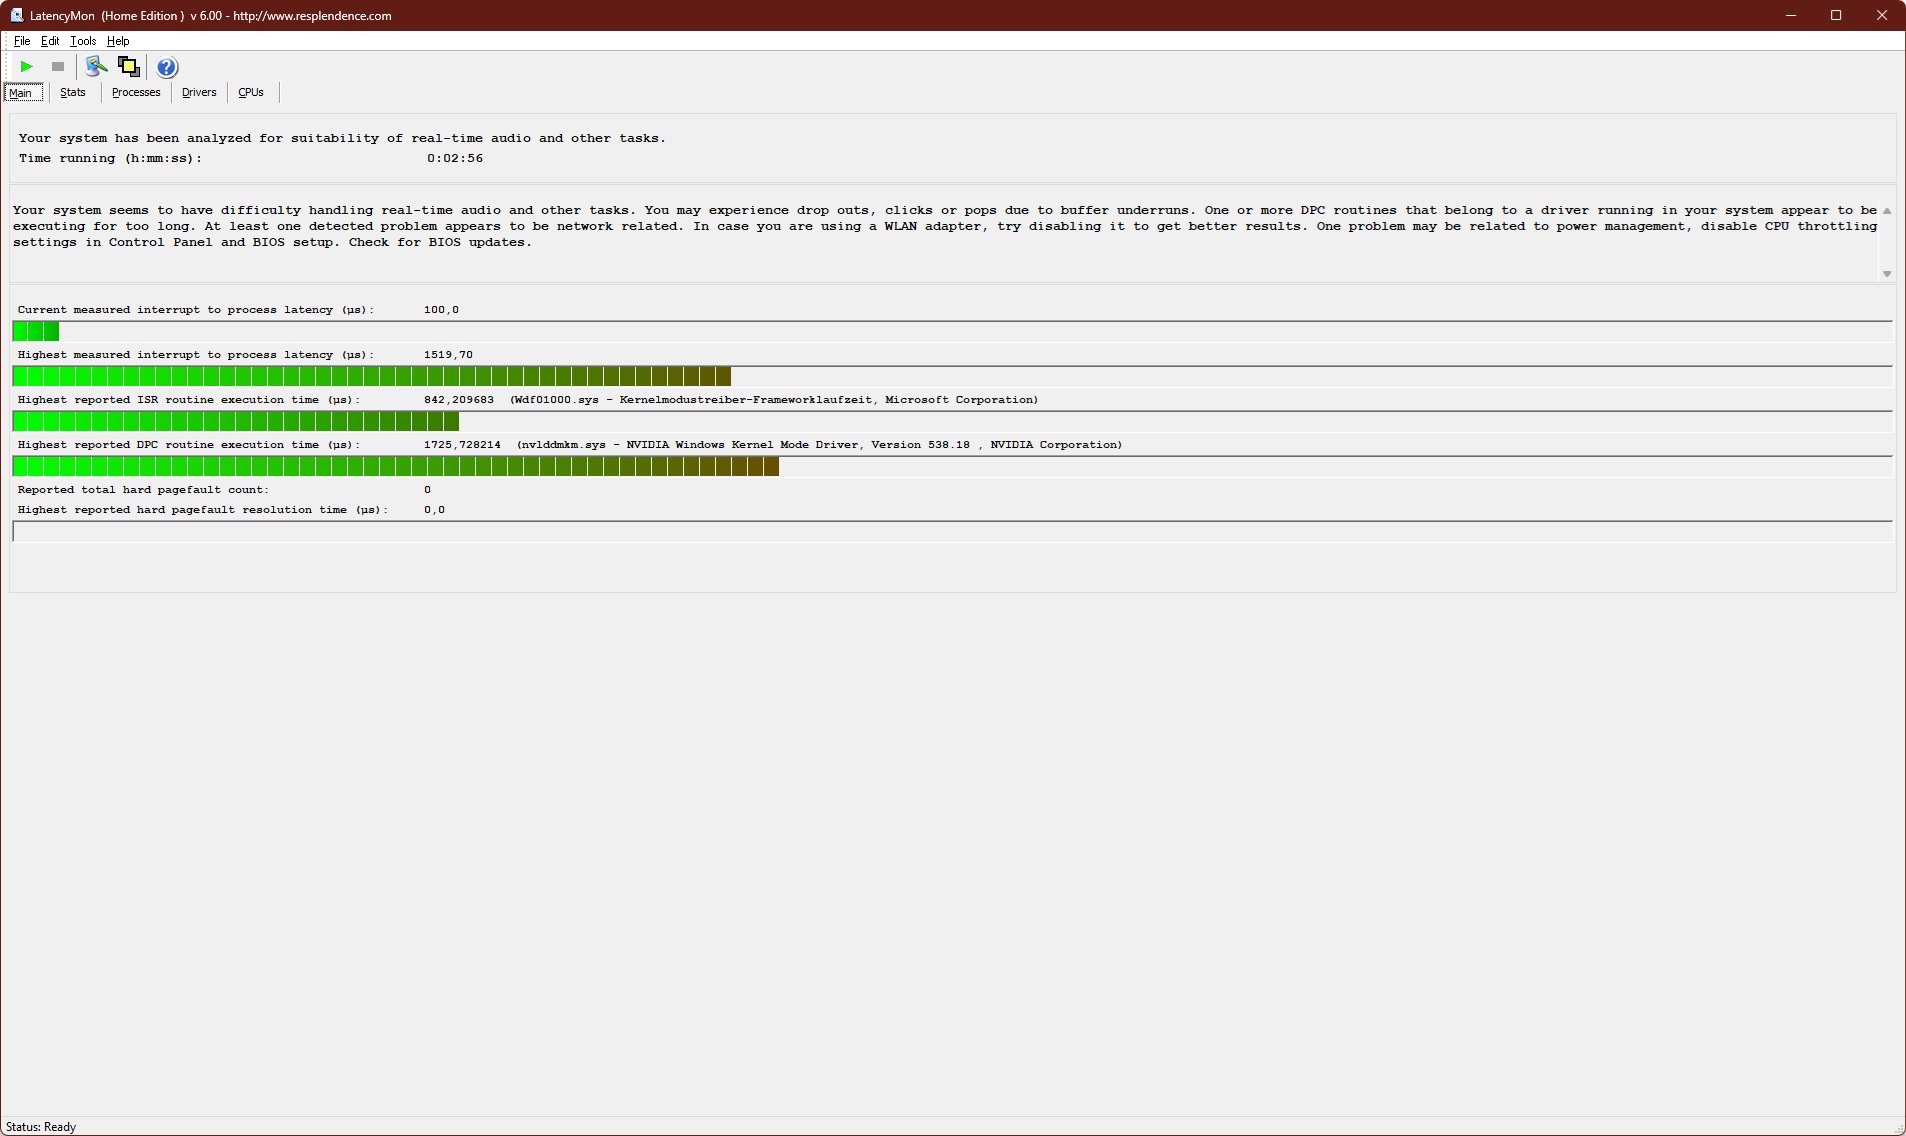
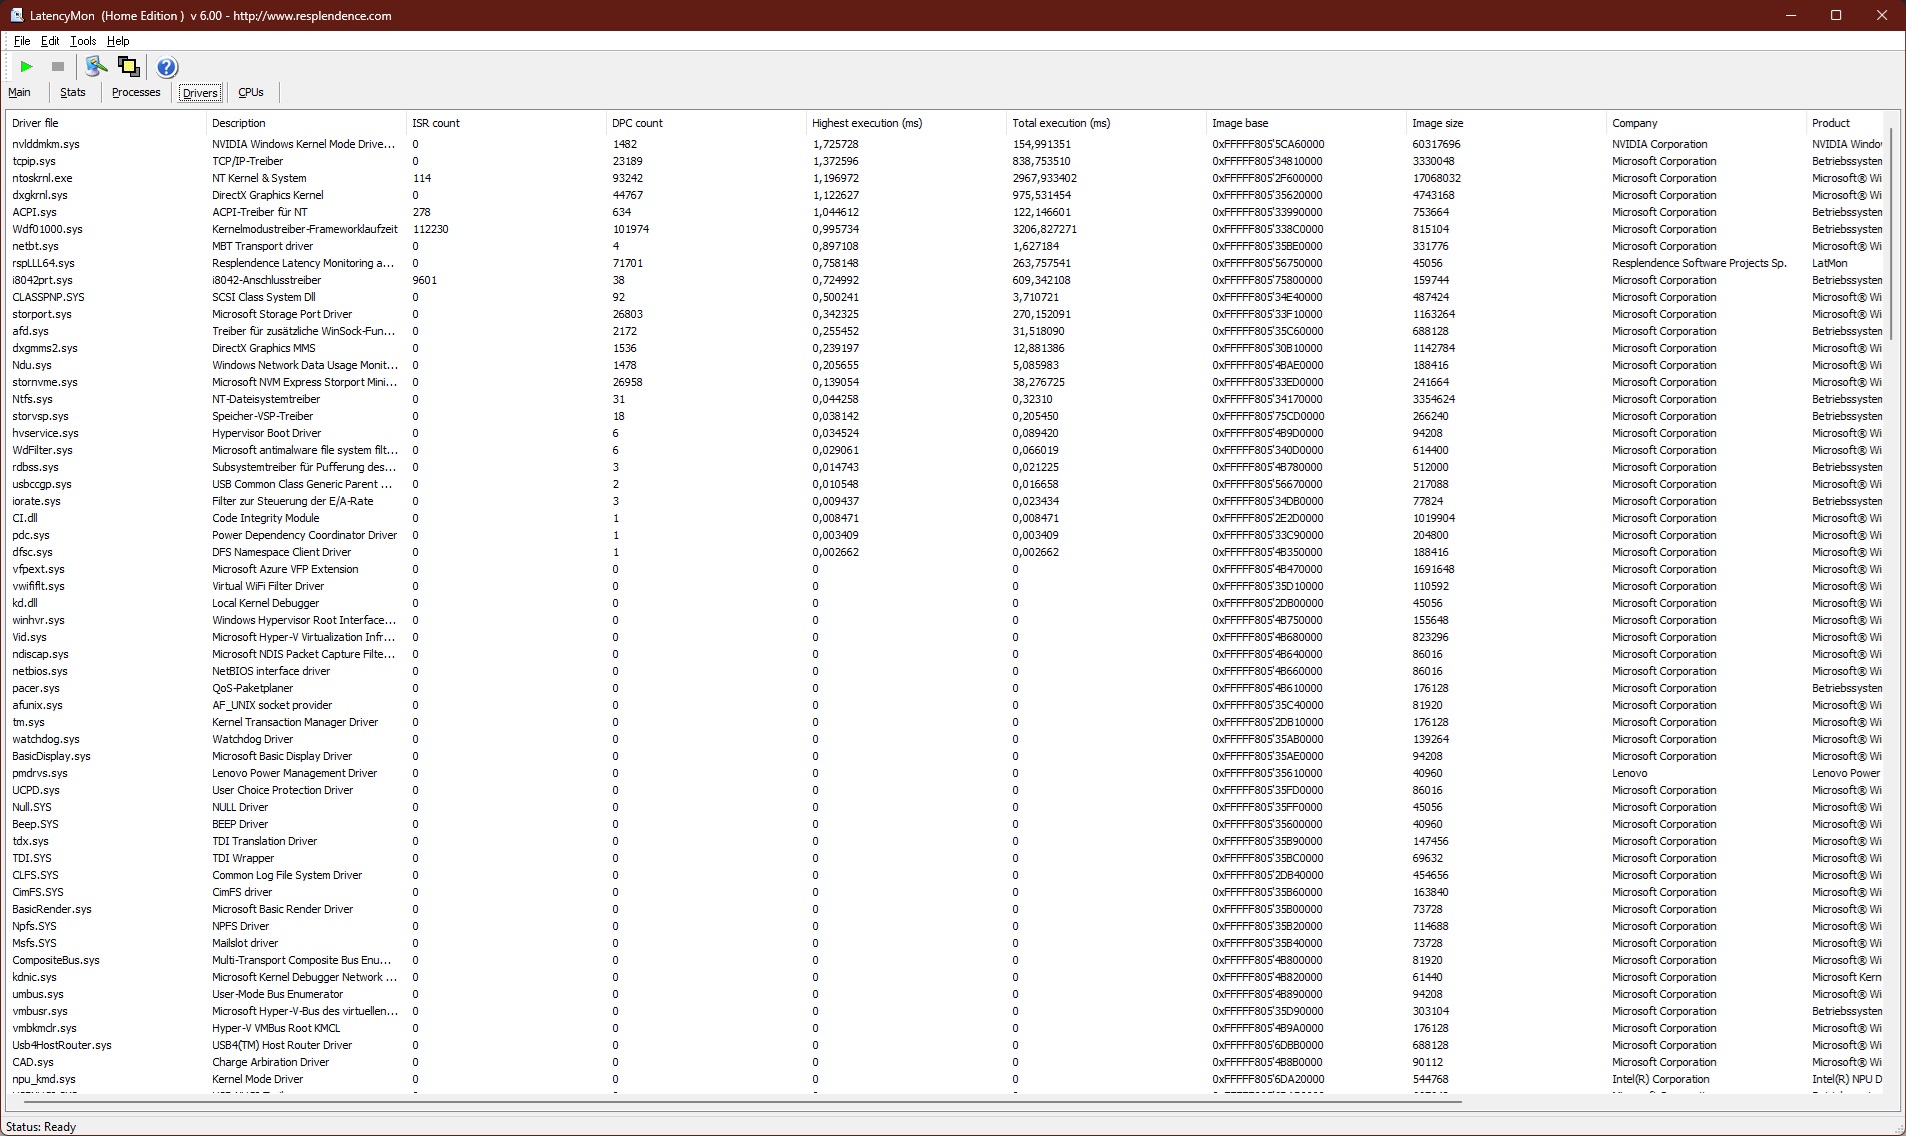
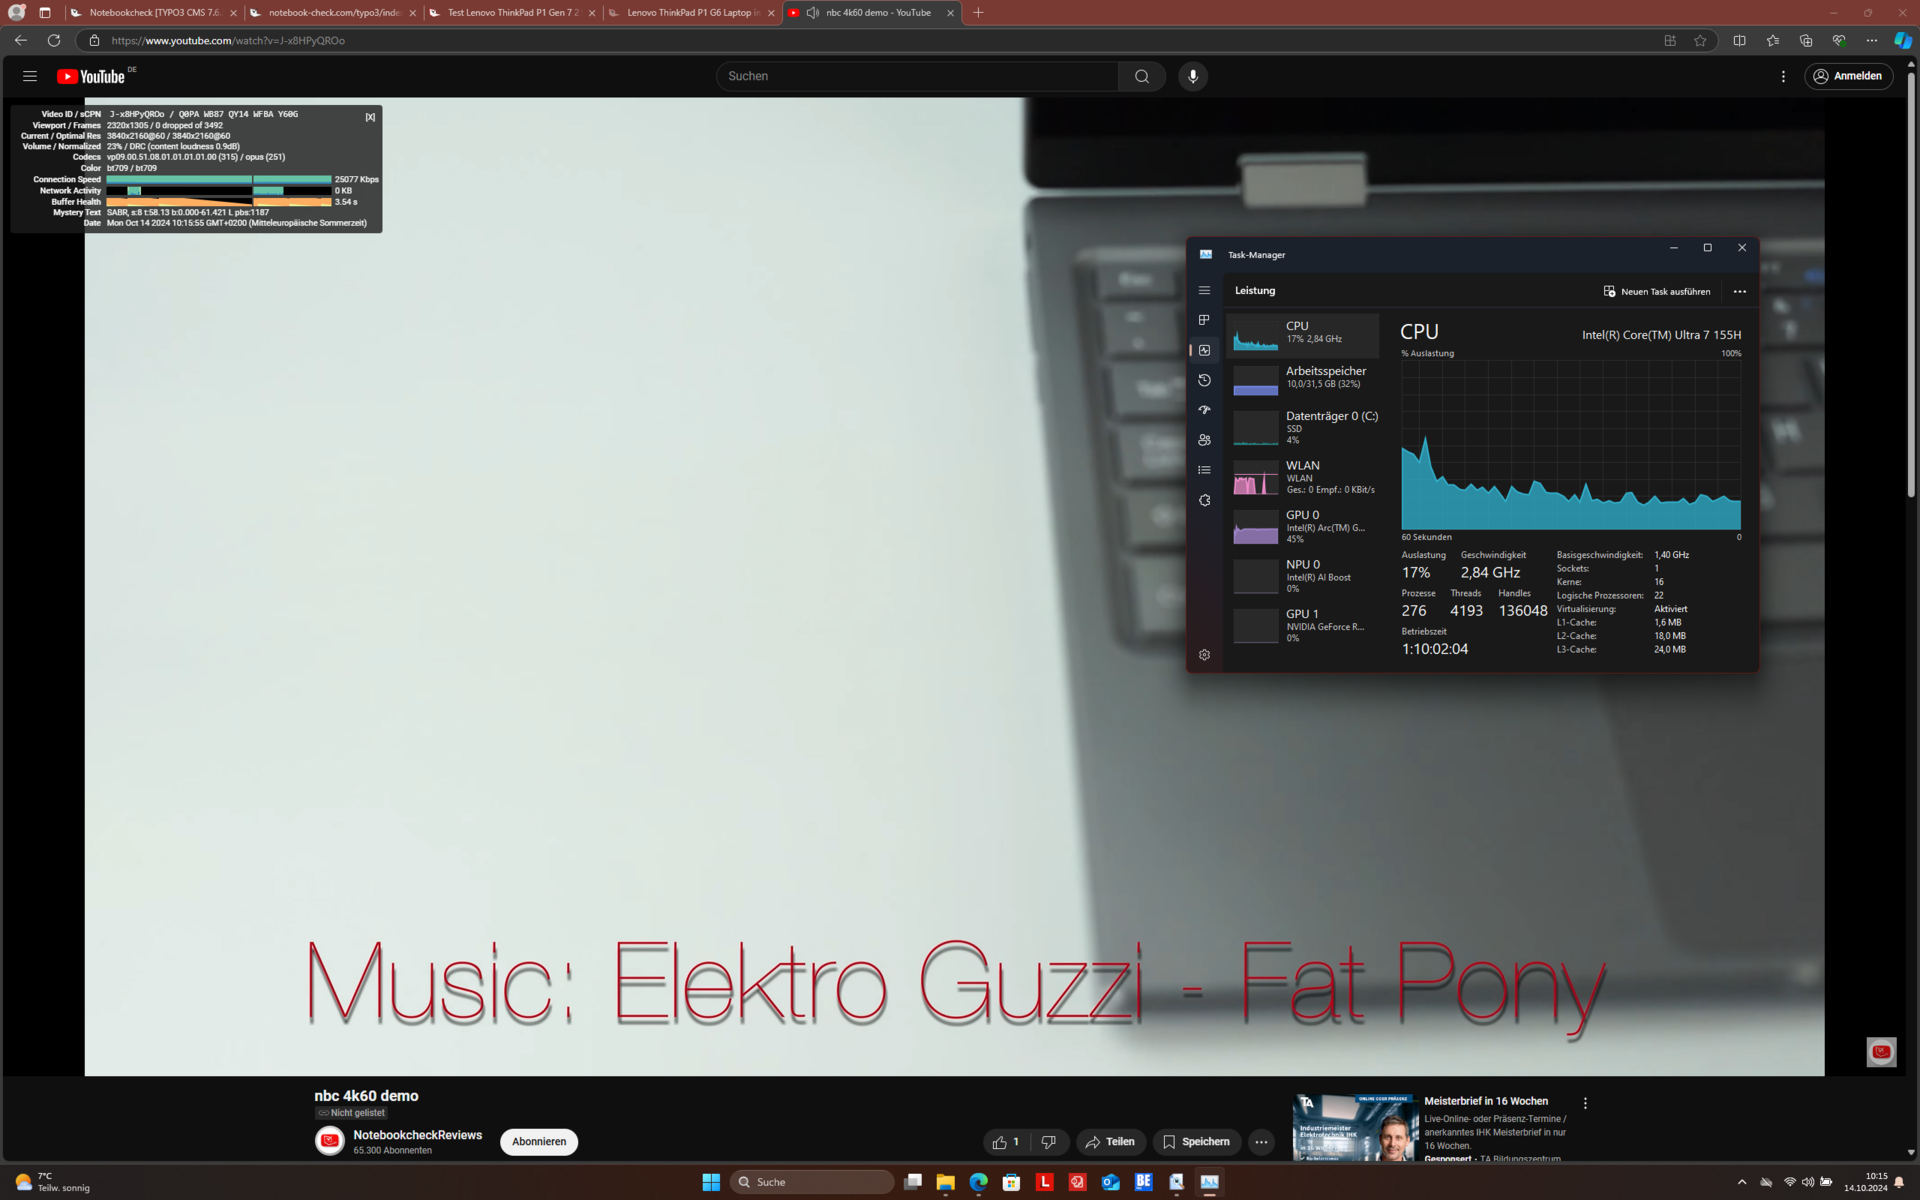
Latencia del CPD
El ThinkPad P1 G7 de Lenovo parece tener algunos problemas con las caídas inducidas por la latencia del CPD. La causa principal parece ser el controlador Nvidia. Si el ThinkPad se utiliza con la GPU Nvidia desactivada, el problema podría desaparecer.
| DPC Latencies / LatencyMon - interrupt to process latency (max), Web, Youtube, Prime95 | |
| Lenovo ThinkPad P1 Gen 7 21KV001SGE | |
| Lenovo ThinkPad P1 G6 21FV001KUS | |
| Dell XPS 16 9640 | |
| Dell Precision 5690 | |
* ... más pequeño es mejor
Almacenamiento
Lenovo utiliza una SSD Kioxia con una capacidad de un terabyte. La SSD NVMe PCIe 4.0 no muestra degradación del rendimiento bajo carga sostenida, pero no es extremadamente rápida. En el uso diario, sin embargo, las diferencias con las SSD de la competencia no serán evidentes.
Como se ha mencionado en la sección de mantenimiento: El Lenovo ThinkPad P1 Gen 7 tiene dos ranuras M.2 2280, una de las cuales permanece abierta en nuestra unidad. Se puede añadir otra SSD. El ThinkPad P1 Gen 7 también admite RAID 0/1.

| Drive Performance Rating - Percent | |
| Dell XPS 16 9640 | |
| Dell Precision 5690 | |
| Media de la clase Workstation | |
| Medio Kioxia XG8 KXG8AZNV1T02 | |
| Lenovo ThinkPad P1 G6 21FV001KUS | |
| Lenovo ThinkPad P1 Gen 7 21KV001SGE | |
* ... más pequeño es mejor
Sustained performance read: DiskSpd Read Loop, Queue Depth 8
GPU
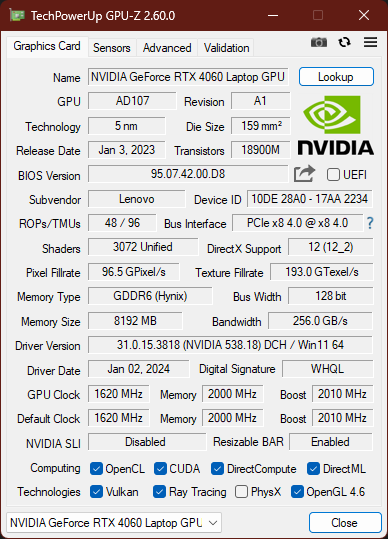
Con el Portátil Nvidia GeForce RTX 4060el Lenovo ThinkPad P1 Gen 7 ofrece una solución de gama media de la serie Ada Lovelace. Como alternativa, el GeForce RTX 4070 o RTX 3000 Ada pueden ofrecer aún más rendimiento. Las verdaderas GPU de gama alta, que estaban disponibles en el ThinkPad P1 Gen 6 (RTX 4000 Ada, RTX 5000 Ada, GeForce RTX 4080, GeForce RTX 4090) no se encuentran por ninguna parte.
Esto significa que el Lenovo ThinkPad P1 Gen 7 es un downgrade de GPU en comparación con la estación de trabajo ThinkPad anterior. Este downgrade es especialmente evidente cuando se trata de VRAM: El P1 G6 ofrecía hasta 16 GB de VRAM, esto se reduce a la mitad a 8 GB para el P1 Gen 7. Al menos, la GeForce RTX 4060 aquí no es lenta. En las pruebas comparativas 3DMark, es aproximadamente tan rápida como la RTX 4070 del Dell XPS 16. El TGP de la GPU se sitúa en 80 W.
Es algo triste que el ThinkPad P1 Gen 7 ya no ofrezca Advanced Optimus. Con el predecesor, el interruptor MUX en la BIOS permitía un funcionamiento dGPU puro - aquí ya no es posible.
En modo batería, el rendimiento de la GPU está ligeramente limitado. En el 3DMark 11, el Lenovo ThinkPad P1 Gen 7 obtuvo 25.134 puntos en lugar de 32.372, una reducción del 22%.
| 3DMark 11 Performance | 28509 puntos | |
| 3DMark Fire Strike Score | 21488 puntos | |
| 3DMark Time Spy Score | 9572 puntos | |
ayuda | ||
| SPECviewperf Performance Rating - Percent | |
| Dell Precision 5690 -1! | |
| Lenovo ThinkPad P1 G6 21FV001KUS -1! | |
| Media de la clase Workstation | |
| Medio NVIDIA GeForce RTX 4060 Laptop GPU -1! | |
| Lenovo ThinkPad P1 Gen 7 21KV001SGE -1! | |
* ... más pequeño es mejor
Rendimiento de juego
Jugar es ciertamente posible con el P1 Gen 7, pero puntúa por debajo del ThinkPad P1 Gen 8 con su Nvidia GeForce RTX 4080. Al menos en este aspecto, la ThinkPad P1 Gen 7 puede vencer a la Dell XPS 16, a pesar de que esta tiene una RTX 4070. Por supuesto, jugar con el Lenovo ThinkPad P1 Gen 7 es un poco como conducir un Ferrari en la vía pública: está hecho para aplicaciones diferentes.
| GTA V - 1920x1080 Highest Settings possible AA:4xMSAA + FX AF:16x | |
| Lenovo ThinkPad P1 G6 21FV001KUS | |
| Dell XPS 16 9640 | |
| Lenovo ThinkPad P1 Gen 7 21KV001SGE | |
| Media de la clase Workstation (18.3 - 126.7, n=21, últimos 2 años) | |
| Apple MacBook Pro 16 2023 M3 Pro | |
| Final Fantasy XV Benchmark - 1920x1080 High Quality | |
| Lenovo ThinkPad P1 G6 21FV001KUS | |
| Dell Precision 5690 | |
| Dell XPS 16 9640 | |
| Lenovo ThinkPad P1 Gen 7 21KV001SGE | |
| Media de la clase Workstation (21.2 - 174.6, n=25, últimos 2 años) | |
| Dota 2 Reborn - 1920x1080 ultra (3/3) best looking | |
| Lenovo ThinkPad P1 G6 21FV001KUS | |
| Dell Precision 5690 | |
| Lenovo ThinkPad P1 Gen 7 21KV001SGE | |
| Media de la clase Workstation (64.8 - 178.4, n=25, últimos 2 años) | |
| Dell XPS 16 9640 | |
| X-Plane 11.11 - 1920x1080 high (fps_test=3) | |
| Lenovo ThinkPad P1 G6 21FV001KUS | |
| Dell Precision 5690 | |
| Dell XPS 16 9640 | |
| Dell XPS 16 9640 | |
| Lenovo ThinkPad P1 Gen 7 21KV001SGE | |
| Media de la clase Workstation (27.7 - 139.7, n=26, últimos 2 años) | |
En la prueba de carga de Cyberpunk , no se produjeron grandes caídas de la tasa de imágenes por segundo.
Cyberpunk 2077 ultra FPS diagram
| bajo | medio | alto | ultra | QHD | 4K | |
|---|---|---|---|---|---|---|
| GTA V (2015) | 176.4 | 168 | 162.9 | 97.9 | 77.6 | 73.1 |
| Dota 2 Reborn (2015) | 161.5 | 146.7 | 138.2 | 131.2 | ||
| Final Fantasy XV Benchmark (2018) | 174.2 | 122.7 | 90.3 | 68.1 | ||
| X-Plane 11.11 (2018) | 124.4 | 105.9 | 83.3 | |||
| Far Cry 5 (2018) | 148 | 125 | 118 | 110 | 88 | |
| Baldur's Gate 3 (2023) | 102.8 | 77.5 | 68.7 | 67.4 | 45.2 | |
| Cyberpunk 2077 2.2 Phantom Liberty (2023) | 106.9 | 85.7 | 74.4 | 65.1 | 41 | 16.9 |
| F1 24 (2024) | 190.1 | 175.5 | 142.5 | 47.5 | 31.8 |
Emisiones: El reposamanos del portátil Lenovo se mantiene fresco
Ruido
No se puede esperar que un equipo de rendimiento optimizado como el Lenovo ThinkPad P1 Gen 7 sea siempre silencioso. En ralentí, los dos ventiladores no funcionan, pero se vuelven bastante ruidosos ya bajo carga media (perfil de energía: Equilibrado). Bajo carga máxima en la prueba de estrés (perfil de energía: Mejor rendimiento), medimos 53 dB(a) - muy ruidoso, pero normal para un portátil de estación de trabajo. En general, no calificaríamos al ThinkPad P1 Gen 7 como un portátil muy ruidoso. Los ventiladores sí son ruidosos, pero dejan de funcionar en cuanto el sistema vuelve al modo de ralentí.
El Lenovo ThinkPad P1 Gen 7 no produce ningún quejido de bobina.
Ruido
| Ocioso |
| 24.7 / 24.7 / 24.7 dB(A) |
| Carga |
| 43.7 / 53.3 dB(A) |
 | ||
30 dB silencioso 40 dB(A) audible 50 dB(A) ruidosamente alto |
||
min: | ||
| Lenovo ThinkPad P1 Gen 7 21KV001SGE NVIDIA GeForce RTX 4060 Laptop GPU, Ultra 7 155H, Kioxia XG8 KXG8AZNV1T02 | Lenovo ThinkPad P1 G6 21FV001KUS NVIDIA GeForce RTX 4080 Laptop GPU, i7-13800H, Kioxia XG8 KXG8AZNV1T02 | Apple MacBook Pro 16 2023 M3 Pro M3 Pro 18-Core GPU, Apple M3 Pro 12-Core, Apple SSD AP0512Z | Dell XPS 16 9640 NVIDIA GeForce RTX 4070 Laptop GPU, Ultra 7 155H, Kioxia XG8 KXG80ZNV1T02 | Dell Precision 5690 NVIDIA RTX 5000 Ada Generation Laptop GPU, Ultra 9 185H, 2x Samsung PM9A1 1TB (RAID 0) | |
|---|---|---|---|---|---|
| Noise | 11% | 8% | 1% | -1% | |
| apagado / medio ambiente * | 24.7 | 22.5 9% | 24.4 1% | 24.5 1% | 23.4 5% |
| Idle Minimum * | 24.7 | 22.5 9% | 24.4 1% | 24.5 1% | 23.6 4% |
| Idle Average * | 24.7 | 22.5 9% | 24.4 1% | 24.5 1% | 24.9 -1% |
| Idle Maximum * | 24.7 | 22.5 9% | 24.4 1% | 27.5 -11% | 30.9 -25% |
| Load Average * | 43.7 | 28.7 34% | 26.9 38% | 39.6 9% | 40.4 8% |
| Cyberpunk 2077 ultra * | 53.2 | ||||
| Load Maximum * | 53.3 | 54.4 -2% | 50.4 5% | 49.7 7% | 51.9 3% |
| Witcher 3 ultra * | 47.5 | 25.1 | 49.7 | 48.3 |
* ... más pequeño es mejor
Calor
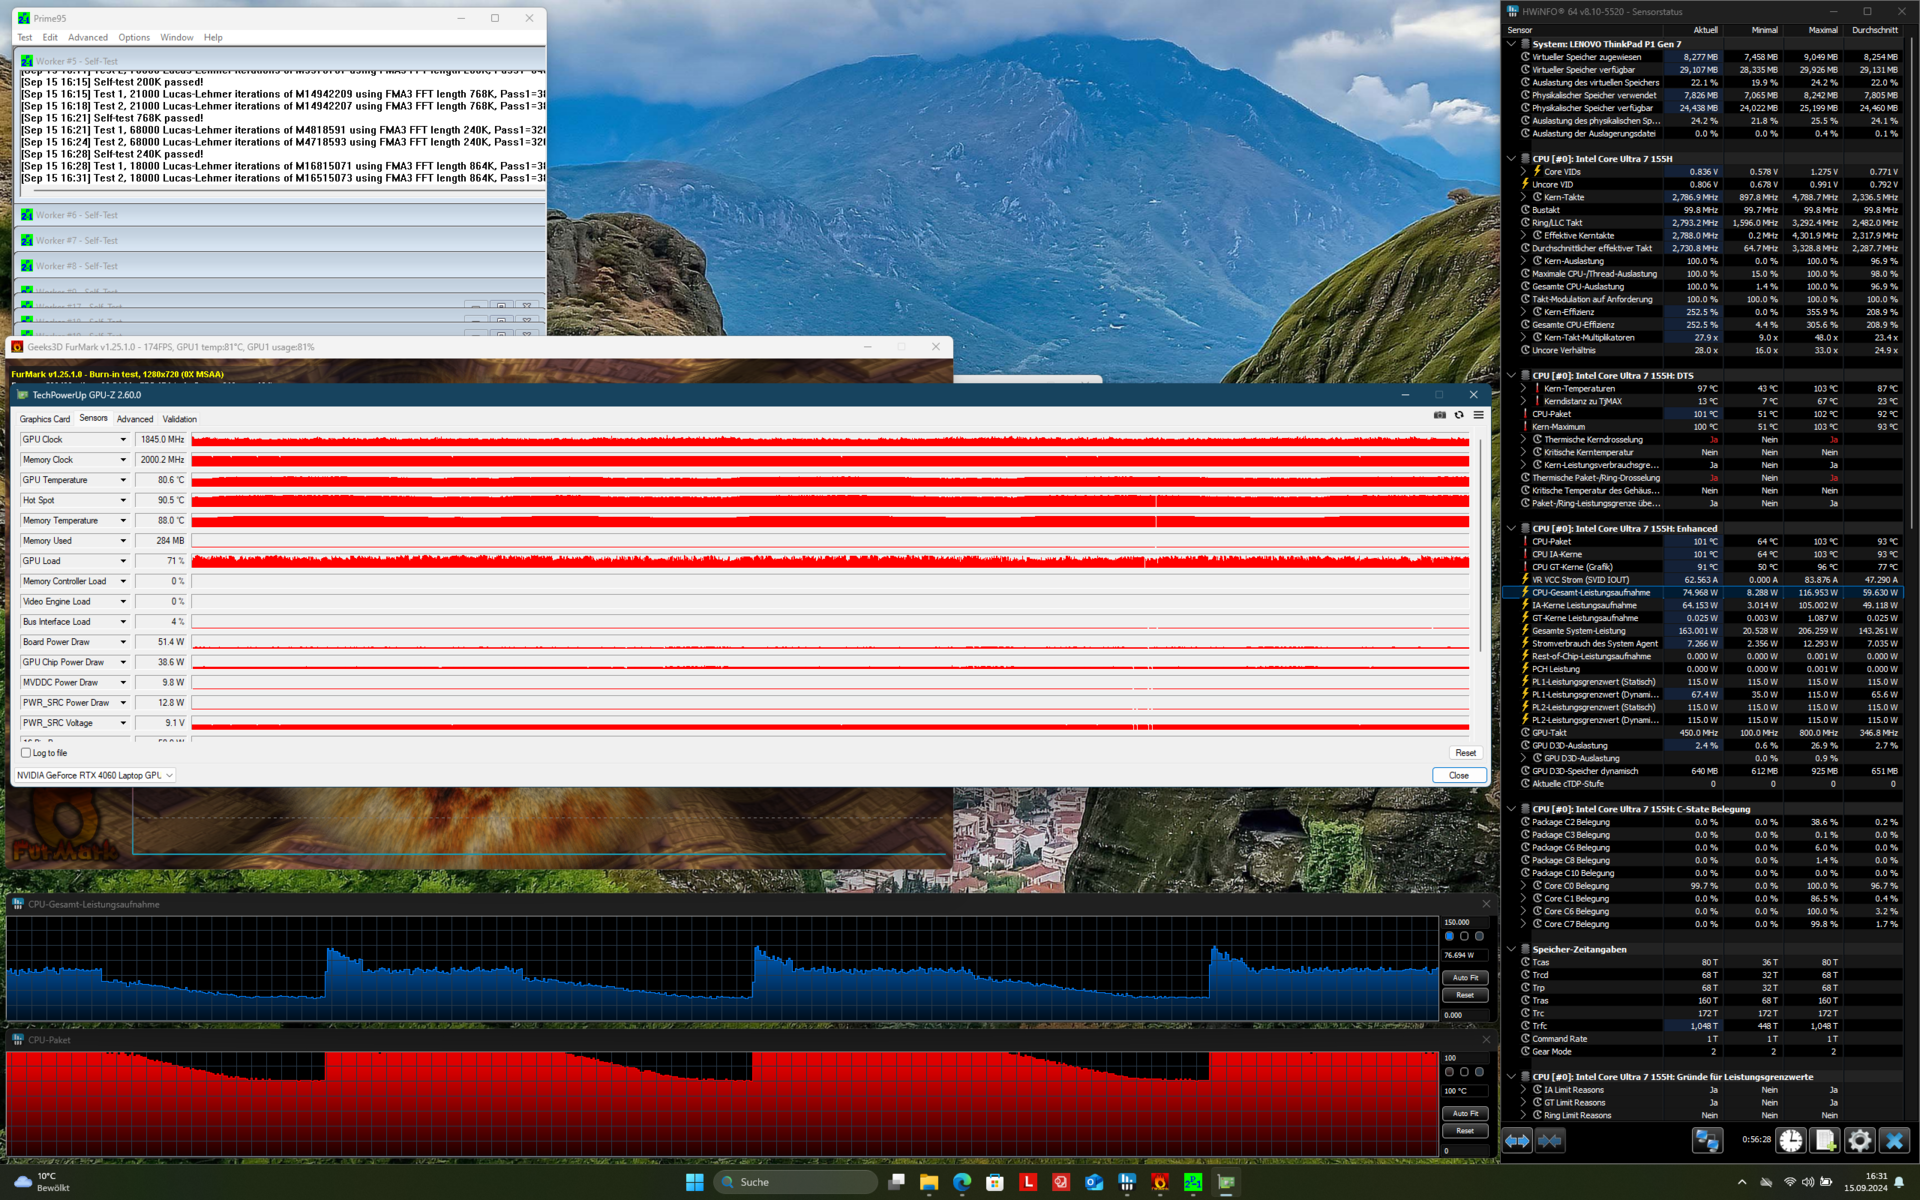
La temperatura máxima del chasis sube hasta los 50 grados Celsius / 123 F. Ese punto caliente está encima del teclado, una zona que el usuario no suele tocar. La parte inferior del dispositivo se mantiene fría en su mayor parte, tanto en la prueba de estrés como en la de juegos Cyberpunk.
A pesar de contar con dos ventiladores, metal líquido y una cámara de vapor, el Lenovo ThinkPad P1 Gen 7 no puede refrigerar tanto la CPU como la GPU sin ralentizarse bajo carga sostenida. Ambos componentes tienen que limitarse en la prueba de estrés, con la GPU funcionando a 50 W y la CPU a 70 W. El rendimiento de la CPU sube y baja en una especie de patrón de "onda".
(-) La temperatura máxima en la parte superior es de 50.3 °C / 123 F, frente a la media de 38.2 °C / 101 F, que oscila entre 22.2 y 69.8 °C para la clase Workstation.
(+) El fondo se calienta hasta un máximo de 38 °C / 100 F, frente a la media de 41.2 °C / 106 F
(+) En reposo, la temperatura media de la parte superior es de 24.9 °C / 77# F, frente a la media del dispositivo de 32 °C / 90 F.
(±) 3: The average temperature for the upper side is 32.2 °C / 90 F, compared to the average of 32 °C / 90 F for the class Workstation.
(+) El reposamanos y el panel táctil están a una temperatura inferior a la de la piel, con un máximo de 30.2 °C / 86.4 F y, por tanto, son fríos al tacto.
(-) La temperatura media de la zona del reposamanos de dispositivos similares fue de 27.8 °C / 82 F (-2.4 °C / -4.4 F).
| Lenovo ThinkPad P1 Gen 7 21KV001SGE Intel Core Ultra 7 155H, NVIDIA GeForce RTX 4060 Laptop GPU | Lenovo ThinkPad P1 G6 21FV001KUS Intel Core i7-13800H, NVIDIA GeForce RTX 4080 Laptop GPU | Apple MacBook Pro 16 2023 M3 Pro Apple M3 Pro 12-Core, Apple M3 Pro 18-Core GPU | Dell XPS 16 9640 Intel Core Ultra 7 155H, NVIDIA GeForce RTX 4070 Laptop GPU | Dell Precision 5690 Intel Core Ultra 9 185H, Nvidia RTX 5000 Ada Generation Laptop GPU | |
|---|---|---|---|---|---|
| Heat | -14% | 13% | 6% | -1% | |
| Maximum Upper Side * | 50.3 | 42 17% | 38.1 24% | 39.4 22% | 46.6 7% |
| Maximum Bottom * | 38 | 45.2 -19% | 37 3% | 36.9 3% | 33 13% |
| Idle Upper Side * | 28.3 | 33 -17% | 24.2 14% | 28.2 -0% | 32.4 -14% |
| Idle Bottom * | 27.3 | 37 -36% | 24.6 10% | 27.4 -0% | 29.4 -8% |
* ... más pequeño es mejor
Altavoces
En lugar de altavoces que disparan hacia arriba como el predecesor ThinkPad P1 Gen 6el ThinkPad P1 Gen 7 tiene unos que se disparan hacia abajo. La calidad de los altavoces estéreo sigue siendo estupenda, aunque el volumen máximo se ha reducido un poco en comparación con el modelo del año pasado.
Lenovo ThinkPad P1 Gen 7 21KV001SGE análisis de audio
(±) | la sonoridad del altavoz es media pero buena (81.4 dB)
Graves 100 - 315 Hz
(±) | lubina reducida - en promedio 6.8% inferior a la mediana
(±) | la linealidad de los graves es media (10.3% delta a frecuencia anterior)
Medios 400 - 2000 Hz
(+) | medios equilibrados - a sólo 3.4% de la mediana
(+) | los medios son lineales (4.7% delta a la frecuencia anterior)
Altos 2 - 16 kHz
(+) | máximos equilibrados - a sólo 3.1% de la mediana
(+) | los máximos son lineales (6% delta a la frecuencia anterior)
Total 100 - 16.000 Hz
(+) | el sonido global es lineal (9.2% de diferencia con la mediana)
En comparación con la misma clase
» 3% de todos los dispositivos probados de esta clase eran mejores, 2% similares, 94% peores
» El mejor tuvo un delta de 7%, la media fue 18%, el peor fue ###max##%
En comparación con todos los dispositivos probados
» 3% de todos los dispositivos probados eran mejores, 1% similares, 97% peores
» El mejor tuvo un delta de 4%, la media fue 24%, el peor fue ###max##%
Lenovo ThinkPad P1 G6 21FV001KUS análisis de audio
(+) | los altavoces pueden reproducir a un volumen relativamente alto (#85.2 dB)
Graves 100 - 315 Hz
(±) | lubina reducida - en promedio 8% inferior a la mediana
(±) | la linealidad de los graves es media (10.2% delta a frecuencia anterior)
Medios 400 - 2000 Hz
(±) | medias más altas - de media 7.7% más altas que la mediana
(+) | los medios son lineales (4.7% delta a la frecuencia anterior)
Altos 2 - 16 kHz
(+) | máximos equilibrados - a sólo 4.2% de la mediana
(+) | los máximos son lineales (6.2% delta a la frecuencia anterior)
Total 100 - 16.000 Hz
(+) | el sonido global es lineal (13.2% de diferencia con la mediana)
En comparación con la misma clase
» 19% de todos los dispositivos probados de esta clase eran mejores, 6% similares, 75% peores
» El mejor tuvo un delta de 7%, la media fue 18%, el peor fue ###max##%
En comparación con todos los dispositivos probados
» 12% de todos los dispositivos probados eran mejores, 3% similares, 86% peores
» El mejor tuvo un delta de 4%, la media fue 24%, el peor fue ###max##%
Dell XPS 16 9640 análisis de audio
(+) | los altavoces pueden reproducir a un volumen relativamente alto (#83.4 dB)
Graves 100 - 315 Hz
(±) | lubina reducida - en promedio 11.2% inferior a la mediana
(±) | la linealidad de los graves es media (8.9% delta a frecuencia anterior)
Medios 400 - 2000 Hz
(+) | medios equilibrados - a sólo 4.5% de la mediana
(+) | los medios son lineales (3% delta a la frecuencia anterior)
Altos 2 - 16 kHz
(+) | máximos equilibrados - a sólo 1.4% de la mediana
(+) | los máximos son lineales (2% delta a la frecuencia anterior)
Total 100 - 16.000 Hz
(+) | el sonido global es lineal (10% de diferencia con la mediana)
En comparación con la misma clase
» 10% de todos los dispositivos probados de esta clase eran mejores, 1% similares, 89% peores
» El mejor tuvo un delta de 5%, la media fue 18%, el peor fue ###max##%
En comparación con todos los dispositivos probados
» 4% de todos los dispositivos probados eran mejores, 1% similares, 95% peores
» El mejor tuvo un delta de 4%, la media fue 24%, el peor fue ###max##%
Gestión de la energía: Mejor duración de la batería que el ThinkPad P1 Gen 6
Consumo de energía
El Lenovo ThinkPad P1 Gen 7 tiene un consumo de energía en reposo inferior al de la competencia, excepto el Apple MacBook Pro 16. En este sentido, la menor resolución de la pantalla probablemente compensa, aunque la mayor frecuencia de actualización de 165 Hz contrarresta esta ventaja. De fábrica, la pantalla está ajustada a 165 Hz, la frecuencia de actualización dinámica no es compatible.
Bajo carga máxima, el portátil ThinkPad consume hasta 167,5 W, lo que está dentro de los límites del cargador de 170 W.
| Off / Standby | |
| Ocioso | |
| Carga |
|
Clave:
min: | |
| Lenovo ThinkPad P1 Gen 7 21KV001SGE Ultra 7 155H, NVIDIA GeForce RTX 4060 Laptop GPU, Kioxia XG8 KXG8AZNV1T02, IPS LED, 2560x1600, 16" | Lenovo ThinkPad P1 G6 21FV001KUS i7-13800H, NVIDIA GeForce RTX 4080 Laptop GPU, Kioxia XG8 KXG8AZNV1T02, OLED, 3480x2400, 16" | Apple MacBook Pro 16 2023 M3 Pro Apple M3 Pro 12-Core, M3 Pro 18-Core GPU, Apple SSD AP0512Z, Mini-LED, 3456x2234, 16.2" | Dell XPS 16 9640 Ultra 7 155H, NVIDIA GeForce RTX 4070 Laptop GPU, Kioxia XG8 KXG80ZNV1T02, OLED, 3840x2400, 16.3" | Dell Precision 5690 Ultra 9 185H, NVIDIA RTX 5000 Ada Generation Laptop GPU, 2x Samsung PM9A1 1TB (RAID 0), OLED, 3840x2400, 16" | Medio NVIDIA GeForce RTX 4060 Laptop GPU | Media de la clase Workstation | |
|---|---|---|---|---|---|---|---|
| Power Consumption | -12% | 15% | 14% | -19% | -29% | -4% | |
| Idle Minimum * | 7.3 | 8 -10% | 4.5 38% | 7.7 -5% | 7.9 -8% | 11.5 ? -58% | 8.43 ? -15% |
| Idle Average * | 12.3 | 9.5 23% | 16.5 -34% | 10.3 16% | 12 2% | 16 ? -30% | 12.4 ? -1% |
| Idle Maximum * | 17.9 | 23.7 -32% | 16.7 7% | 10.6 41% | 28.6 -60% | 20.3 ? -13% | 17.8 ? 1% |
| Load Average * | 78.2 | 97.2 -24% | 60.4 23% | 76.5 2% | 98.8 -26% | 92.9 ? -19% | 88.4 ? -13% |
| Cyberpunk 2077 ultra external monitor * | 117.7 | ||||||
| Cyberpunk 2077 ultra * | 123.5 | ||||||
| Load Maximum * | 167.5 | 197.2 -18% | 102.9 39% | 138.5 17% | 174.8 -4% | 210 ? -25% | 154.1 ? 8% |
| Witcher 3 ultra * | 144 | 52.1 | 126.4 | 144.5 |
* ... más pequeño es mejor
Power consumption Cyberpunk / stress test
Power consumption w/external monitor
Duración de las pilas
La capacidad de la batería de 90 Wh permanece inalterada. Aún así, la duración de la batería mejora en la prueba Wi-Fi (brillo de pantalla de 150 cd/m²) en comparación con el anterior Lenovo ThinkPad P1 Gen 6. El modelo 2024 alcanza aproximadamente diez horas en lugar de cuatro como el modelo anterior. Utilizar este dispositivo sobre la marcha parece mucho más factible que con el P1 Gen 6.
| Lenovo ThinkPad P1 Gen 7 21KV001SGE Ultra 7 155H, NVIDIA GeForce RTX 4060 Laptop GPU, 90 Wh | Lenovo ThinkPad P1 G6 21FV001KUS i7-13800H, NVIDIA GeForce RTX 4080 Laptop GPU, 90 Wh | Apple MacBook Pro 16 2023 M3 Pro Apple M3 Pro 12-Core, M3 Pro 18-Core GPU, 99.6 Wh | Dell XPS 16 9640 Ultra 7 155H, NVIDIA GeForce RTX 4070 Laptop GPU, 99.5 Wh | Dell Precision 5690 Ultra 9 185H, NVIDIA RTX 5000 Ada Generation Laptop GPU, 98 Wh | Media de la clase Workstation | |
|---|---|---|---|---|---|---|
| Duración de Batería | -58% | 38% | -9% | -8% | -24% | |
| WiFi v1.3 | 595 | 252 -58% | 1204 102% | 629 6% | 549 -8% | 502 ? -16% |
| Load | 114 | 83 -27% | 87 -24% | 77.4 ? -32% |
Valoración general de Notebookcheck
El Lenovo ThinkPad P1 Gen 7 prescinde de las GPU de gama alta y utiliza dos ranuras M.2 2280, así como la nueva memoria LPCAMM2. El diseño se acerca al ThinkPad Z16 con una tapa de aluminio y un gran trackpad. En el interior, la CPU Meteor Lake mejora la eficiencia y la duración de la batería. En general, este modelo ofrece un diseño más premium y una movilidad mejorada con un rendimiento de la GPU ligeramente reducido.
Transparencia
La selección de los dispositivos que se van a reseñar corre a cargo de nuestro equipo editorial. La muestra de prueba fue proporcionada al autor en calidad de préstamo por el fabricante o el minorista a los efectos de esta reseña. El prestamista no tuvo ninguna influencia en esta reseña, ni el fabricante recibió una copia de la misma antes de su publicación. No había ninguna obligación de publicar esta reseña. Nunca aceptamos compensaciones o pagos a cambio de nuestras reseñas. Como empresa de medios independiente, Notebookcheck no está sujeta a la autoridad de fabricantes, minoristas o editores.
Así es como prueba Notebookcheck
Cada año, Notebookcheck revisa de forma independiente cientos de portátiles y smartphones utilizando procedimientos estandarizados para asegurar que todos los resultados son comparables. Hemos desarrollado continuamente nuestros métodos de prueba durante unos 20 años y hemos establecido los estándares de la industria en el proceso. En nuestros laboratorios de pruebas, técnicos y editores experimentados utilizan equipos de medición de alta calidad. Estas pruebas implican un proceso de validación en varias fases. Nuestro complejo sistema de clasificación se basa en cientos de mediciones y puntos de referencia bien fundamentados, lo que mantiene la objetividad.
