

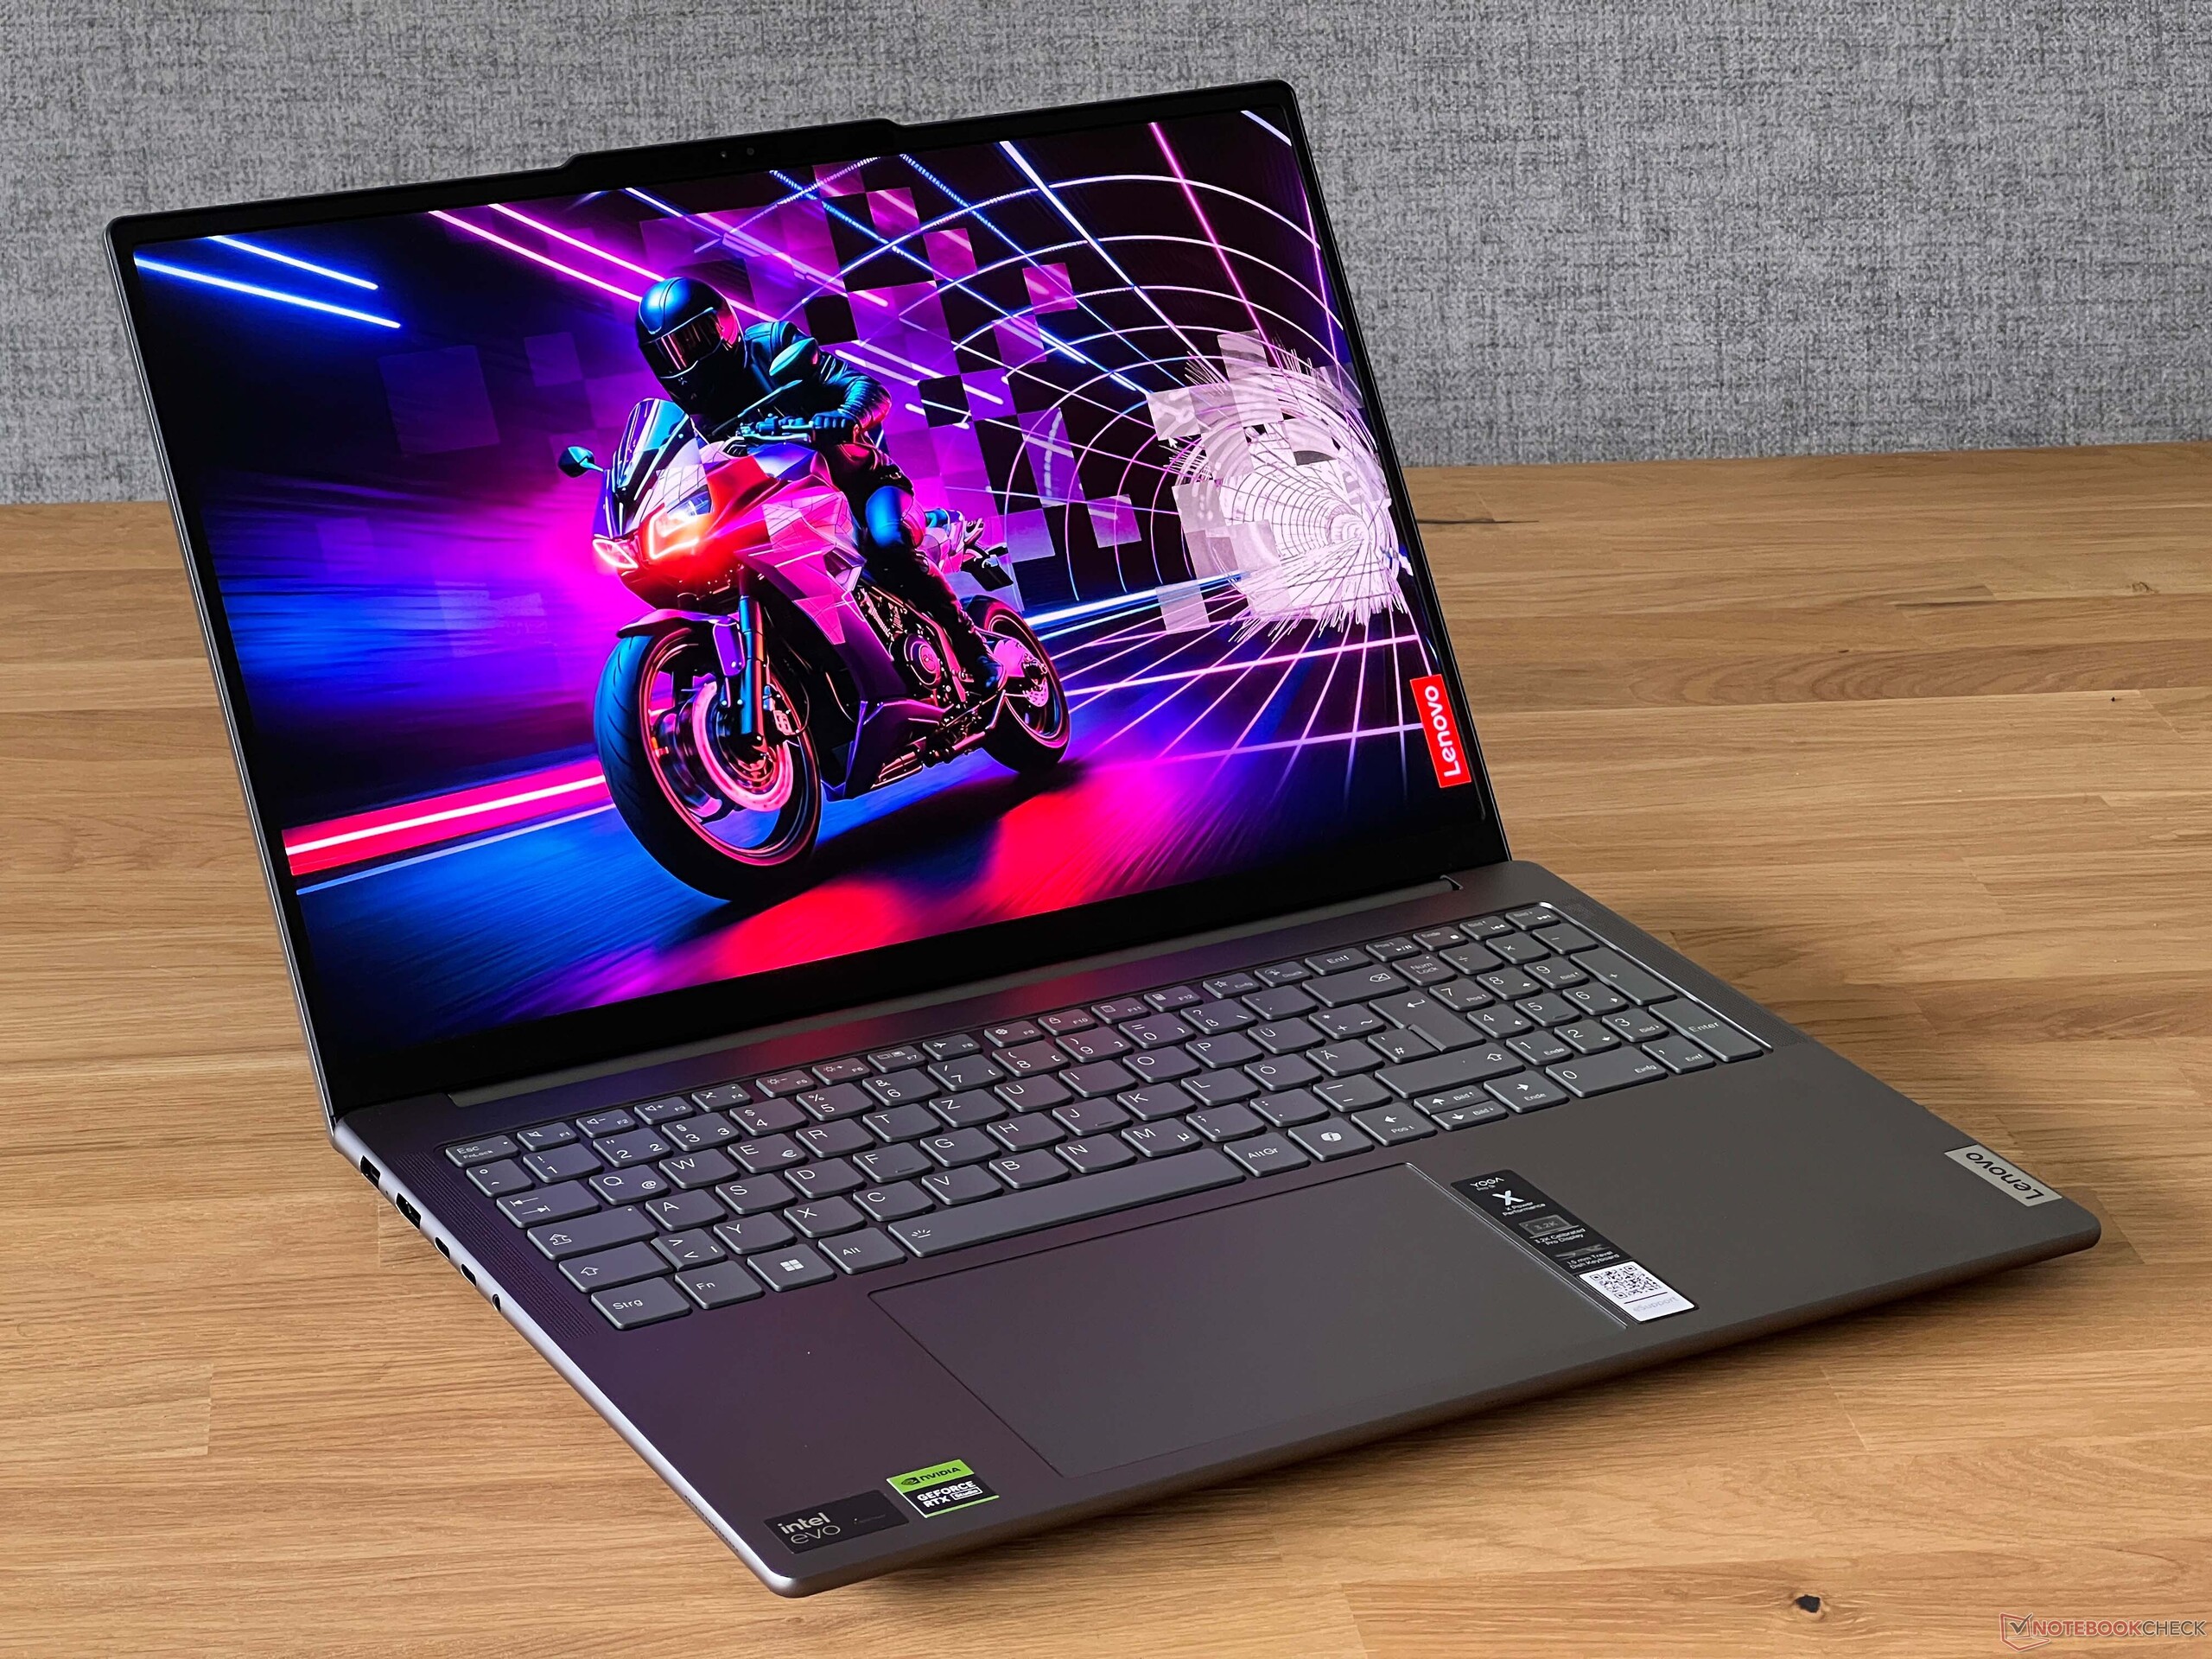
Análisis del portátil Lenovo Yoga Pro 9 16IMH9: 75 W GeForce RTX 4050 supera sus prestaciones

La serie Yoga Pro 9 alberga la línea insignia de portátiles multimedia de Lenovo por encima de la gama media alta Serie Yoga 7 16 y de gama inferior IdeaPad Pro 5 serie 16. Recientemente nos fuimos impresionados por la configuración de gama más alta del Yoga Pro 9 equipada con mini-LED y gráficos GeForce RTX 4070. Esta vez, estamos revisando un SKU menos costoso con IPS estándar y gráficos GeForce RTX 4050 en su lugar.
Nuestra configuración en revisión puede encontrarse en línea por aproximadamente 1.700 dólares. Las alternativas incluyen otros portátiles multimedia o centrados en el estudio de 16 pulgadas como el MSI Stealth 16,HP Envy x360 2 en 1 16, Dell XPS 16 9640o Samsung Galaxy Book4 Ultra.
Más reseñas de Lenovo:
Posibles contendientes en la comparación
Valoración | Fecha | Modelo | Peso | Altura | Tamaño | Resolución | Precio |
|---|---|---|---|---|---|---|---|
| 91.7 % v7 (old) | 06/2024 | Lenovo Yoga Pro 9 16IMH9 RTX 4050 Ultra 9 185H, NVIDIA GeForce RTX 4050 Laptop GPU | 2.1 kg | 18.3 mm | 16.00" | 3200x2000 | |
| 88.7 % v7 (old) | 04/2024 | Lenovo Yoga Pro 9 16IMH9 Ultra 9 185H, NVIDIA GeForce RTX 4070 Laptop GPU | 2.1 kg | 18.3 mm | 16.00" | 3200x2000 | |
| 87.2 % v7 (old) | 05/2024 | HP Envy x360 2-in-1 16-ad0097nr R7 8840HS, Radeon 780M | 1.8 kg | 18.3 mm | 16.00" | 2880x1800 | |
| 88.6 % v7 (old) | 04/2024 | Dell XPS 16 9640 Ultra 7 155H, NVIDIA GeForce RTX 4070 Laptop GPU | 2.3 kg | 18.7 mm | 16.30" | 3840x2400 | |
| 90.4 % v7 (old) | 03/2024 | Samsung Galaxy Book4 Ultra Ultra 7 155H, NVIDIA GeForce RTX 4050 Laptop GPU | 1.8 kg | 17 mm | 16.00" | 2880x1800 | |
| 87.6 % v7 (old) | 11/2023 | Asus VivoBook Pro 16 K6602VU i9-13900H, NVIDIA GeForce RTX 4050 Laptop GPU | 1.9 kg | 19 mm | 16.00" | 3200x2000 |
Caso

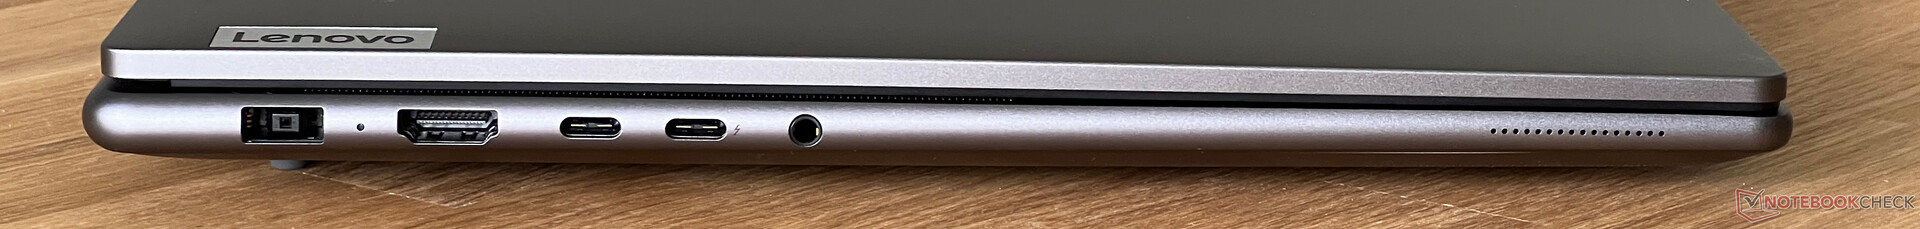
Conectividad
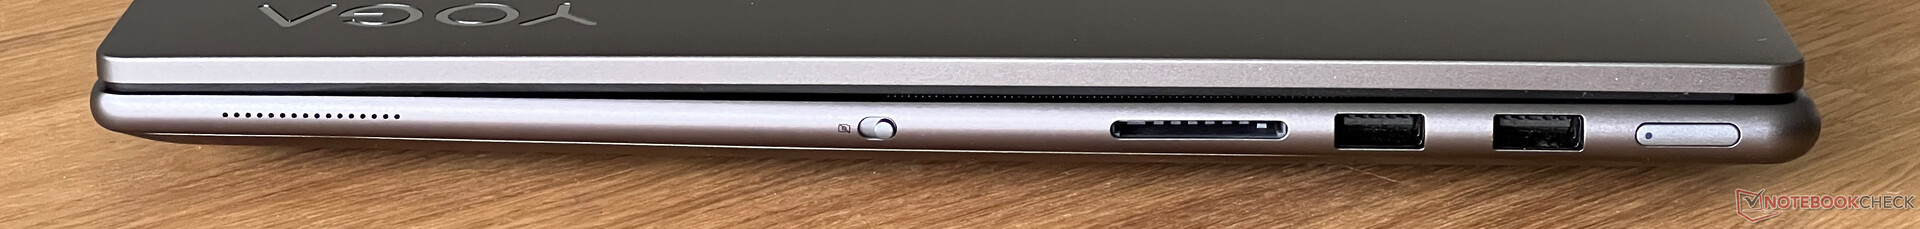
Lector de tarjetas SD
| SD Card Reader | |
| average JPG Copy Test (av. of 3 runs) | |
| Asus VivoBook Pro 16 K6602VU (Angelbird AV Pro V60) | |
| Dell XPS 16 9640 (Angelbird AV Pro V60) | |
| Lenovo Yoga Pro 9 16IMH9 RTX 4050 (Angelbird AV Pro V60) | |
| Samsung Galaxy Book4 Ultra (Angelbird AV Pro V60) | |
| Lenovo Yoga Pro 9 16IMH9 (Angelbird AV Pro V60) | |
| maximum AS SSD Seq Read Test (1GB) | |
| Asus VivoBook Pro 16 K6602VU (Angelbird AV Pro V60) | |
| Dell XPS 16 9640 (Angelbird AV Pro V60) | |
| Lenovo Yoga Pro 9 16IMH9 RTX 4050 (Angelbird AV Pro V60) | |
| Lenovo Yoga Pro 9 16IMH9 (Angelbird AV Pro V60) | |
| Samsung Galaxy Book4 Ultra (Angelbird AV Pro V60) | |
Comunicación
Cámara web


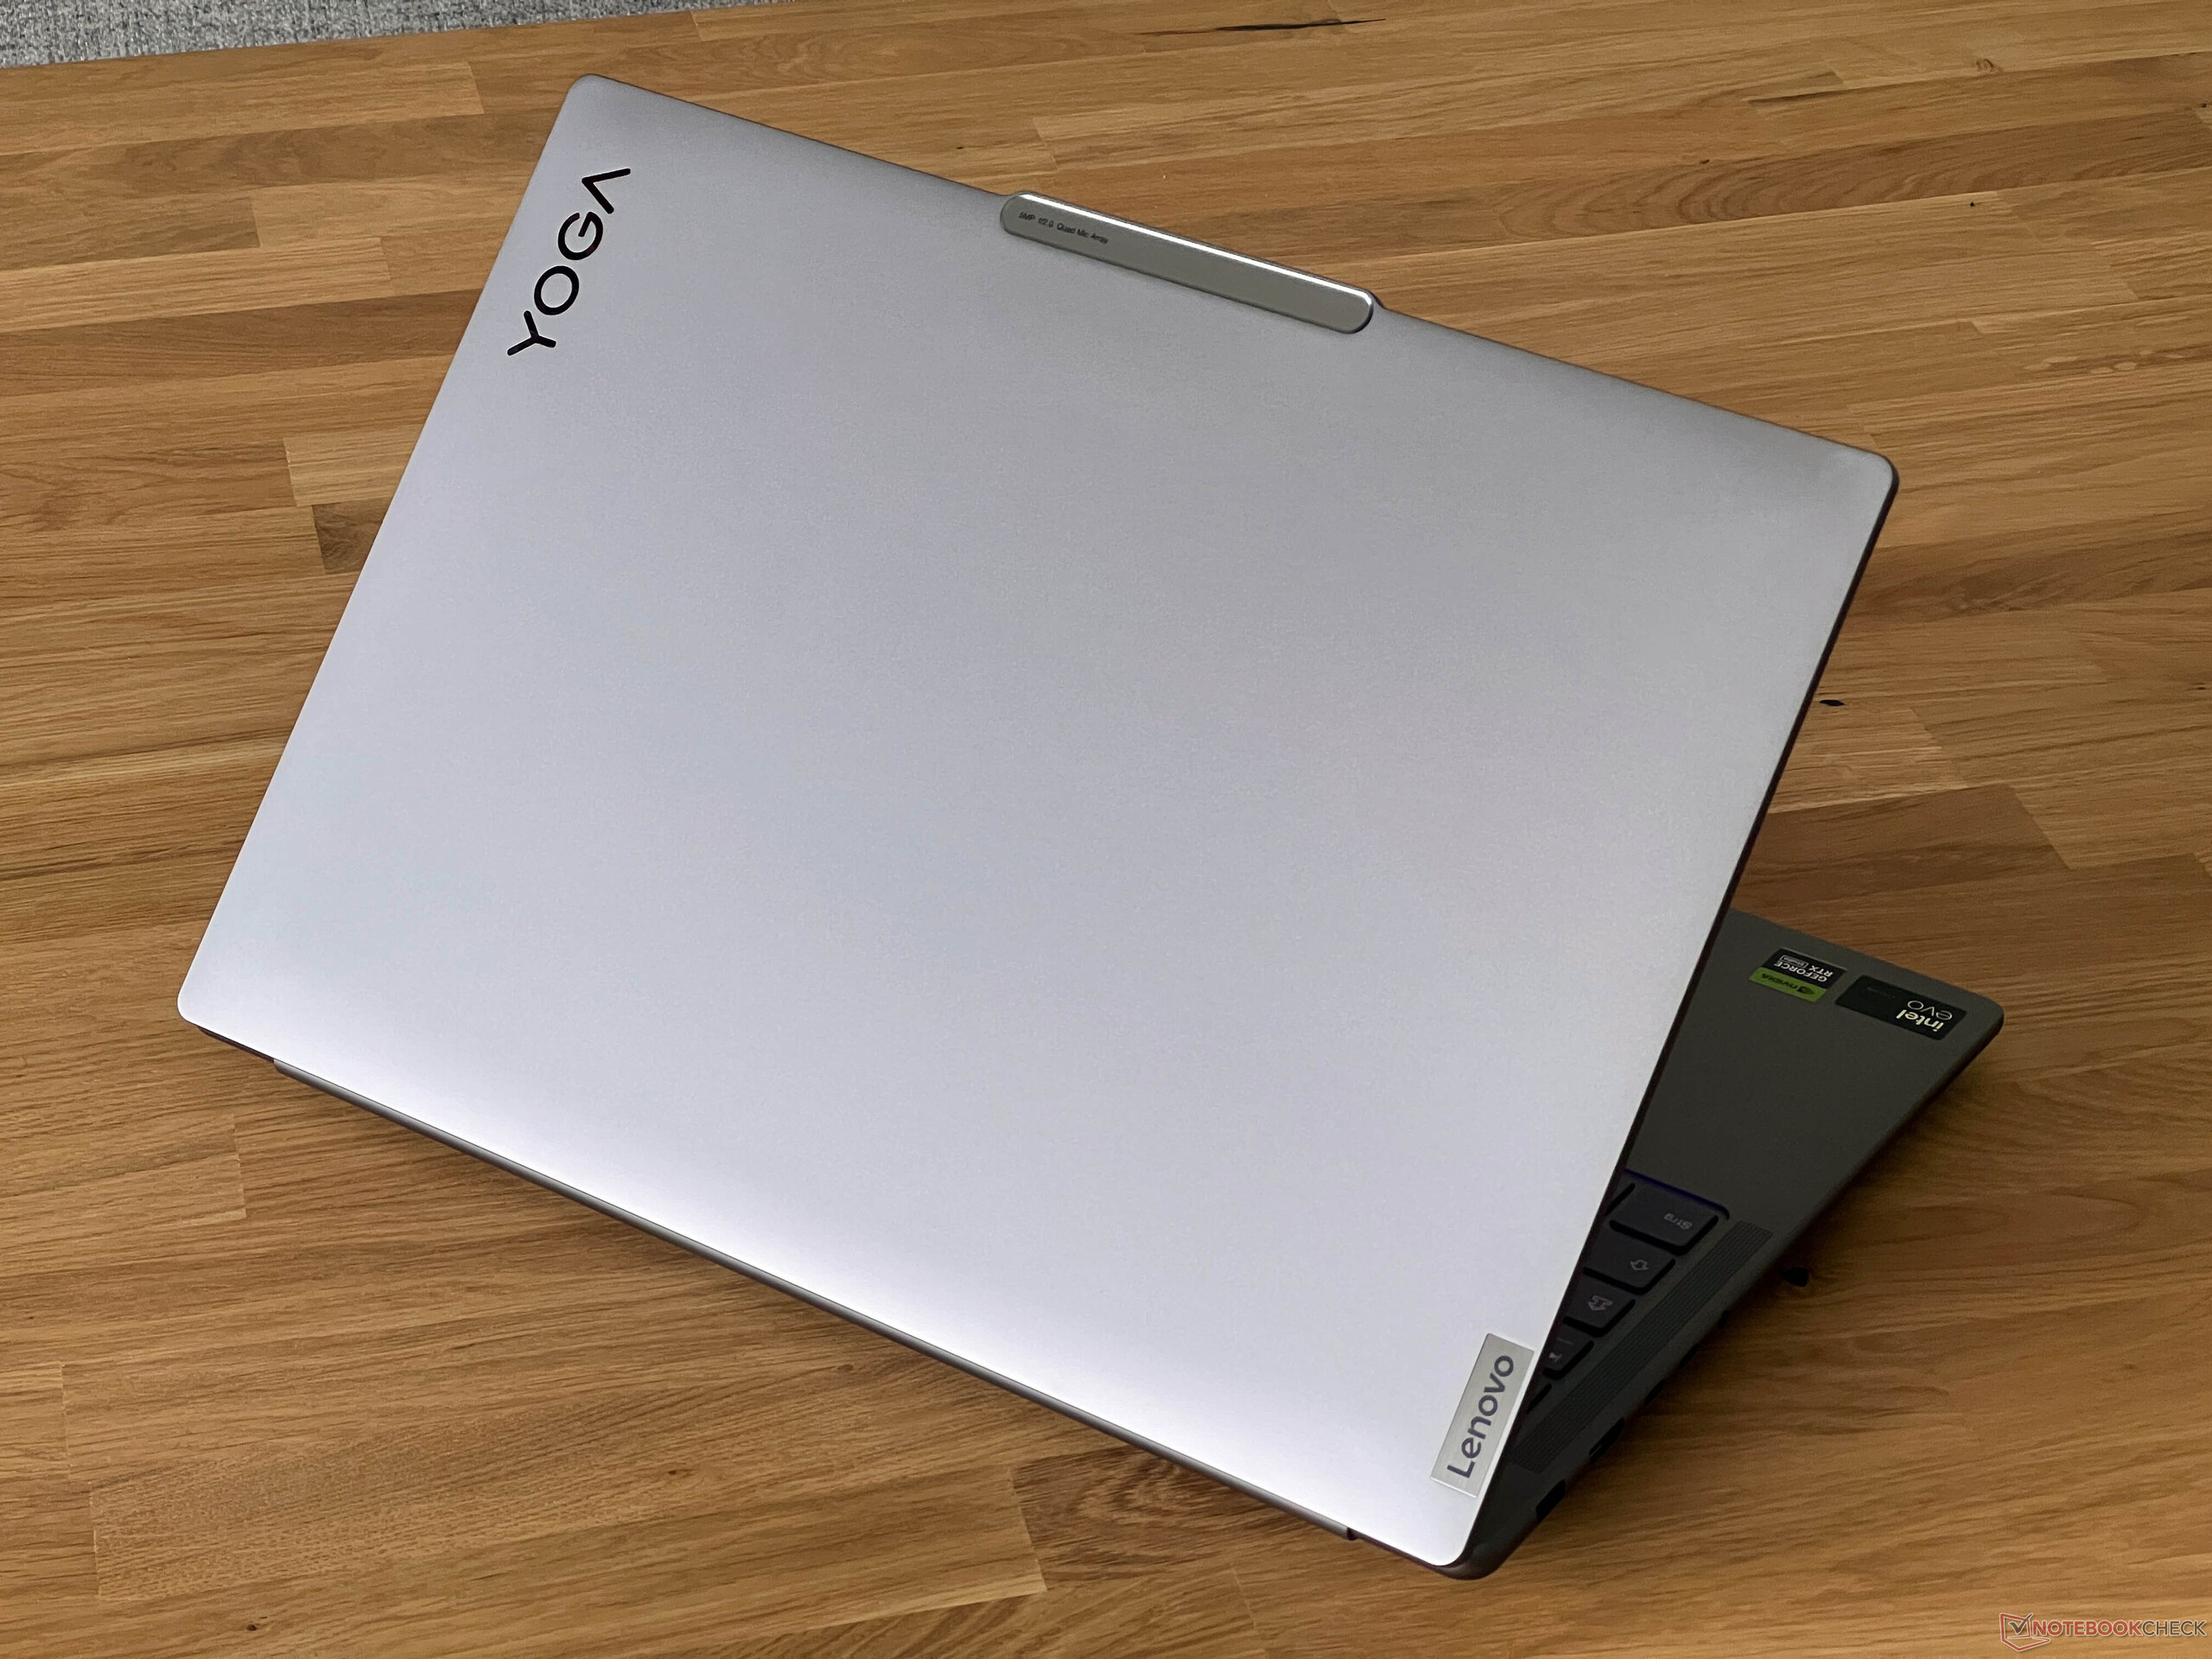
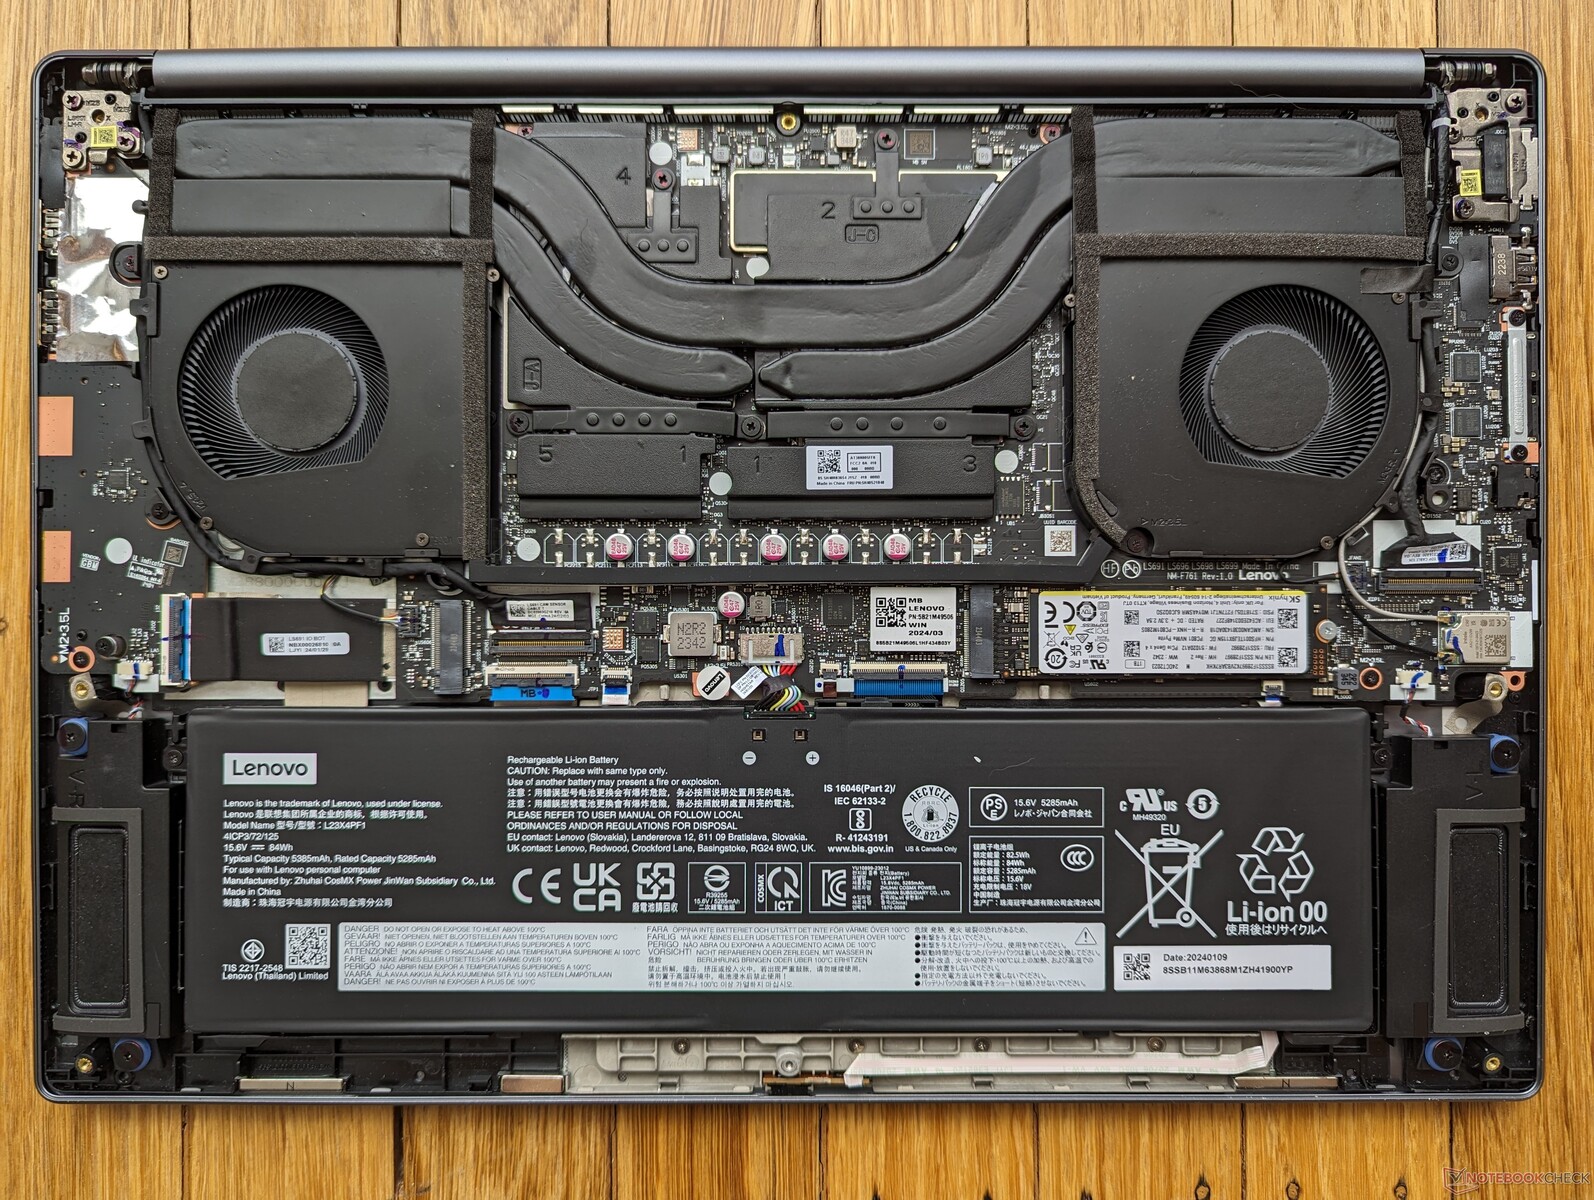
Mantenimiento

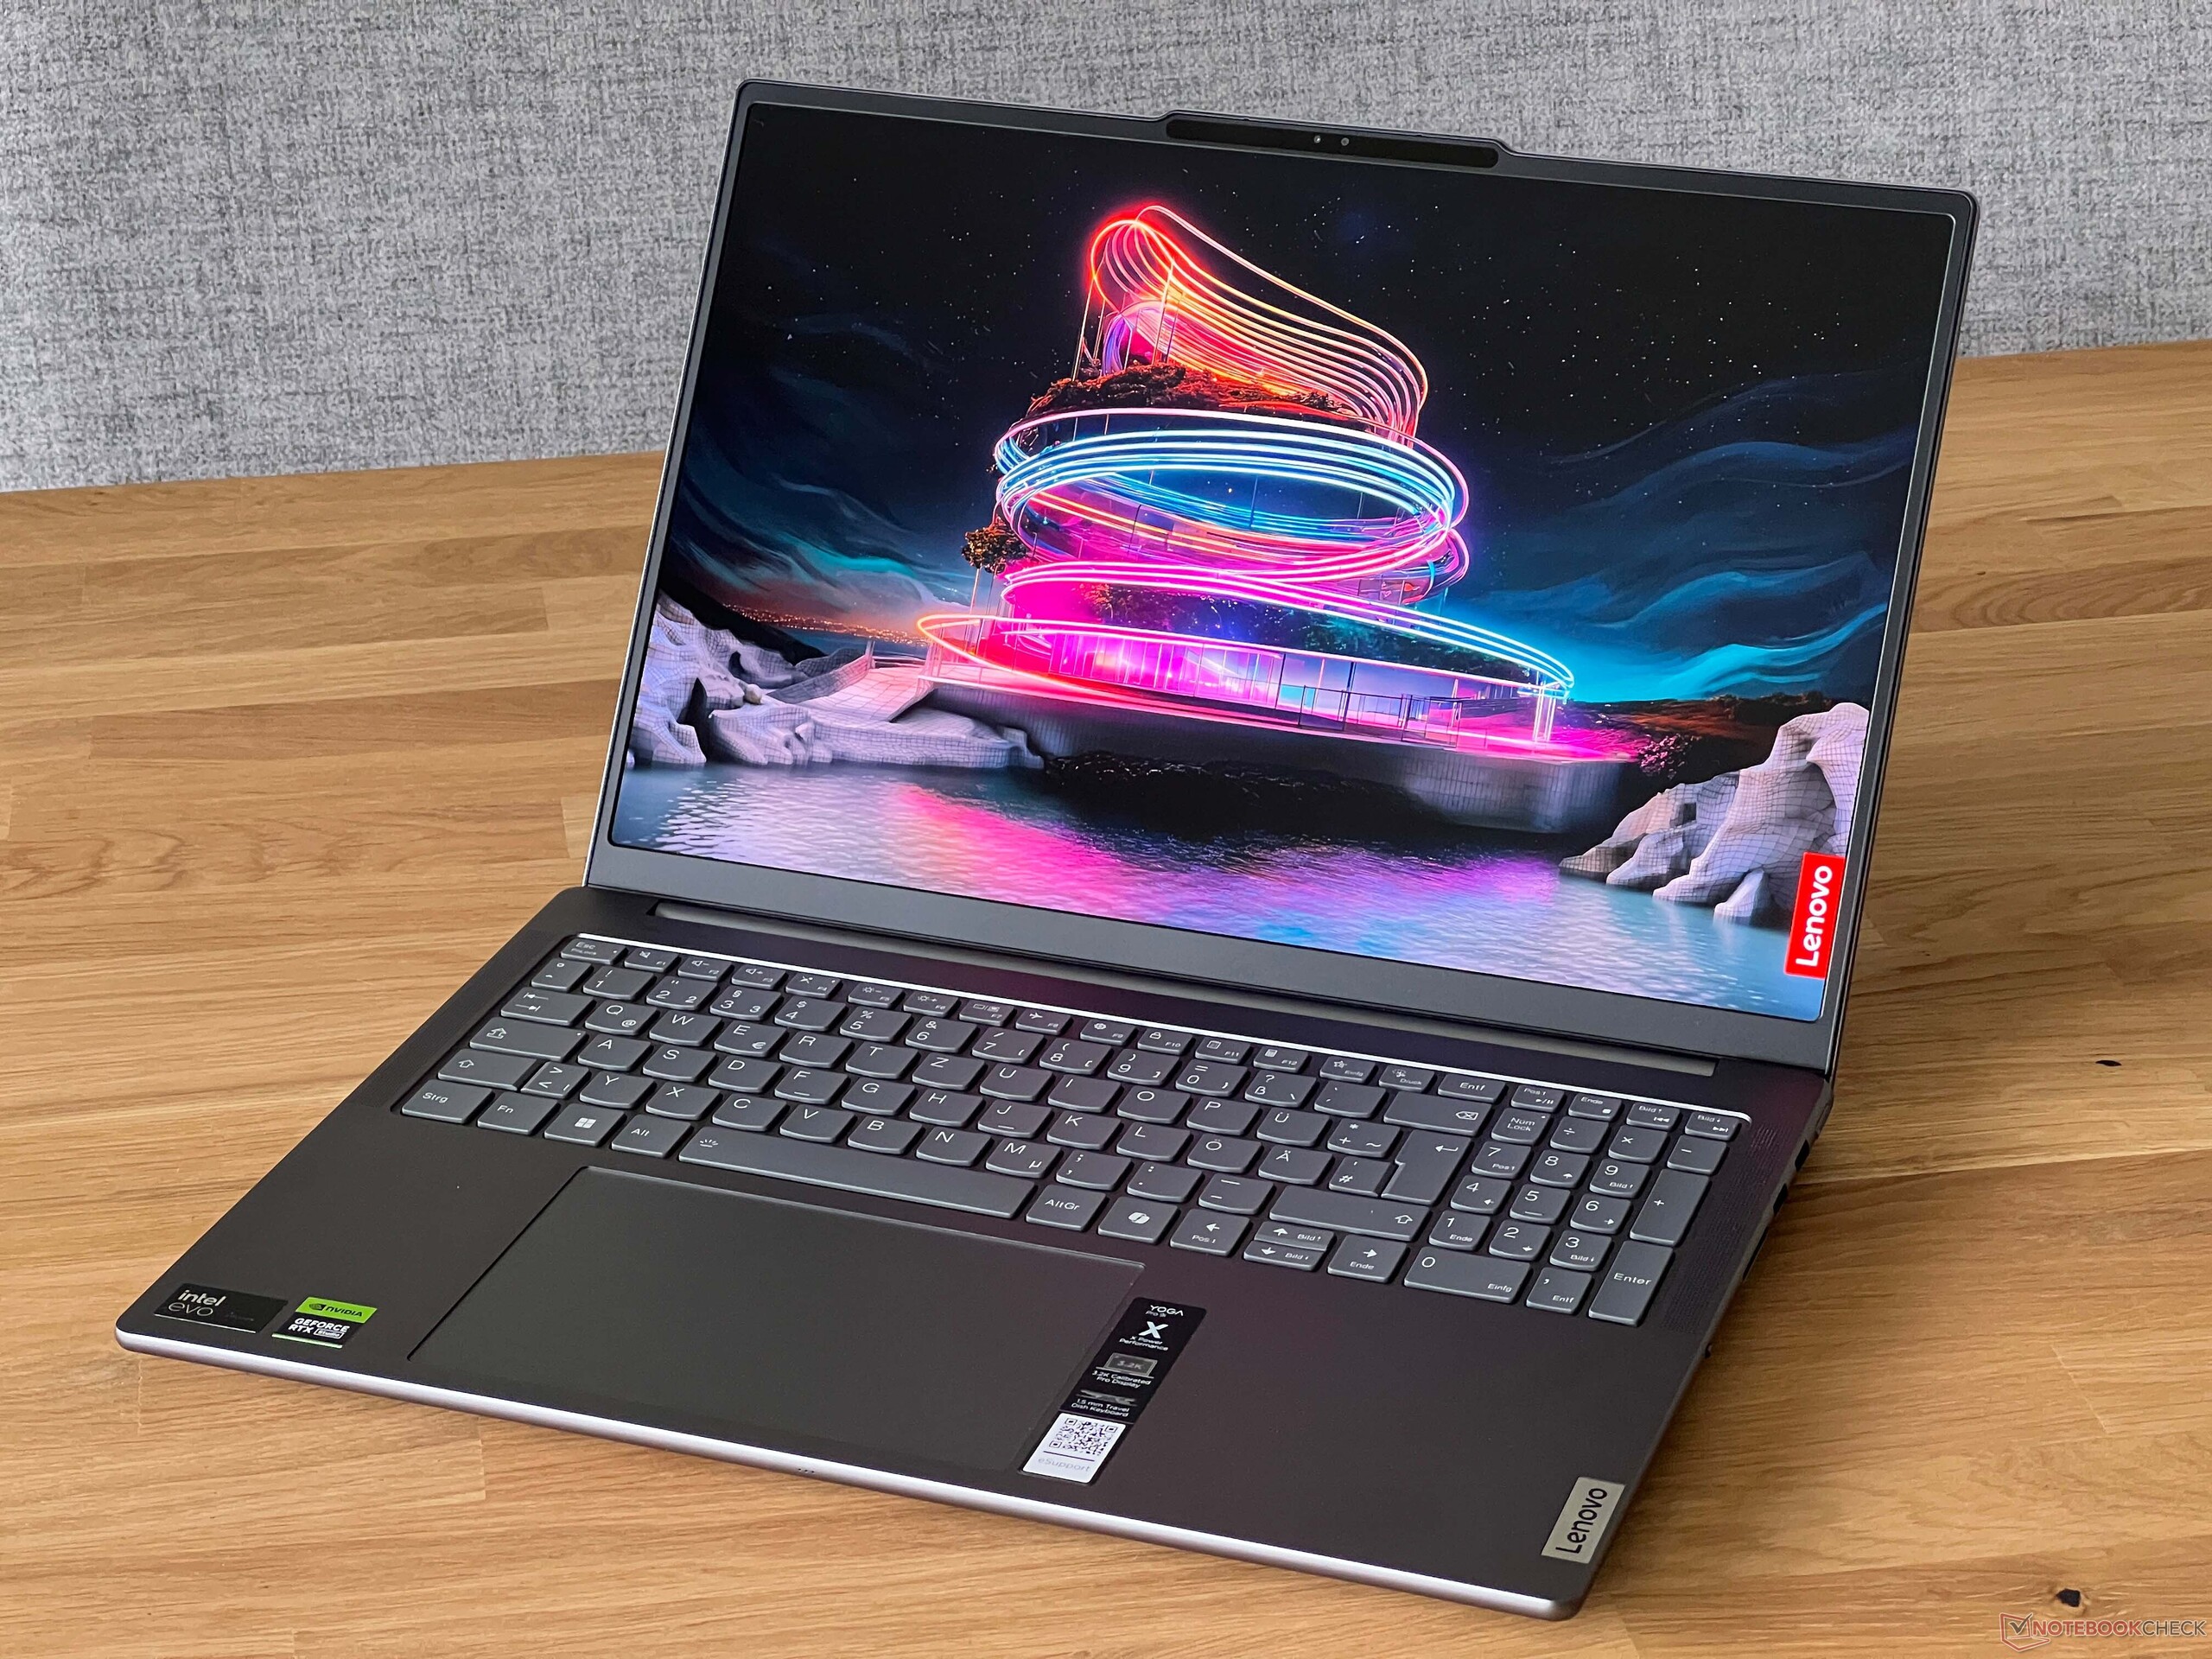
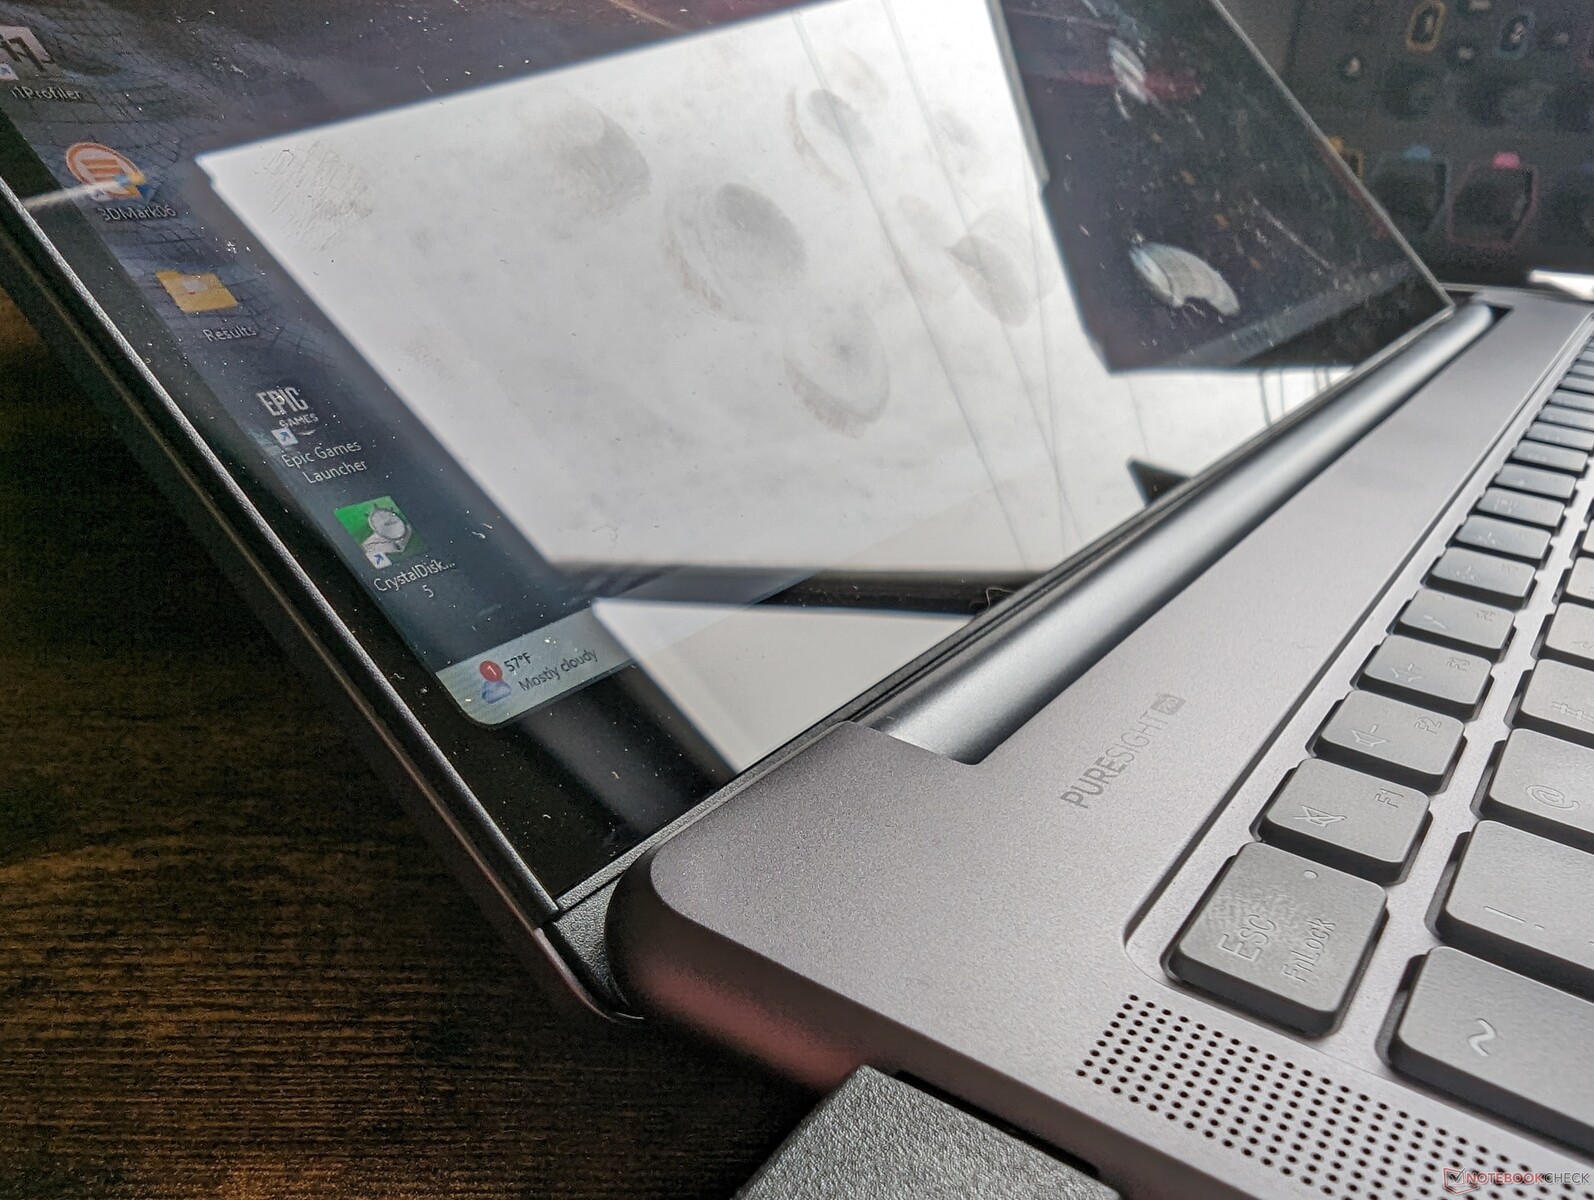
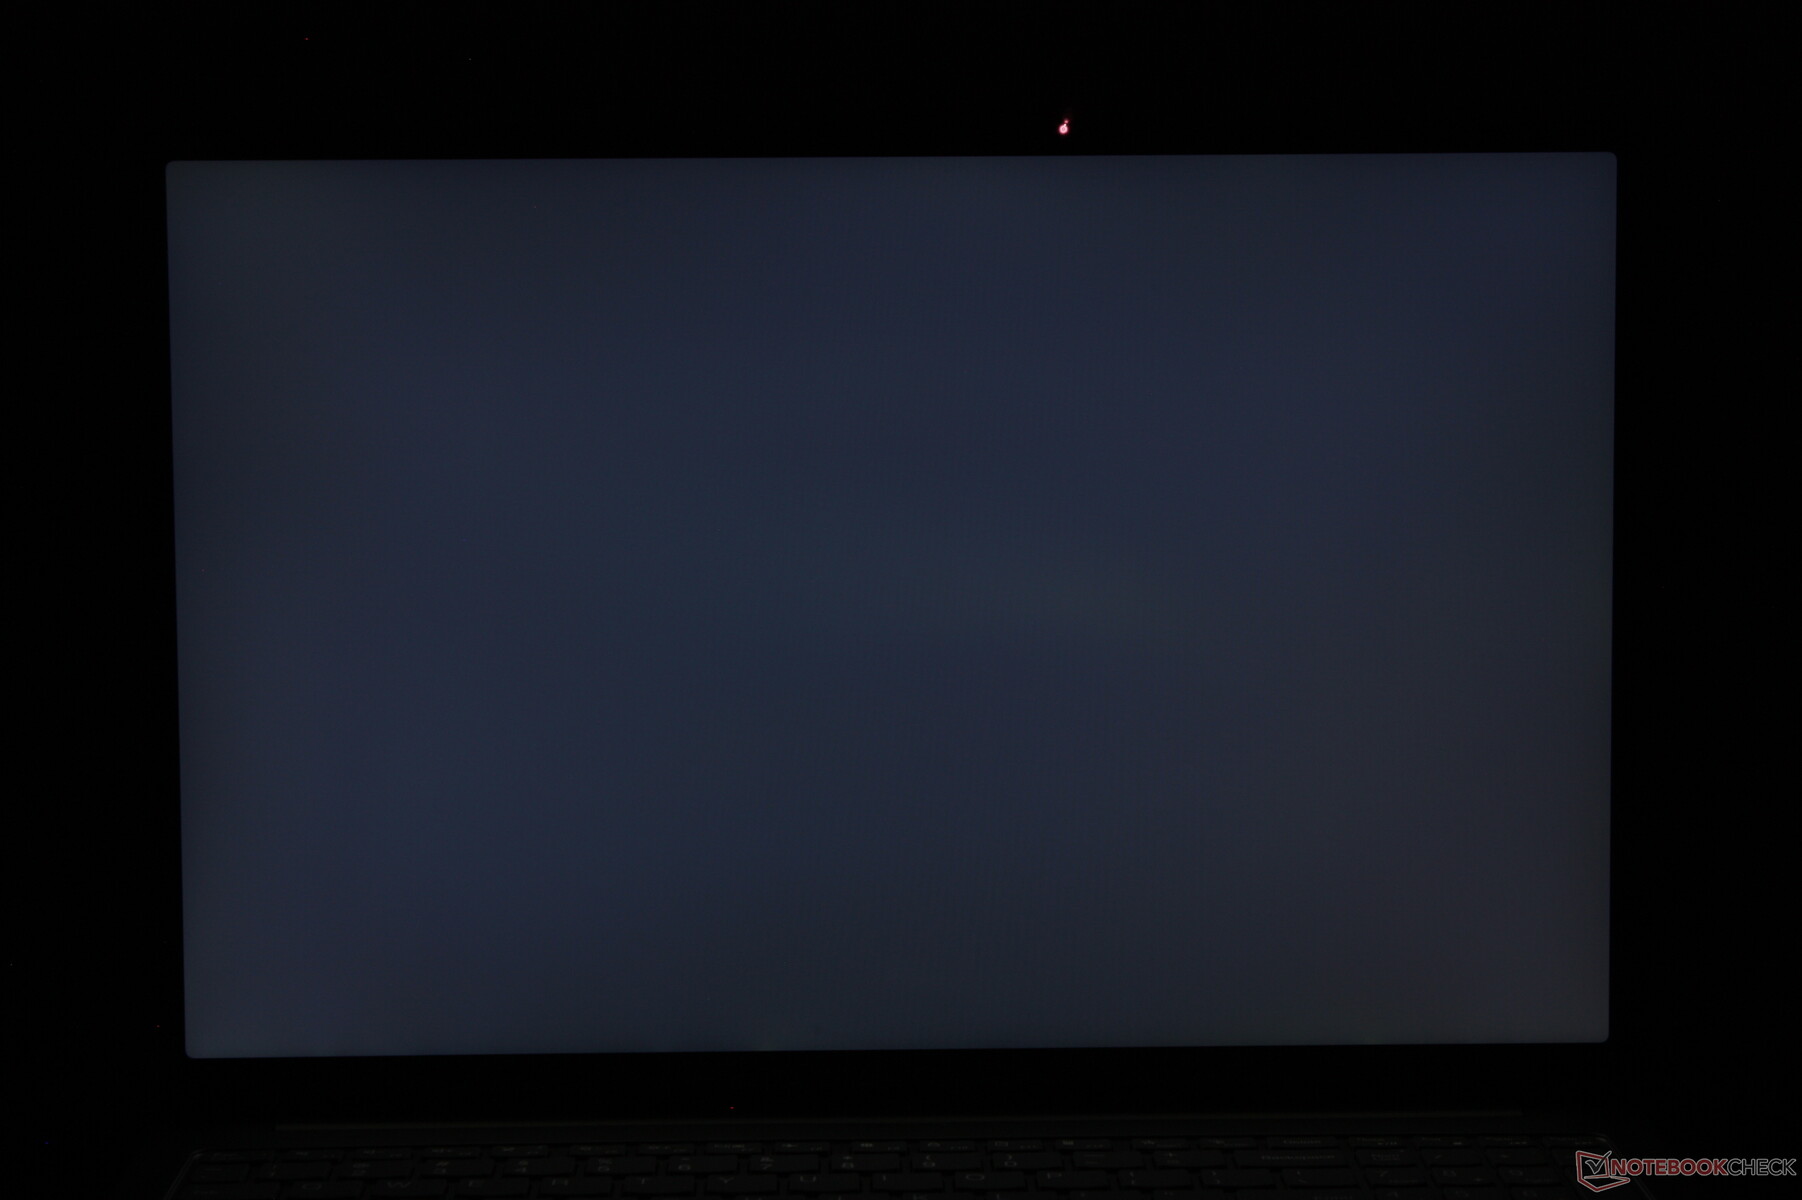
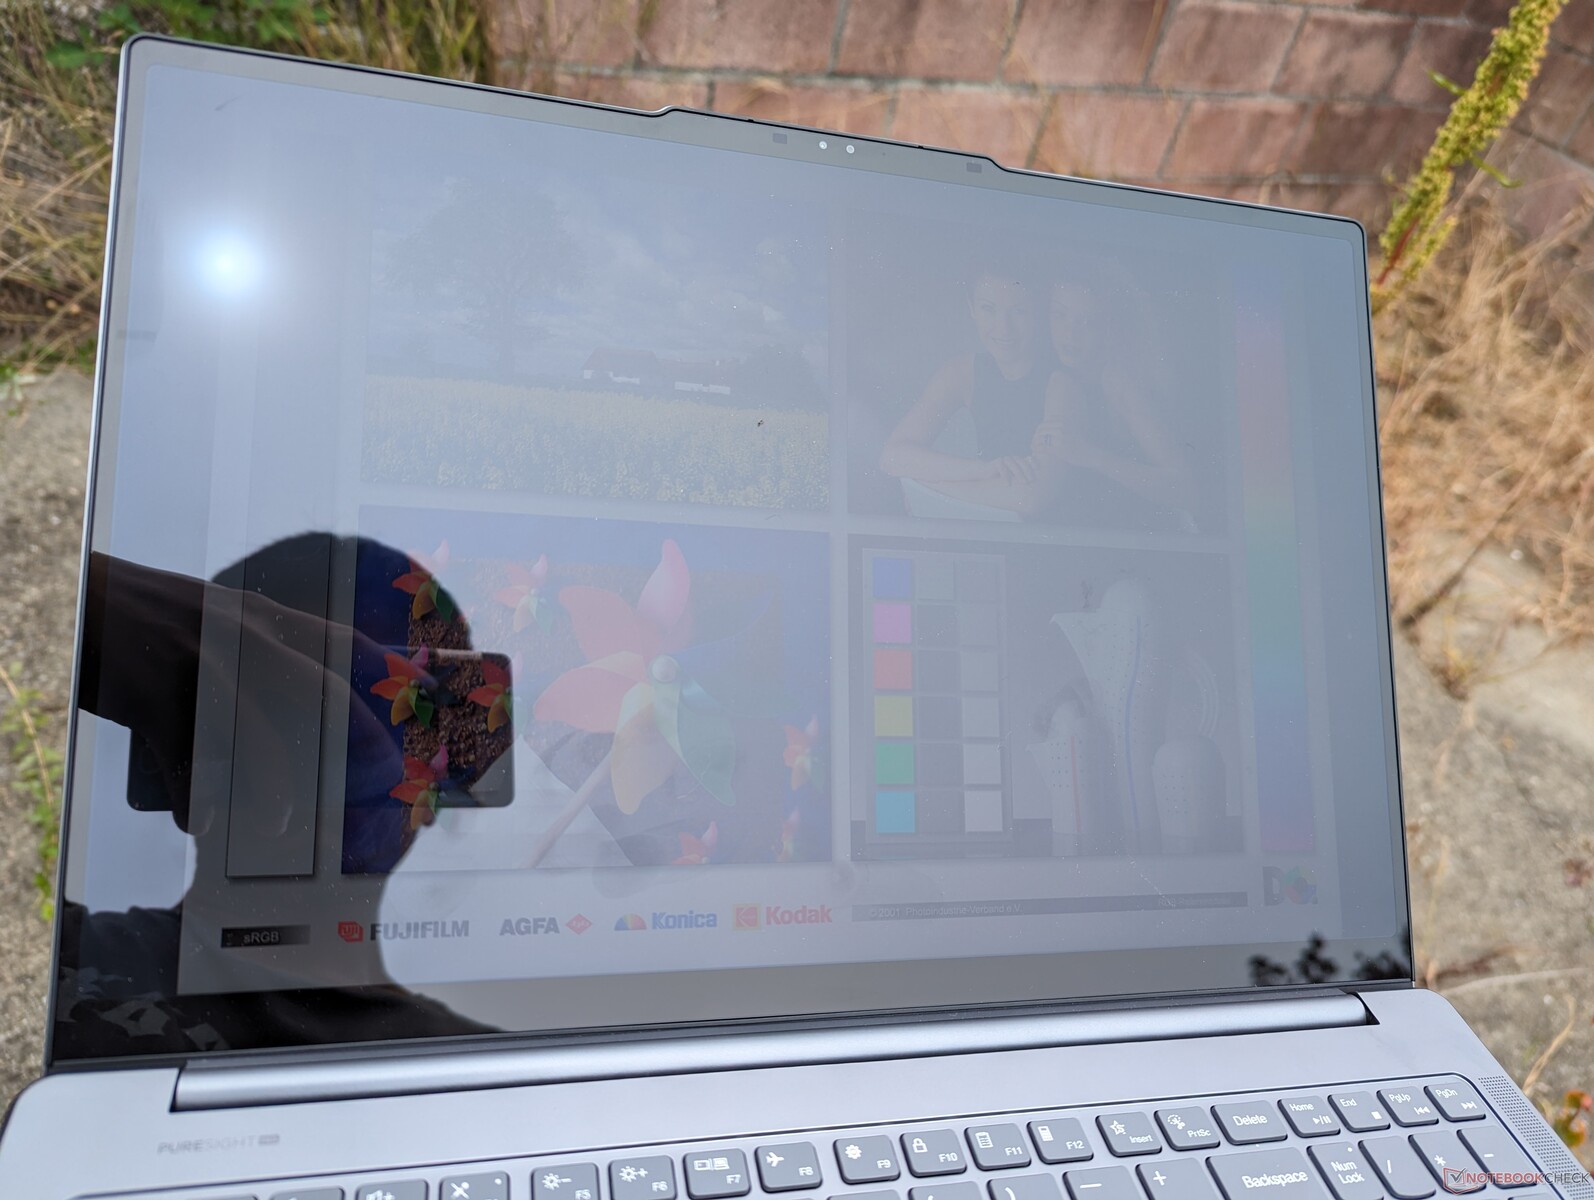
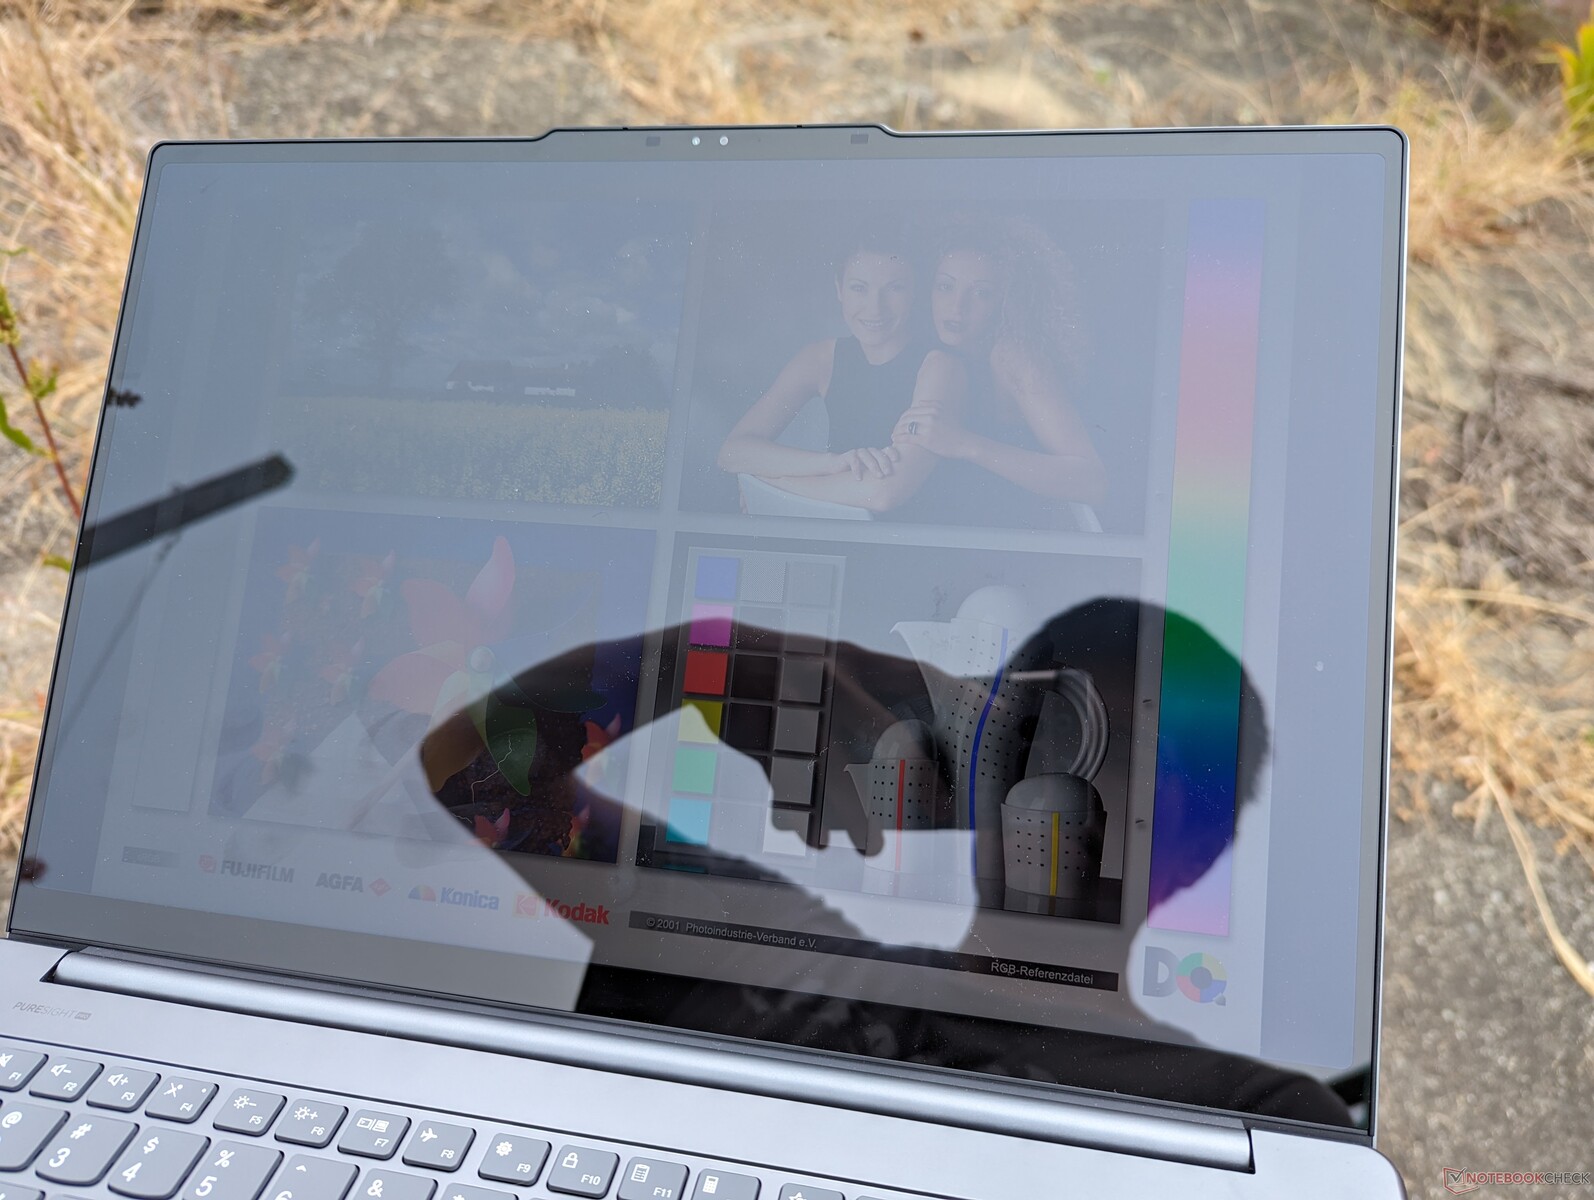
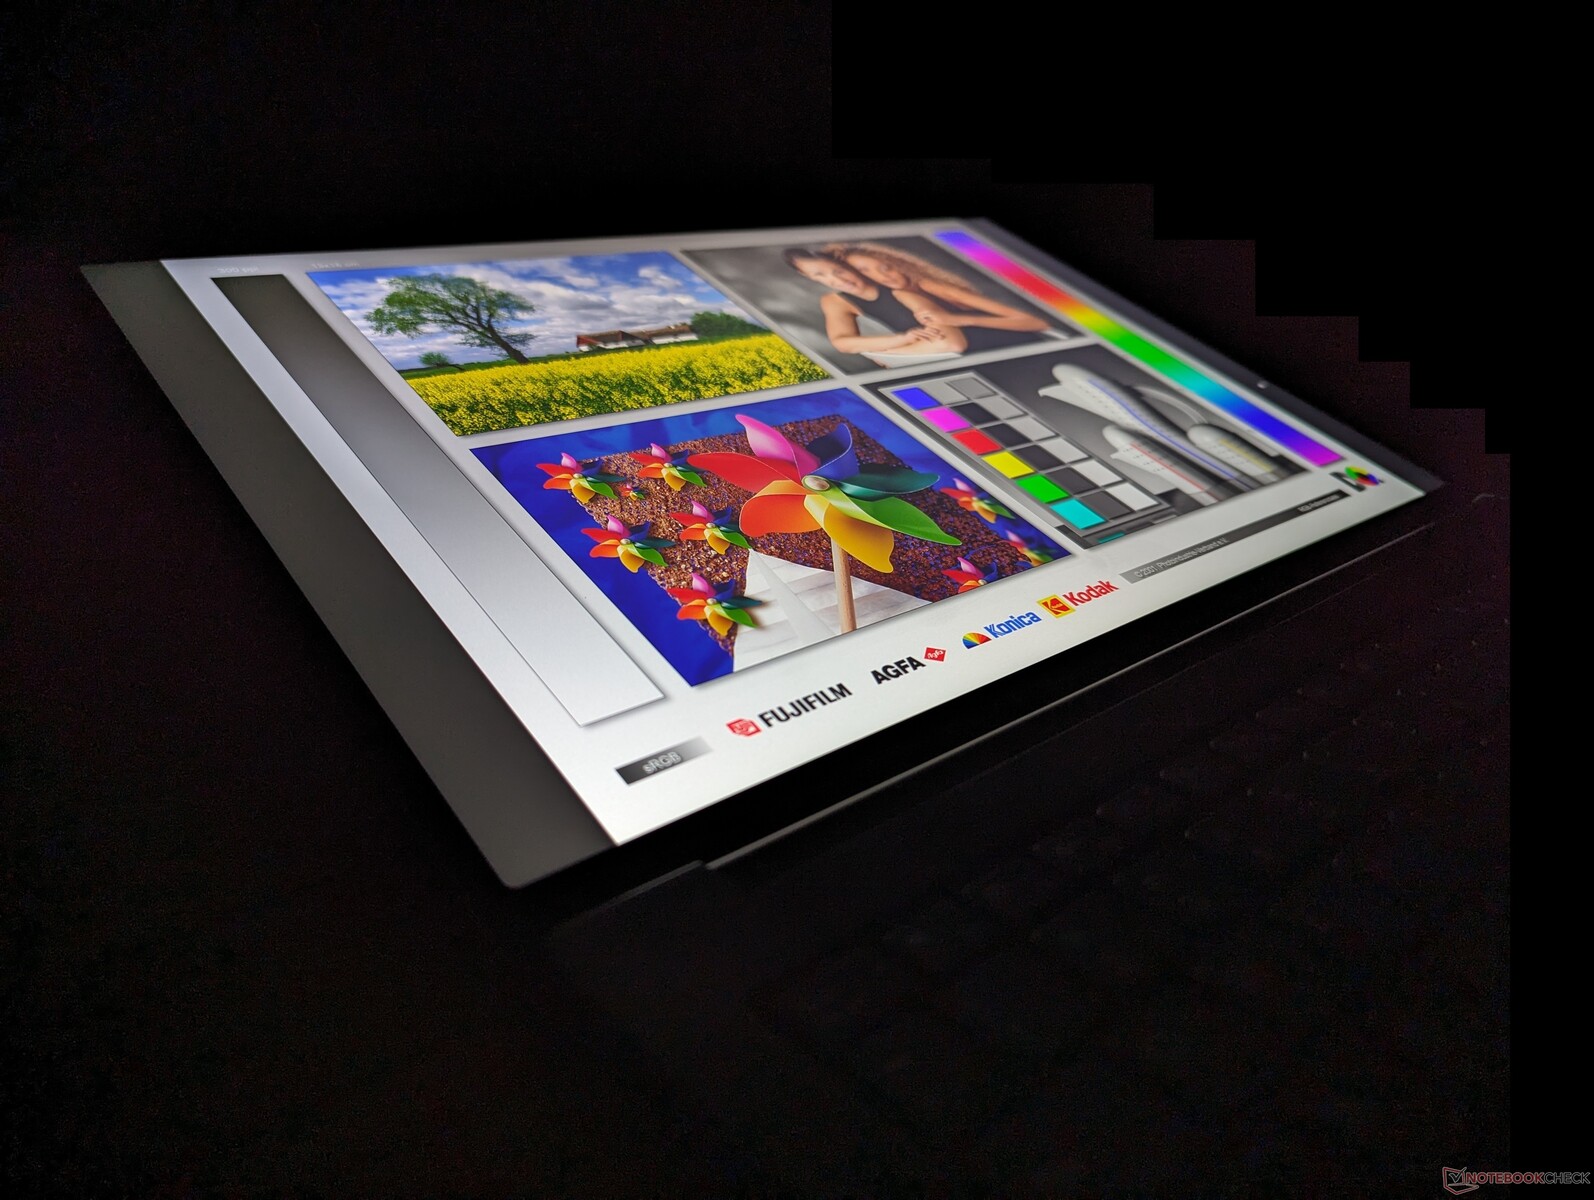
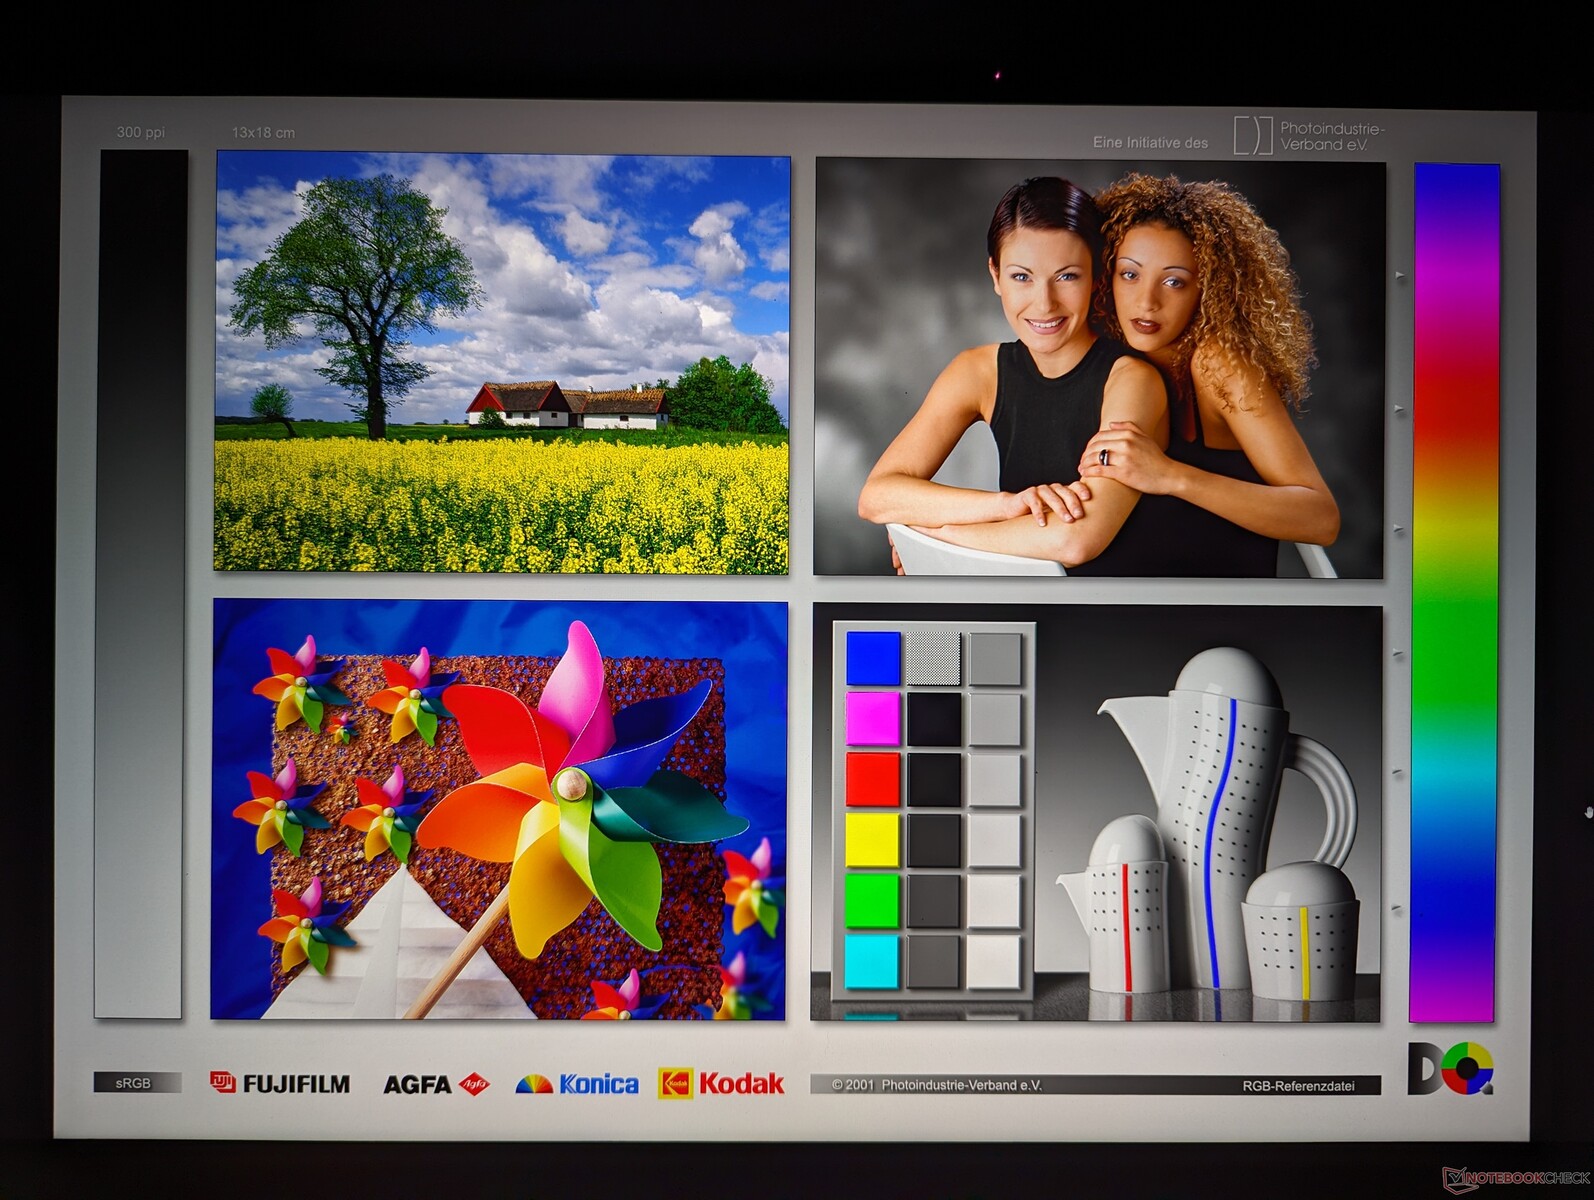
Pantalla - 3.2K IPS y opciones Mini-LED
Lenovo ofrece las siguientes tres opciones de pantalla. Todos los paneles tienen la misma resolución nativa de 3200 x 2000 y frecuencia de actualización con soporte Advanced Optimus pero sin G-Sync. Nuestra unidad de prueba lleva la opción en negrita a continuación, mientras que la configuración RTX 4070 de gama alta lleva la opción mini-LED.
- 3.2K, 165 Hz, IPS, 400 nits, 100% P3, mate, no táctil
- 3.2K, 165 Hz, IPS, 400 nits, 100% P3, brillante, táctil
- 3.2K, 165 Hz, Mini-LED, 1200 nits, 100% P3, brillante, táctil
La experiencia visual entre las opciones IPS y mini-LED es sorprendentemente bastante similar ya que sus gamas de colores y frecuencias de actualización son esencialmente las mismas. IPS, sin embargo, se beneficia tanto de tiempos de respuesta en blanco y negro más rápidos como de la ausencia de problemas importantes de efecto halo en comparación con mini-LED. Sus diferencias, en cambio, se amplifican cuando se ejecutan contenidos con HDR, que es donde la mini-LED realmente brilla con sus niveles superiores de contraste y brillo. Por tanto, los usuarios que vean o reproduzcan mucho contenido multimedia HDR pueden preferir el mini-LED, mientras que los que quieran ahorrar dinero o no les importe renunciar al HDR pueden obtener una experiencia más tradicional con el IPS.

| |||||||||||||||||||||||||
iluminación: 91 %
Brillo con batería: 404.9 cd/m²
Contraste: 1012:1 (Negro: 0.4 cd/m²)
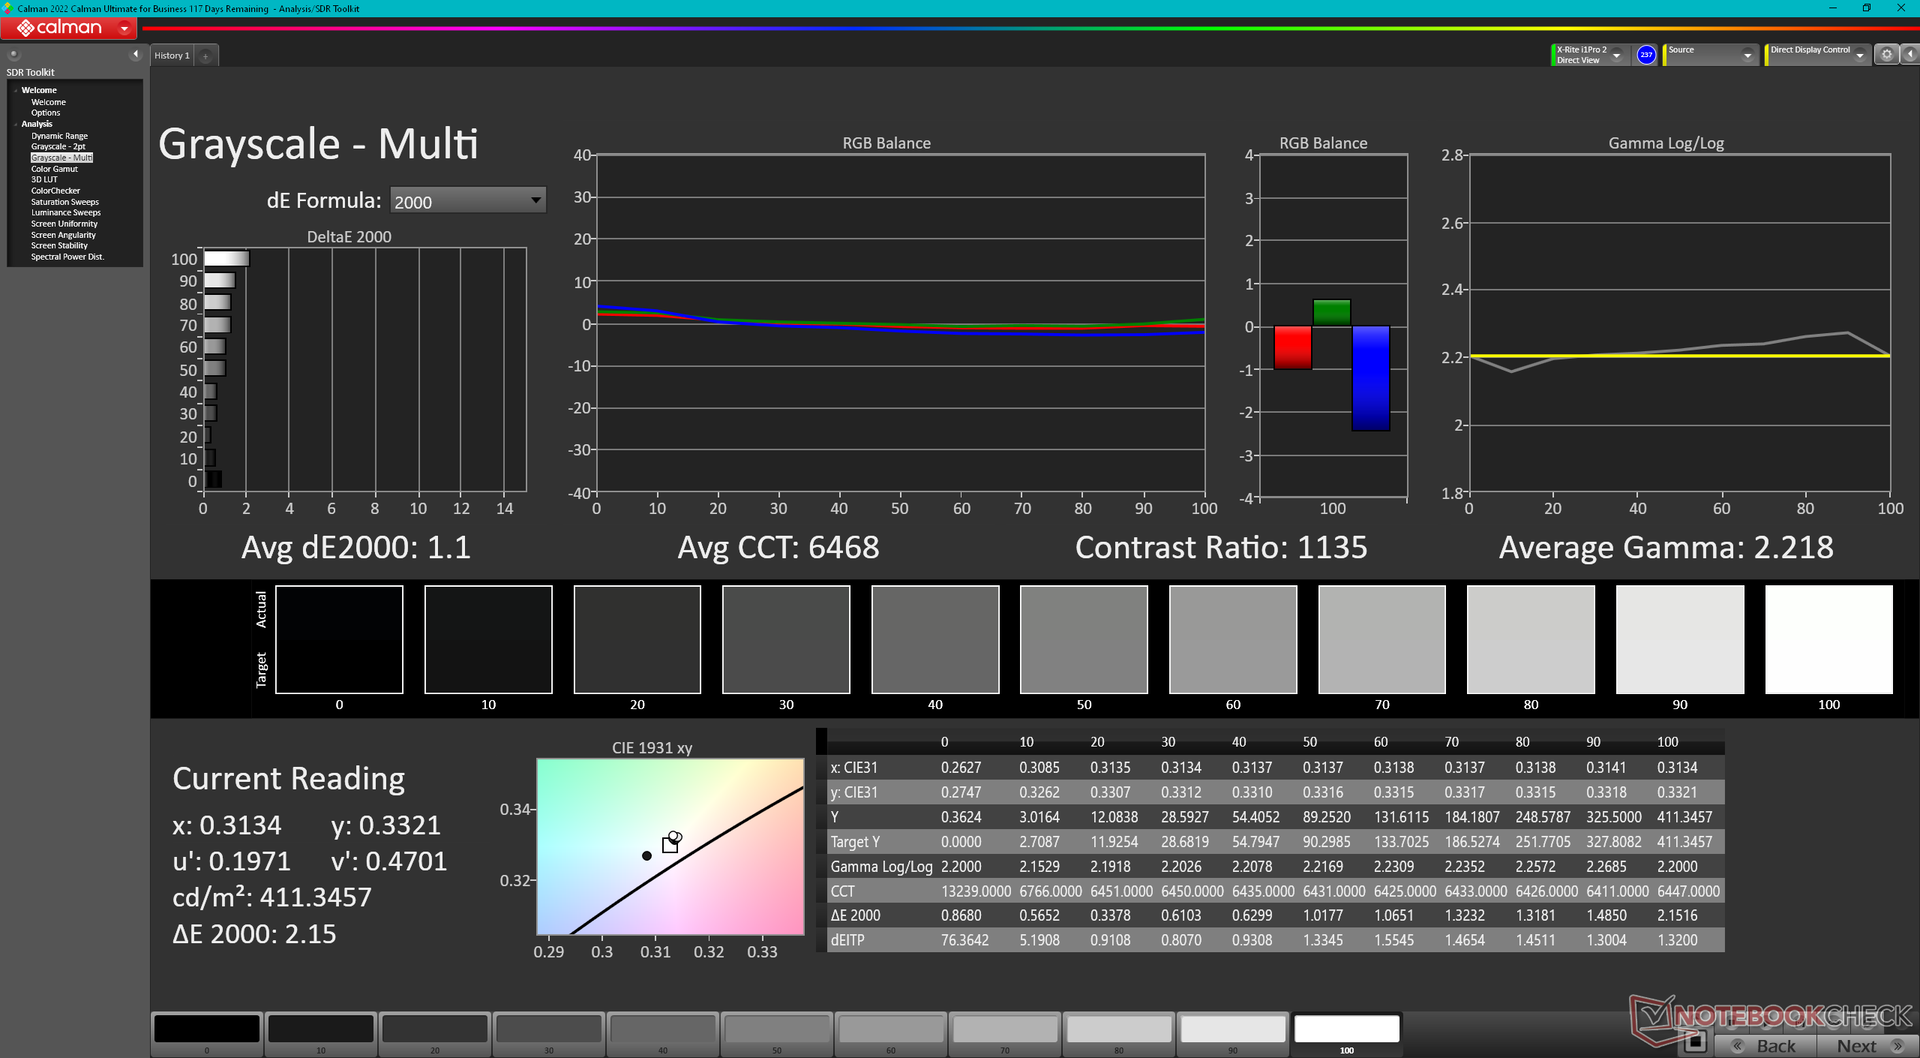
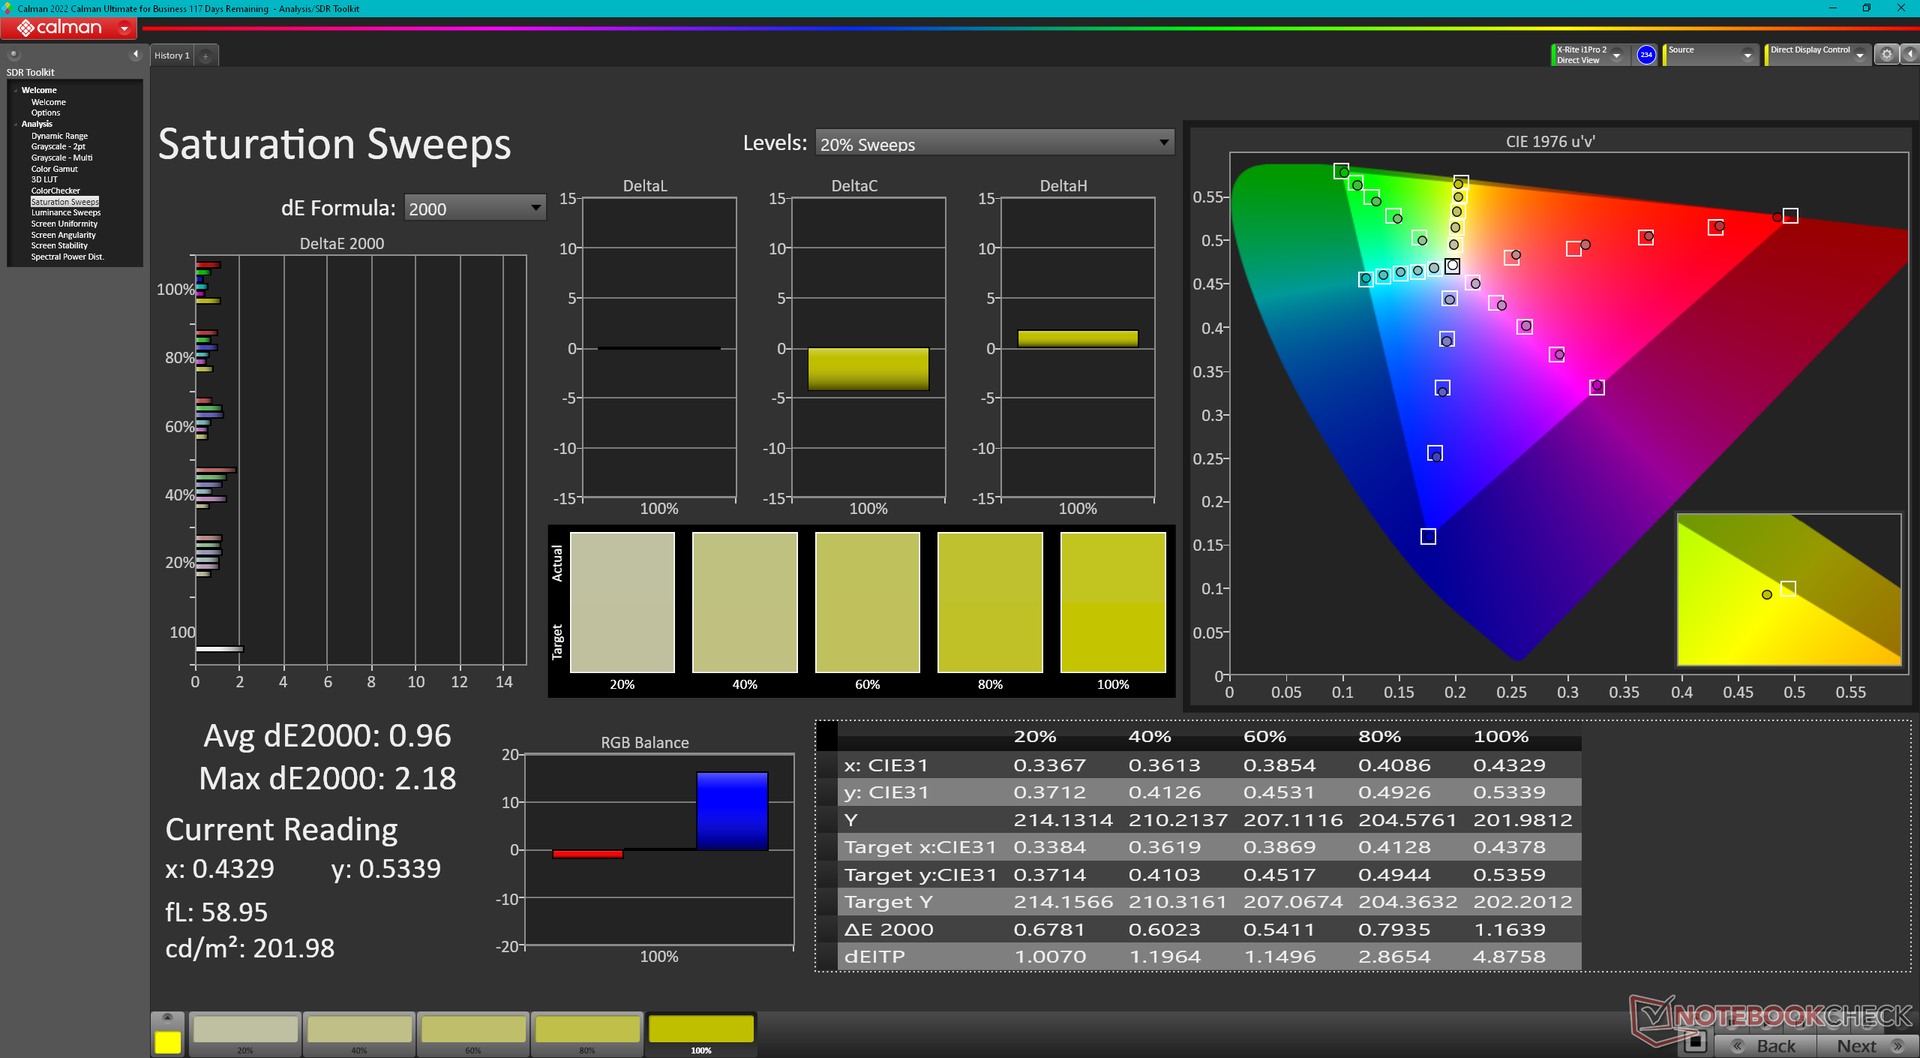
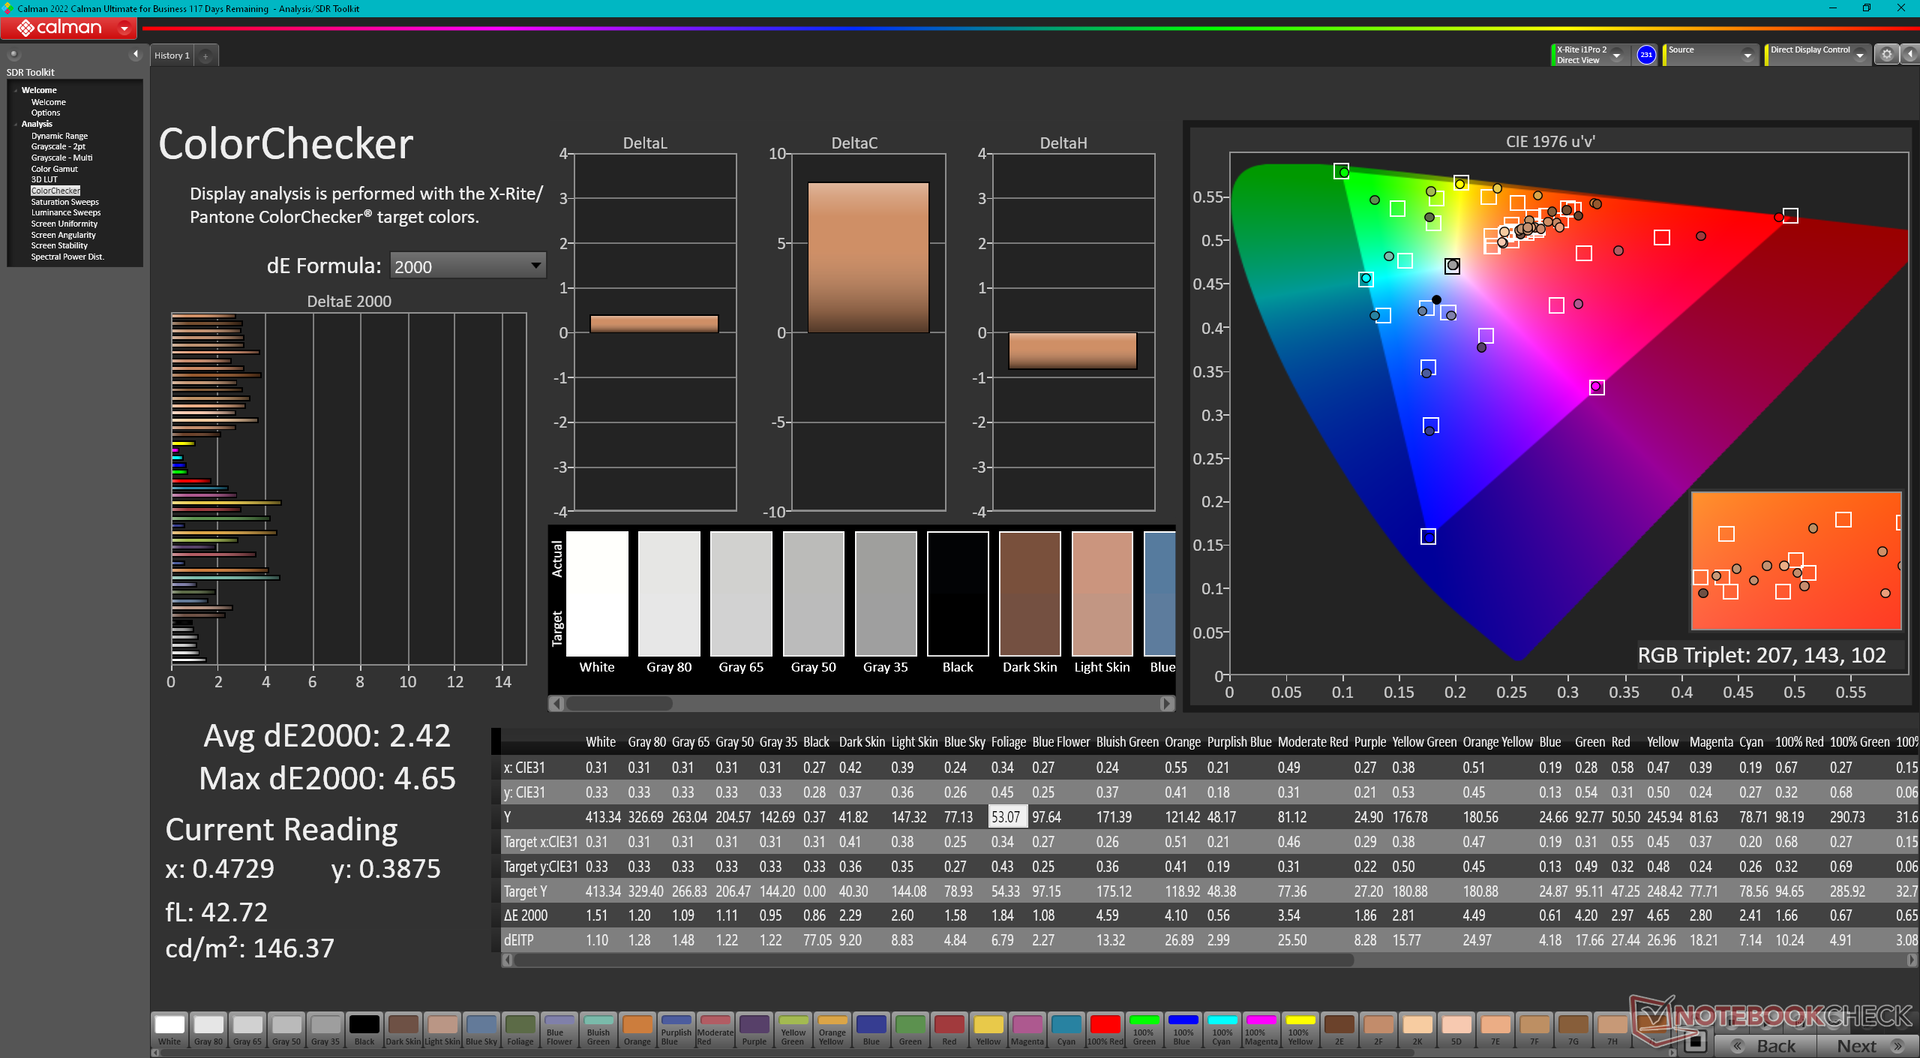
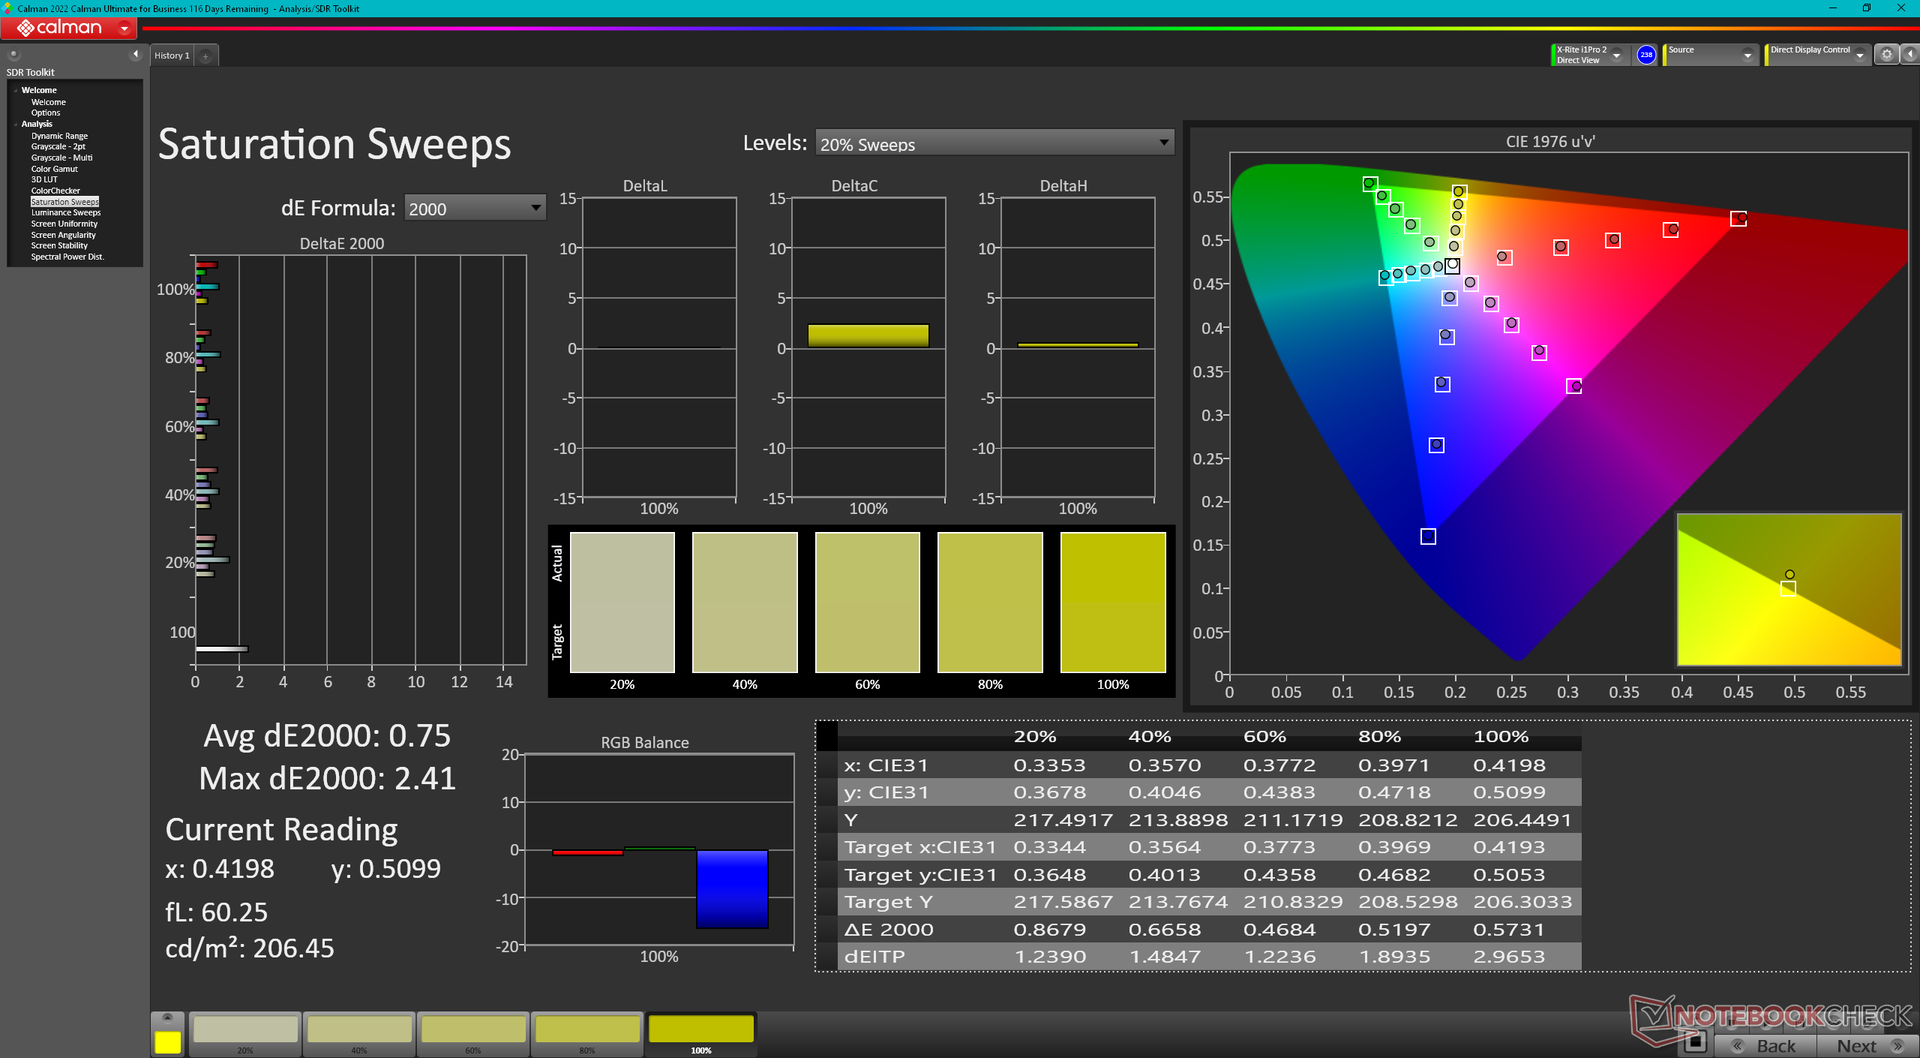
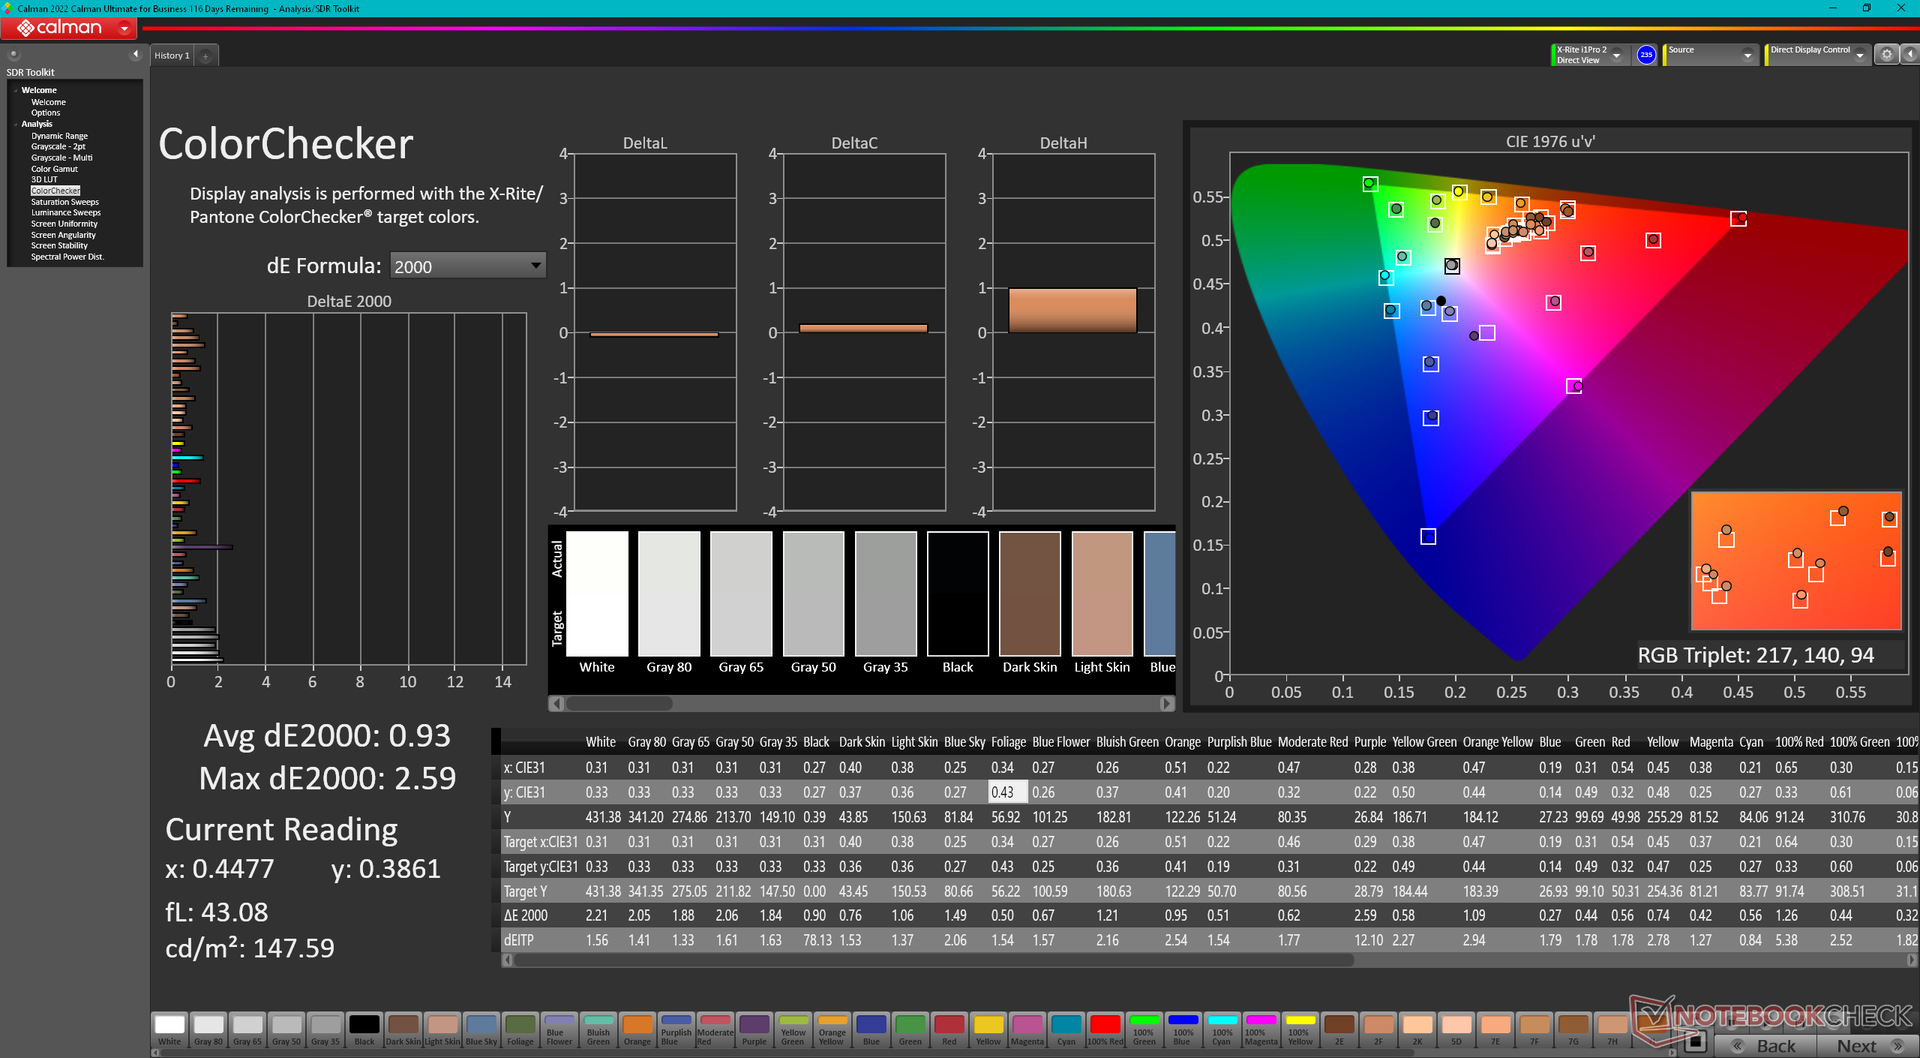
ΔE Color 2.42 | 0.5-29.43 Ø4.87, calibrated: 0.93
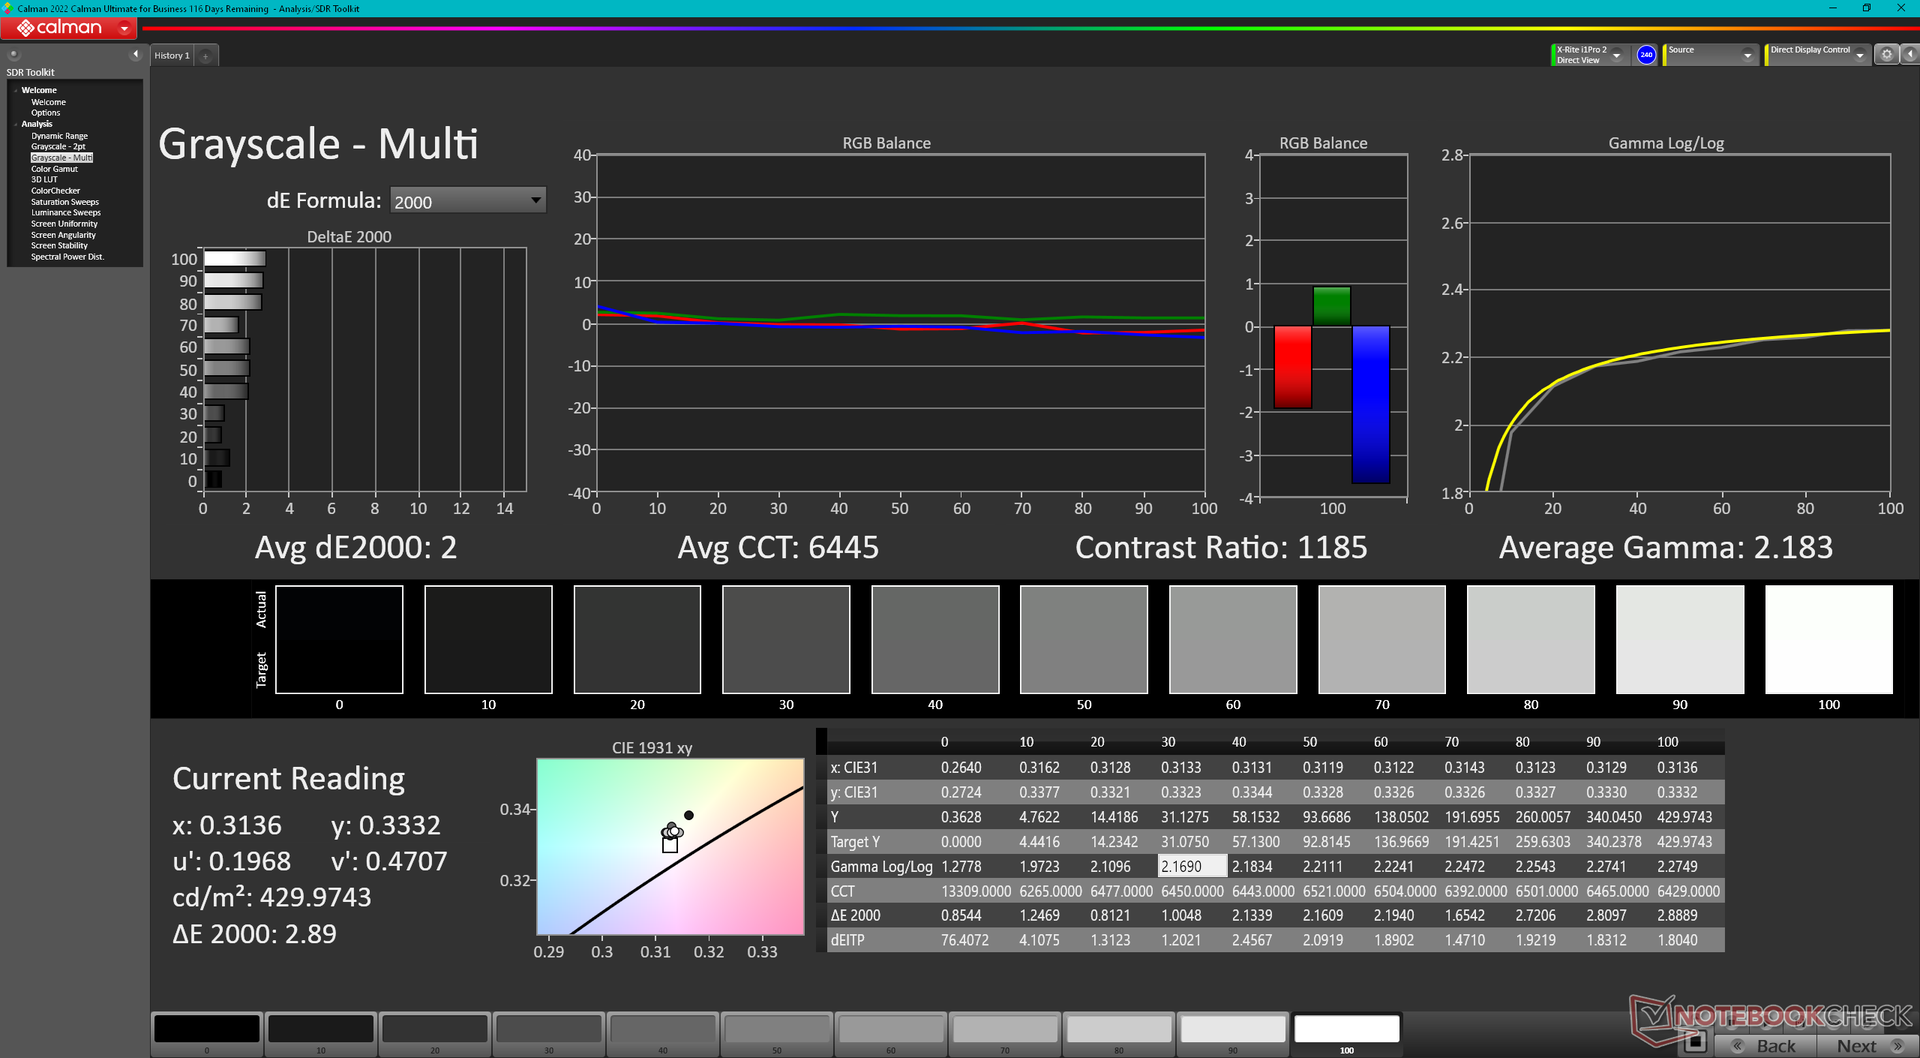
ΔE Greyscale 1.1 | 0.5-98 Ø5.1
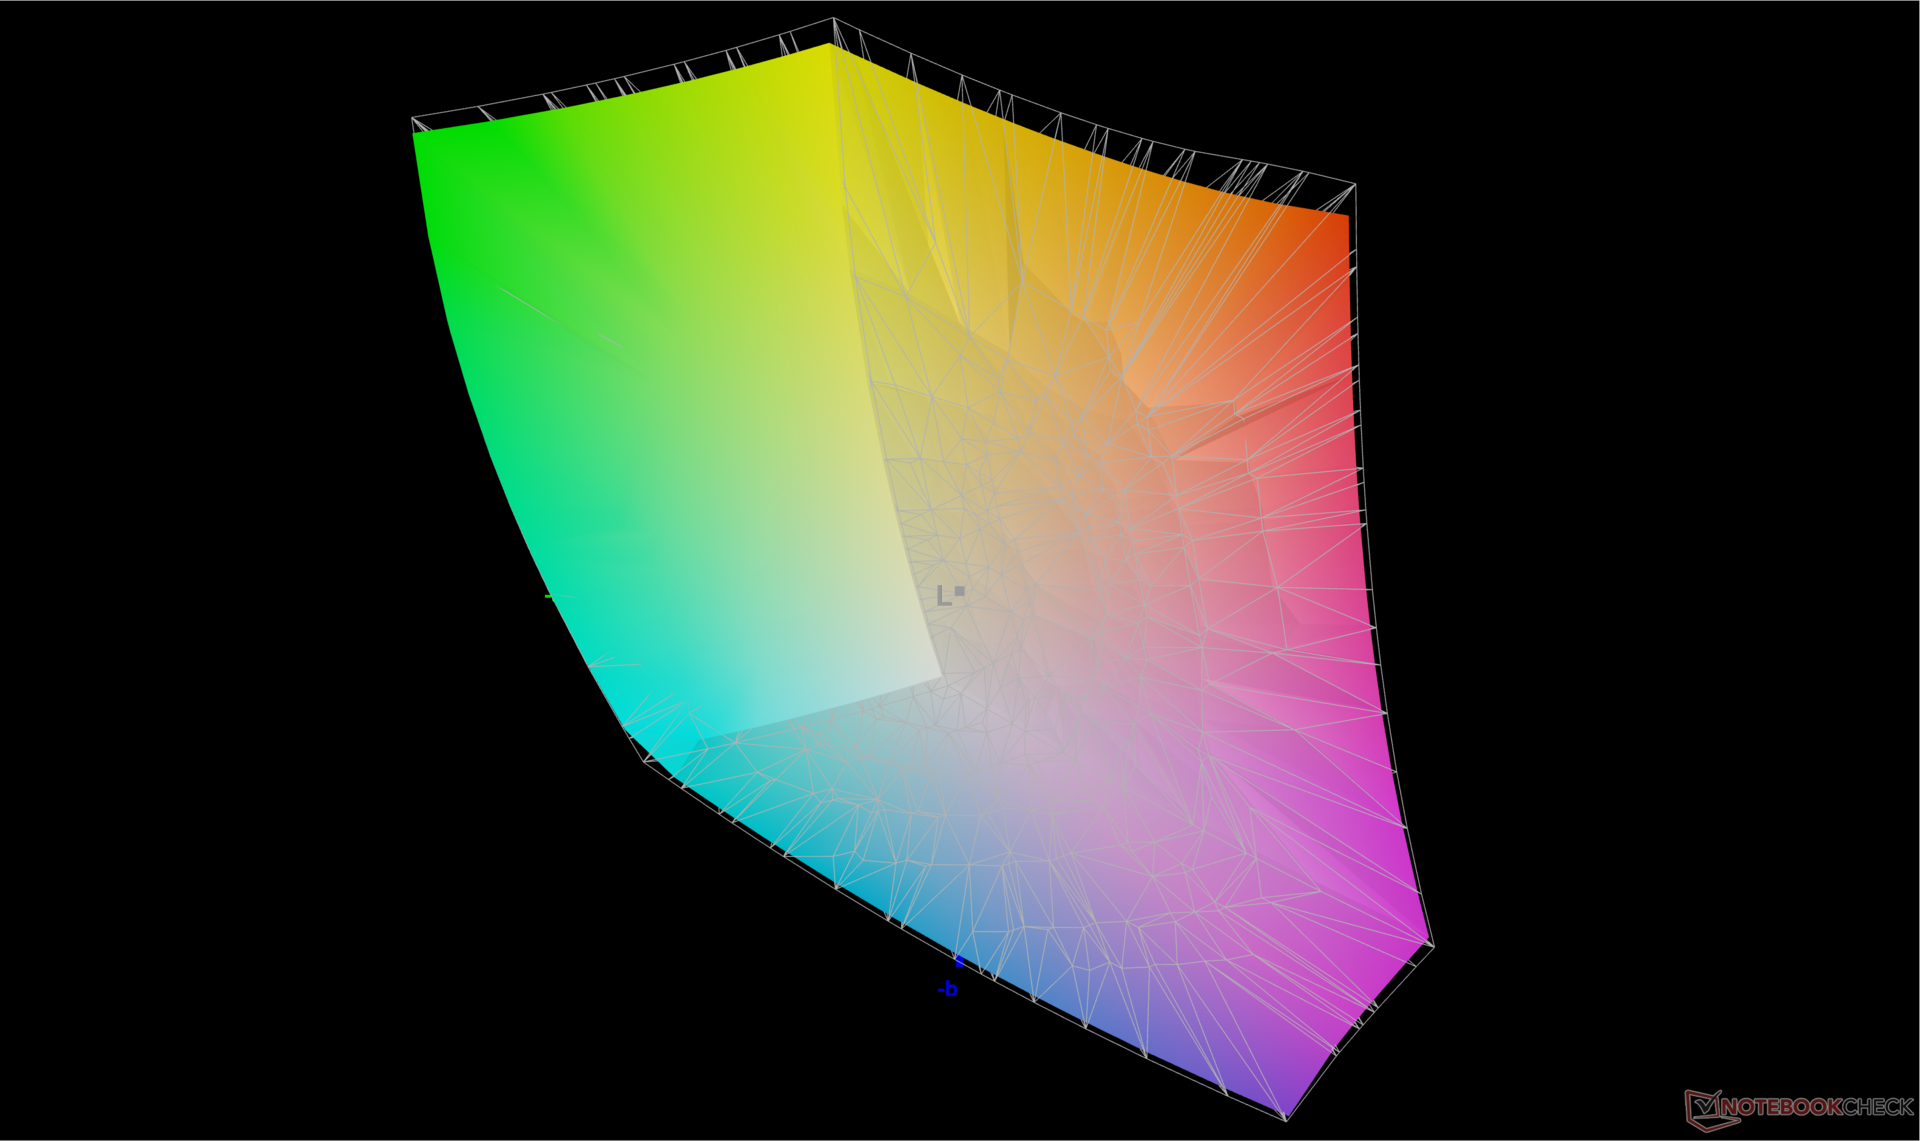
86.5% AdobeRGB 1998 (Argyll 2.2.0 3D)
99.9% sRGB (Argyll 2.2.0 3D)
95.6% Display P3 (Argyll 2.2.0 3D)
Gamma: 2.22
| Lenovo Yoga Pro 9 16IMH9 RTX 4050 LEN160-3.2K, IPS, 3200x2000, 16" | Lenovo Yoga Pro 9 16IMH9 LEN160-3.2K, Mini-LED, 3200x2000, 16" | HP Envy x360 2-in-1 16-ad0097nr Samsung SDC41A6, OLED, 2880x1800, 16" | Dell XPS 16 9640 SDC4196, OLED, 3840x2400, 16.3" | Samsung Galaxy Book4 Ultra ATNA60CL07-0, OLED, 2880x1800, 16" | Asus VivoBook Pro 16 K6602VU Samsung ATNA60BX01-1, OLED, 3200x2000, 16" | |
|---|---|---|---|---|---|---|
| Display | 0% | 5% | 2% | 2% | 5% | |
| Display P3 Coverage | 95.6 | 97 1% | 99.6 4% | 98.3 3% | 98.6 3% | 98.7 3% |
| sRGB Coverage | 99.9 | 99.9 0% | 100 0% | 100 0% | 99.9 0% | 99.7 0% |
| AdobeRGB 1998 Coverage | 86.5 | 86.6 0% | 96.5 12% | 87.8 2% | 88.5 2% | 96.5 12% |
| Response Times | -85% | 92% | 92% | 94% | 24% | |
| Response Time Grey 50% / Grey 80% * | 12.4 ? | 22.2 ? -79% | 0.8 ? 94% | 0.82 ? 93% | 0.54 ? 96% | 0.68 ? 95% |
| Response Time Black / White * | 8.9 ? | 17 ? -91% | 0.89 ? 90% | 0.85 ? 90% | 0.69 ? 92% | 13.2 ? -48% |
| PWM Frequency | 4840 ? | 491.8 ? | 360 ? | 240 ? | 240 ? | |
| Screen | 30% | -16% | -7% | -0% | -61% | |
| Brightness middle | 404.9 | 651 61% | 399.4 -1% | 366 -10% | 390 -4% | 353 -13% |
| Brightness | 390 | 673 73% | 405 4% | 367 -6% | 393 1% | 354 -9% |
| Brightness Distribution | 91 | 93 2% | 98 8% | 96 5% | 98 8% | 98 8% |
| Black Level * | 0.4 | 0.22 45% | ||||
| Contrast | 1012 | 2959 192% | ||||
| Colorchecker dE 2000 * | 2.42 | 1.9 21% | 4.05 -67% | 1.3 46% | 1.4 42% | 4.23 -75% |
| Colorchecker dE 2000 max. * | 4.65 | 4.2 10% | 6.69 -44% | 3.6 23% | 2.7 42% | 7.13 -53% |
| Colorchecker dE 2000 calibrated * | 0.93 | 0.6 35% | 1.02 -10% | 1 -8% | 2.42 -160% | |
| Greyscale dE 2000 * | 1.1 | 3 -173% | 1.1 -0% | 2.2 -100% | 2.1 -91% | 2.5 -127% |
| Gamma | 2.22 99% | 2.18 101% | 2.27 97% | 2.14 103% | 2.27 97% | 2.4 92% |
| CCT | 6468 100% | 6738 96% | 6419 101% | 6680 97% | 6431 101% | 6642 98% |
| Media total (Programa/Opciones) | -18% /
7% | 27% /
8% | 29% /
12% | 32% /
17% | -11% /
-31% |
* ... más pequeño es mejor

La pantalla viene calibrada de fábrica según la norma P3 con unos valores medios deltaE en escala de grises y color de sólo 1,1 y 2,42, respectivamente. Por tanto, no es necesaria una calibración por parte del usuario final para la mayoría de los usuarios.
Tiempos de respuesta del display
| ↔ Tiempo de respuesta de Negro a Blanco | ||
|---|---|---|
| 8.9 ms ... subida ↗ y bajada ↘ combinada | ↗ 4.8 ms subida | 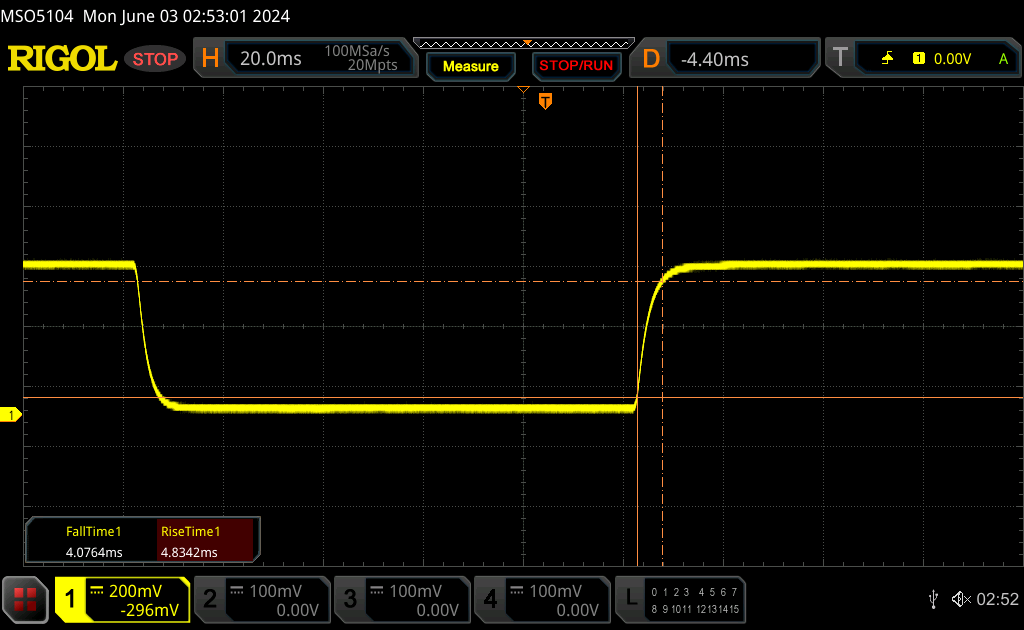 |
| ↘ 4.1 ms bajada | ||
| La pantalla mostró tiempos de respuesta rápidos en nuestros tests y debería ser adecuada para juegos. En comparación, todos los dispositivos de prueba van de ##min### (mínimo) a 240 (máximo) ms. » 22 % de todos los dispositivos son mejores. Esto quiere decir que el tiempo de respuesta medido es mejor que la media (20.8 ms) de todos los dispositivos testados. | ||
| ↔ Tiempo de respuesta 50% Gris a 80% Gris | ||
| 12.4 ms ... subida ↗ y bajada ↘ combinada | ↗ 6.3 ms subida | 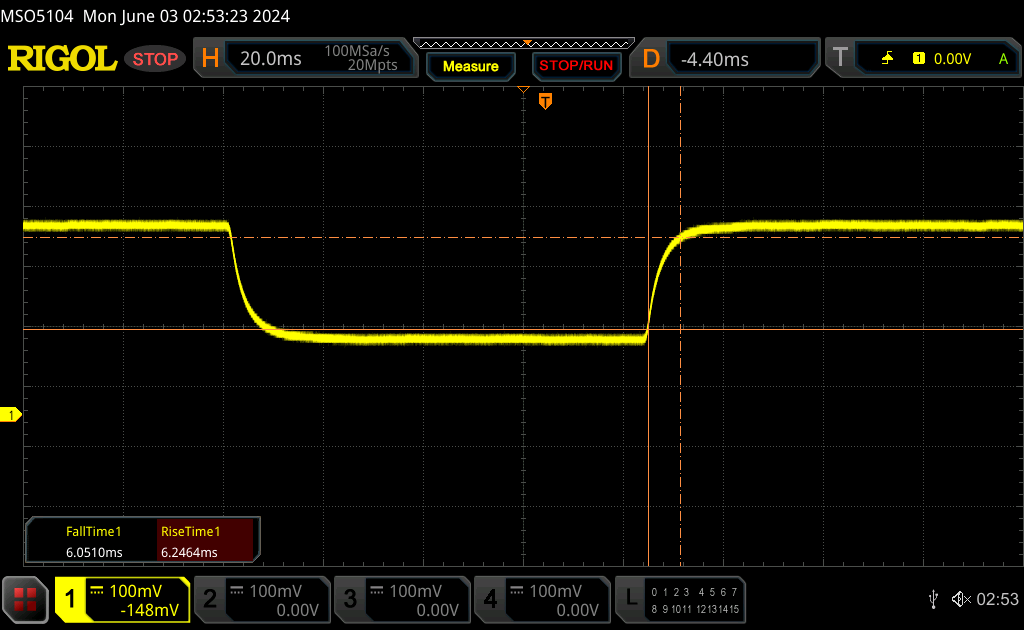 |
| ↘ 6.1 ms bajada | ||
| La pantalla mostró buenos tiempos de respuesta en nuestros tests pero podría ser demasiado lenta para los jugones competitivos. En comparación, todos los dispositivos de prueba van de ##min### (mínimo) a 636 (máximo) ms. » 23 % de todos los dispositivos son mejores. Esto quiere decir que el tiempo de respuesta medido es mejor que la media (32.5 ms) de todos los dispositivos testados. | ||
Parpadeo de Pantalla / PWM (Pulse-Width Modulation)
| Parpadeo de Pantalla / PWM no detectado | 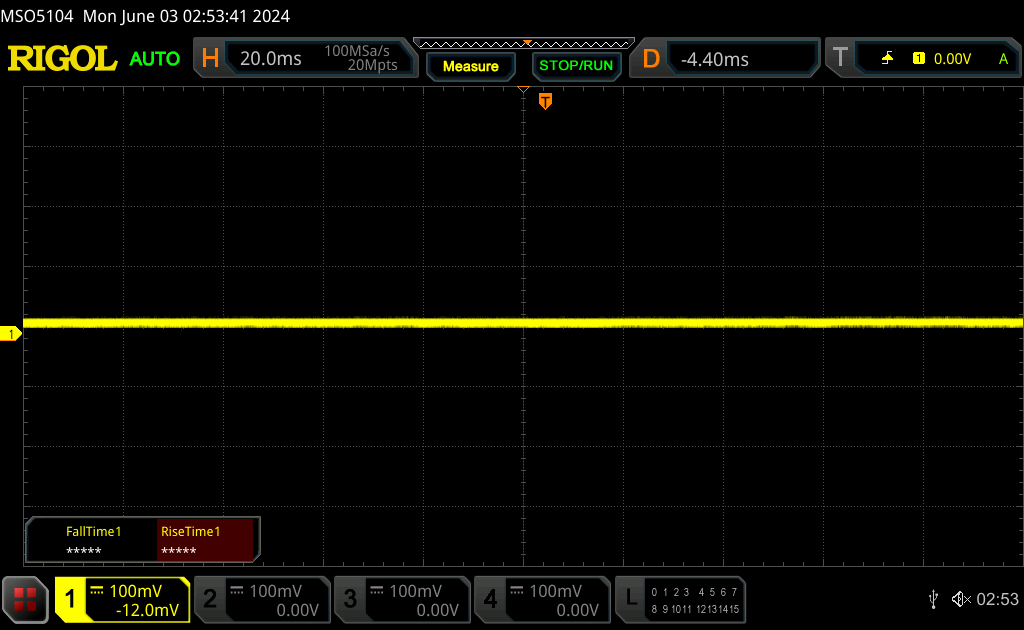 | ||
Comparación: 53 % de todos los dispositivos testados no usaron PWM para atenuar el display. Si se usó, medimos una media de 8516 (mínimo: 5 - máxmo: 343500) Hz. | |||


Rendimiento - Máquina de juego multimedia todoterreno
Condiciones de prueba
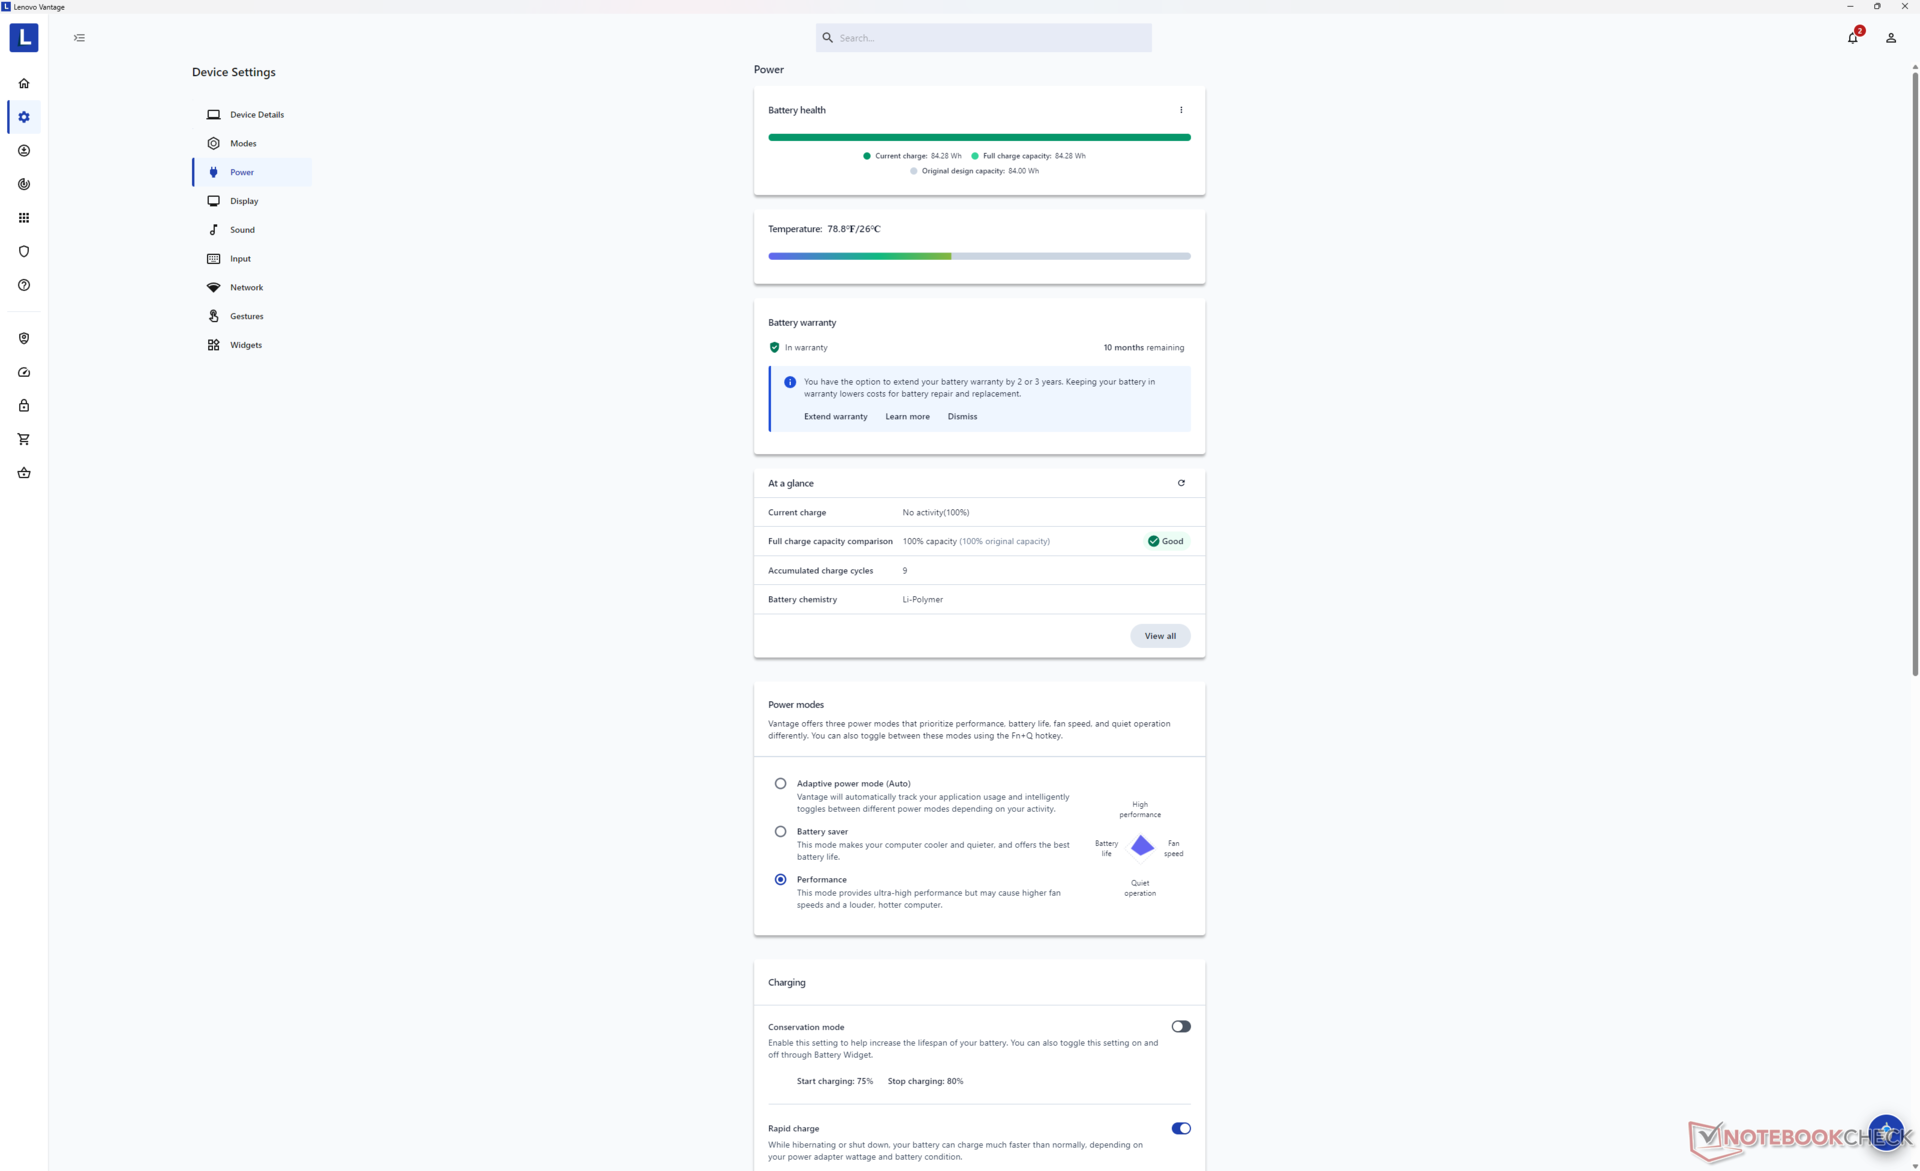
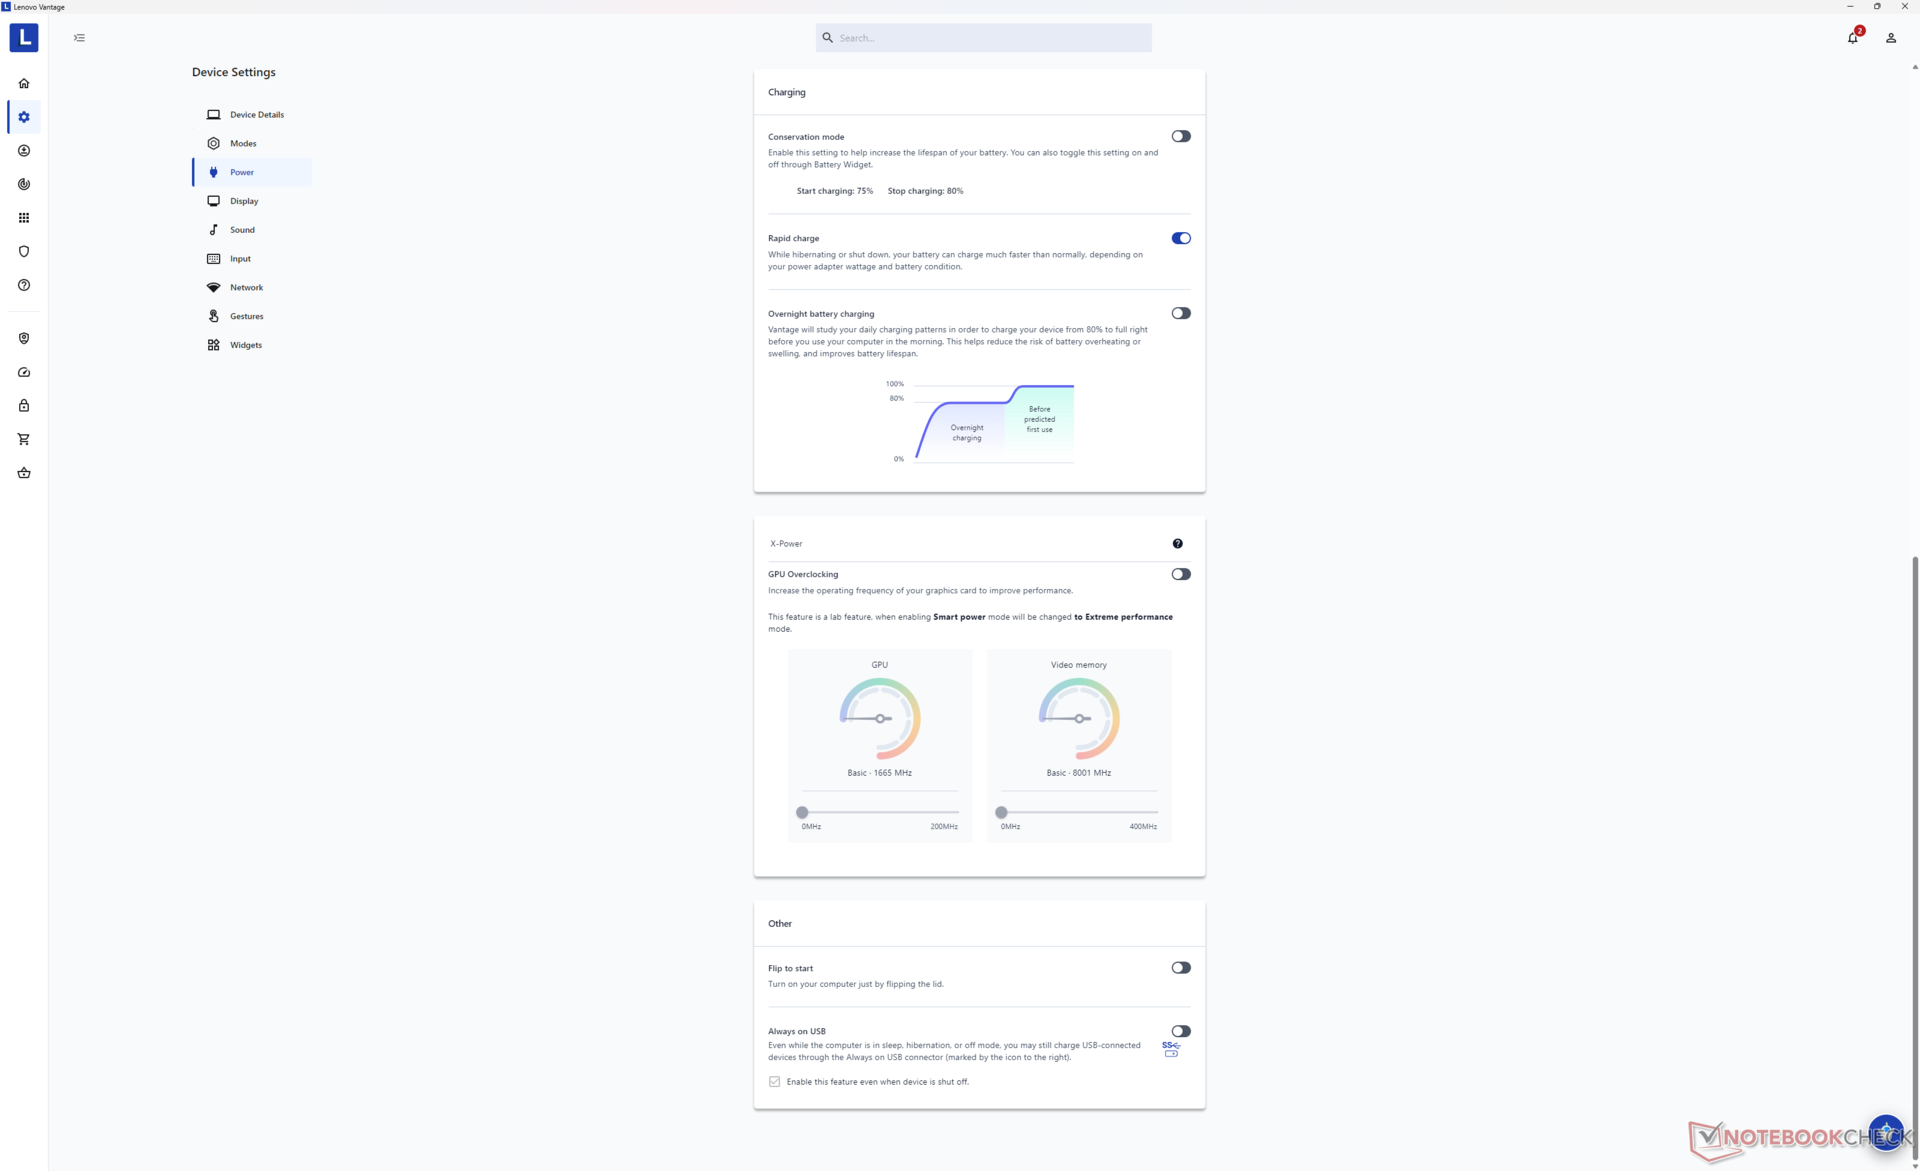
Configuramos Lenovo Vantage en modo Rendimiento y Nvidia en modo dGPU antes de ejecutar los puntos de referencia que se indican a continuación.
Tenga en cuenta que, aunque la GPU puede configurarse sólo en modo discreto, no existe un modo "sólo iGPU" en el Panel de control de Nvidia.
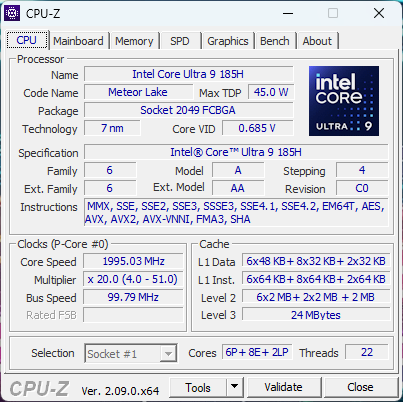
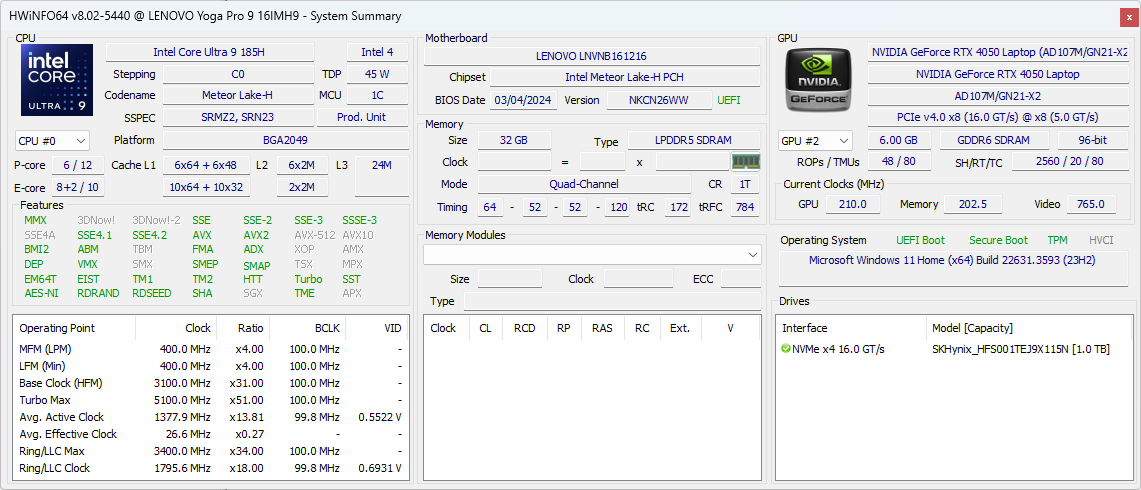
Procesador
El Core Ultra 9 185H en nuestra configuración RTX 4050 rinde a menos de 3 puntos porcentuales de la misma CPU en la configuración RTX 4070 de gama alta. Ofrece un rendimiento más rápido que el Core i7-13900H a la vez que integra una NPU para tareas aceleradas por IA. Bajando de categoría al Core Ultra 7 155H se espera que sólo afecte al rendimiento entre un 5 y un 10 por ciento, basándonos en nuestro tiempo con el Dell XPS 16 9640.
Cinebench R15 Multi Loop
Cinebench R23: Multi Core | Single Core
Cinebench R20: CPU (Multi Core) | CPU (Single Core)
Cinebench R15: CPU Multi 64Bit | CPU Single 64Bit
Blender: v2.79 BMW27 CPU
7-Zip 18.03: 7z b 4 | 7z b 4 -mmt1
Geekbench 6.4: Multi-Core | Single-Core
Geekbench 5.5: Multi-Core | Single-Core
HWBOT x265 Benchmark v2.2: 4k Preset
LibreOffice : 20 Documents To PDF
R Benchmark 2.5: Overall mean
* ... más pequeño es mejor
AIDA64: FP32 Ray-Trace | FPU Julia | CPU SHA3 | CPU Queen | FPU SinJulia | FPU Mandel | CPU AES | CPU ZLib | FP64 Ray-Trace | CPU PhotoWorxx
| Performance Rating | |
| Lenovo Yoga Pro 9 16IMH9 | |
| Lenovo Yoga Pro 9 16IMH9 RTX 4050 | |
| Dell XPS 16 9640 | |
| HP Envy x360 2-in-1 16-ad0097nr | |
| Medio Intel Core Ultra 9 185H | |
| Asus VivoBook Pro 16 K6602VU | |
| Samsung Galaxy Book4 Ultra | |
| AIDA64 / FP32 Ray-Trace | |
| HP Envy x360 2-in-1 16-ad0097nr | |
| Lenovo Yoga Pro 9 16IMH9 RTX 4050 | |
| Lenovo Yoga Pro 9 16IMH9 | |
| Dell XPS 16 9640 | |
| Medio Intel Core Ultra 9 185H (9220 - 18676, n=19) | |
| Asus VivoBook Pro 16 K6602VU | |
| Samsung Galaxy Book4 Ultra | |
| AIDA64 / FPU Julia | |
| Lenovo Yoga Pro 9 16IMH9 | |
| Lenovo Yoga Pro 9 16IMH9 RTX 4050 | |
| Dell XPS 16 9640 | |
| Medio Intel Core Ultra 9 185H (48865 - 96463, n=19) | |
| HP Envy x360 2-in-1 16-ad0097nr | |
| Asus VivoBook Pro 16 K6602VU | |
| Samsung Galaxy Book4 Ultra | |
| AIDA64 / CPU SHA3 | |
| Lenovo Yoga Pro 9 16IMH9 RTX 4050 | |
| Lenovo Yoga Pro 9 16IMH9 | |
| Dell XPS 16 9640 | |
| Medio Intel Core Ultra 9 185H (2394 - 4534, n=19) | |
| HP Envy x360 2-in-1 16-ad0097nr | |
| Asus VivoBook Pro 16 K6602VU | |
| Samsung Galaxy Book4 Ultra | |
| AIDA64 / CPU Queen | |
| HP Envy x360 2-in-1 16-ad0097nr | |
| Lenovo Yoga Pro 9 16IMH9 RTX 4050 | |
| Asus VivoBook Pro 16 K6602VU | |
| Lenovo Yoga Pro 9 16IMH9 | |
| Dell XPS 16 9640 | |
| Medio Intel Core Ultra 9 185H (66785 - 95241, n=19) | |
| Samsung Galaxy Book4 Ultra | |
| AIDA64 / FPU SinJulia | |
| HP Envy x360 2-in-1 16-ad0097nr | |
| Lenovo Yoga Pro 9 16IMH9 | |
| Lenovo Yoga Pro 9 16IMH9 RTX 4050 | |
| Dell XPS 16 9640 | |
| Medio Intel Core Ultra 9 185H (7255 - 11392, n=19) | |
| Samsung Galaxy Book4 Ultra | |
| Asus VivoBook Pro 16 K6602VU | |
| AIDA64 / FPU Mandel | |
| Lenovo Yoga Pro 9 16IMH9 | |
| Lenovo Yoga Pro 9 16IMH9 RTX 4050 | |
| HP Envy x360 2-in-1 16-ad0097nr | |
| Dell XPS 16 9640 | |
| Medio Intel Core Ultra 9 185H (24004 - 48020, n=19) | |
| Samsung Galaxy Book4 Ultra | |
| Asus VivoBook Pro 16 K6602VU | |
| AIDA64 / CPU AES | |
| Asus VivoBook Pro 16 K6602VU | |
| Lenovo Yoga Pro 9 16IMH9 | |
| Lenovo Yoga Pro 9 16IMH9 RTX 4050 | |
| Medio Intel Core Ultra 9 185H (53116 - 154066, n=19) | |
| Dell XPS 16 9640 | |
| HP Envy x360 2-in-1 16-ad0097nr | |
| Samsung Galaxy Book4 Ultra | |
| AIDA64 / CPU ZLib | |
| Lenovo Yoga Pro 9 16IMH9 | |
| Lenovo Yoga Pro 9 16IMH9 RTX 4050 | |
| Dell XPS 16 9640 | |
| Medio Intel Core Ultra 9 185H (678 - 1341, n=19) | |
| Samsung Galaxy Book4 Ultra | |
| Asus VivoBook Pro 16 K6602VU | |
| HP Envy x360 2-in-1 16-ad0097nr | |
| AIDA64 / FP64 Ray-Trace | |
| HP Envy x360 2-in-1 16-ad0097nr | |
| Lenovo Yoga Pro 9 16IMH9 | |
| Lenovo Yoga Pro 9 16IMH9 RTX 4050 | |
| Dell XPS 16 9640 | |
| Medio Intel Core Ultra 9 185H (4428 - 10078, n=19) | |
| Asus VivoBook Pro 16 K6602VU | |
| Samsung Galaxy Book4 Ultra | |
| AIDA64 / CPU PhotoWorxx | |
| Lenovo Yoga Pro 9 16IMH9 | |
| Lenovo Yoga Pro 9 16IMH9 RTX 4050 | |
| Dell XPS 16 9640 | |
| Samsung Galaxy Book4 Ultra | |
| Medio Intel Core Ultra 9 185H (44547 - 53918, n=19) | |
| Asus VivoBook Pro 16 K6602VU | |
| HP Envy x360 2-in-1 16-ad0097nr | |
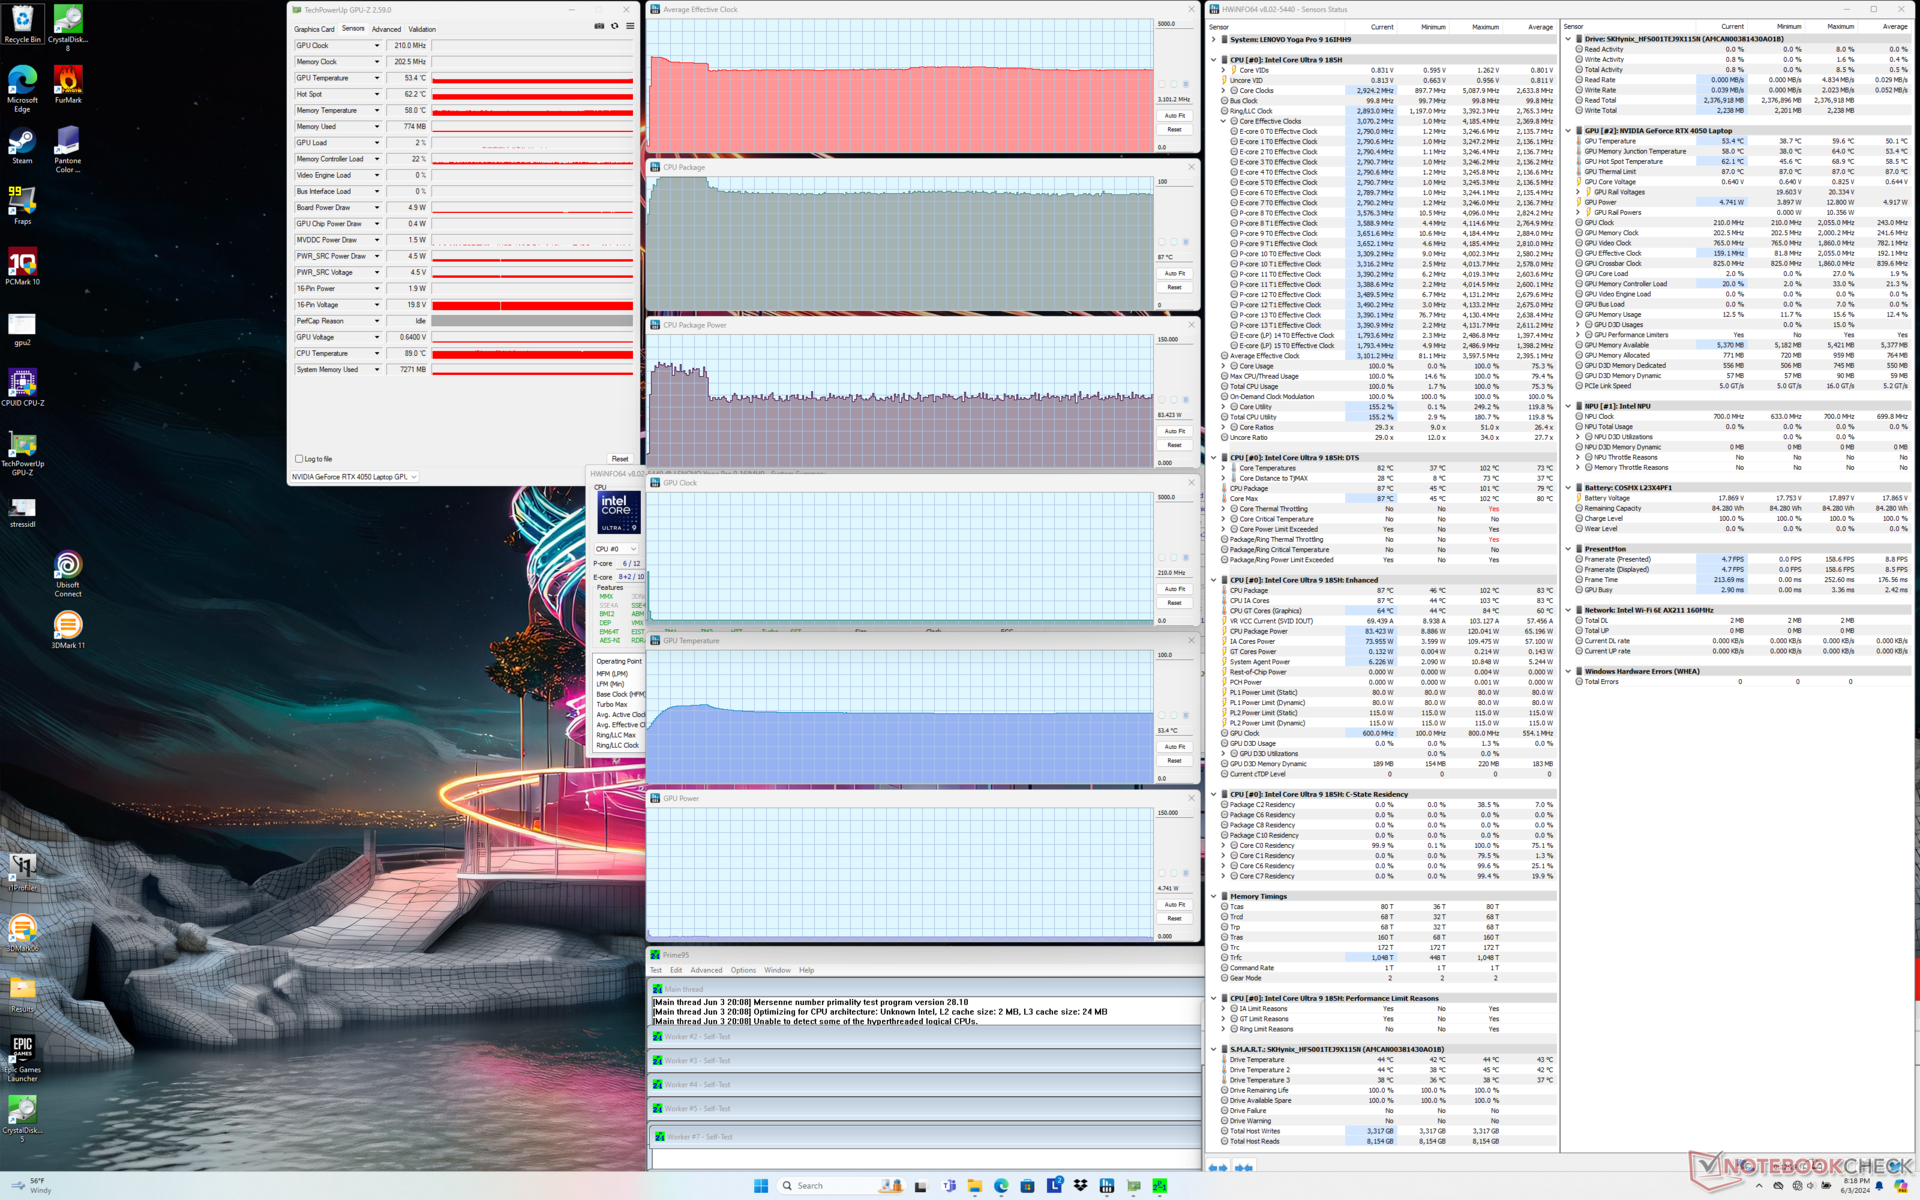
Prueba de estrés
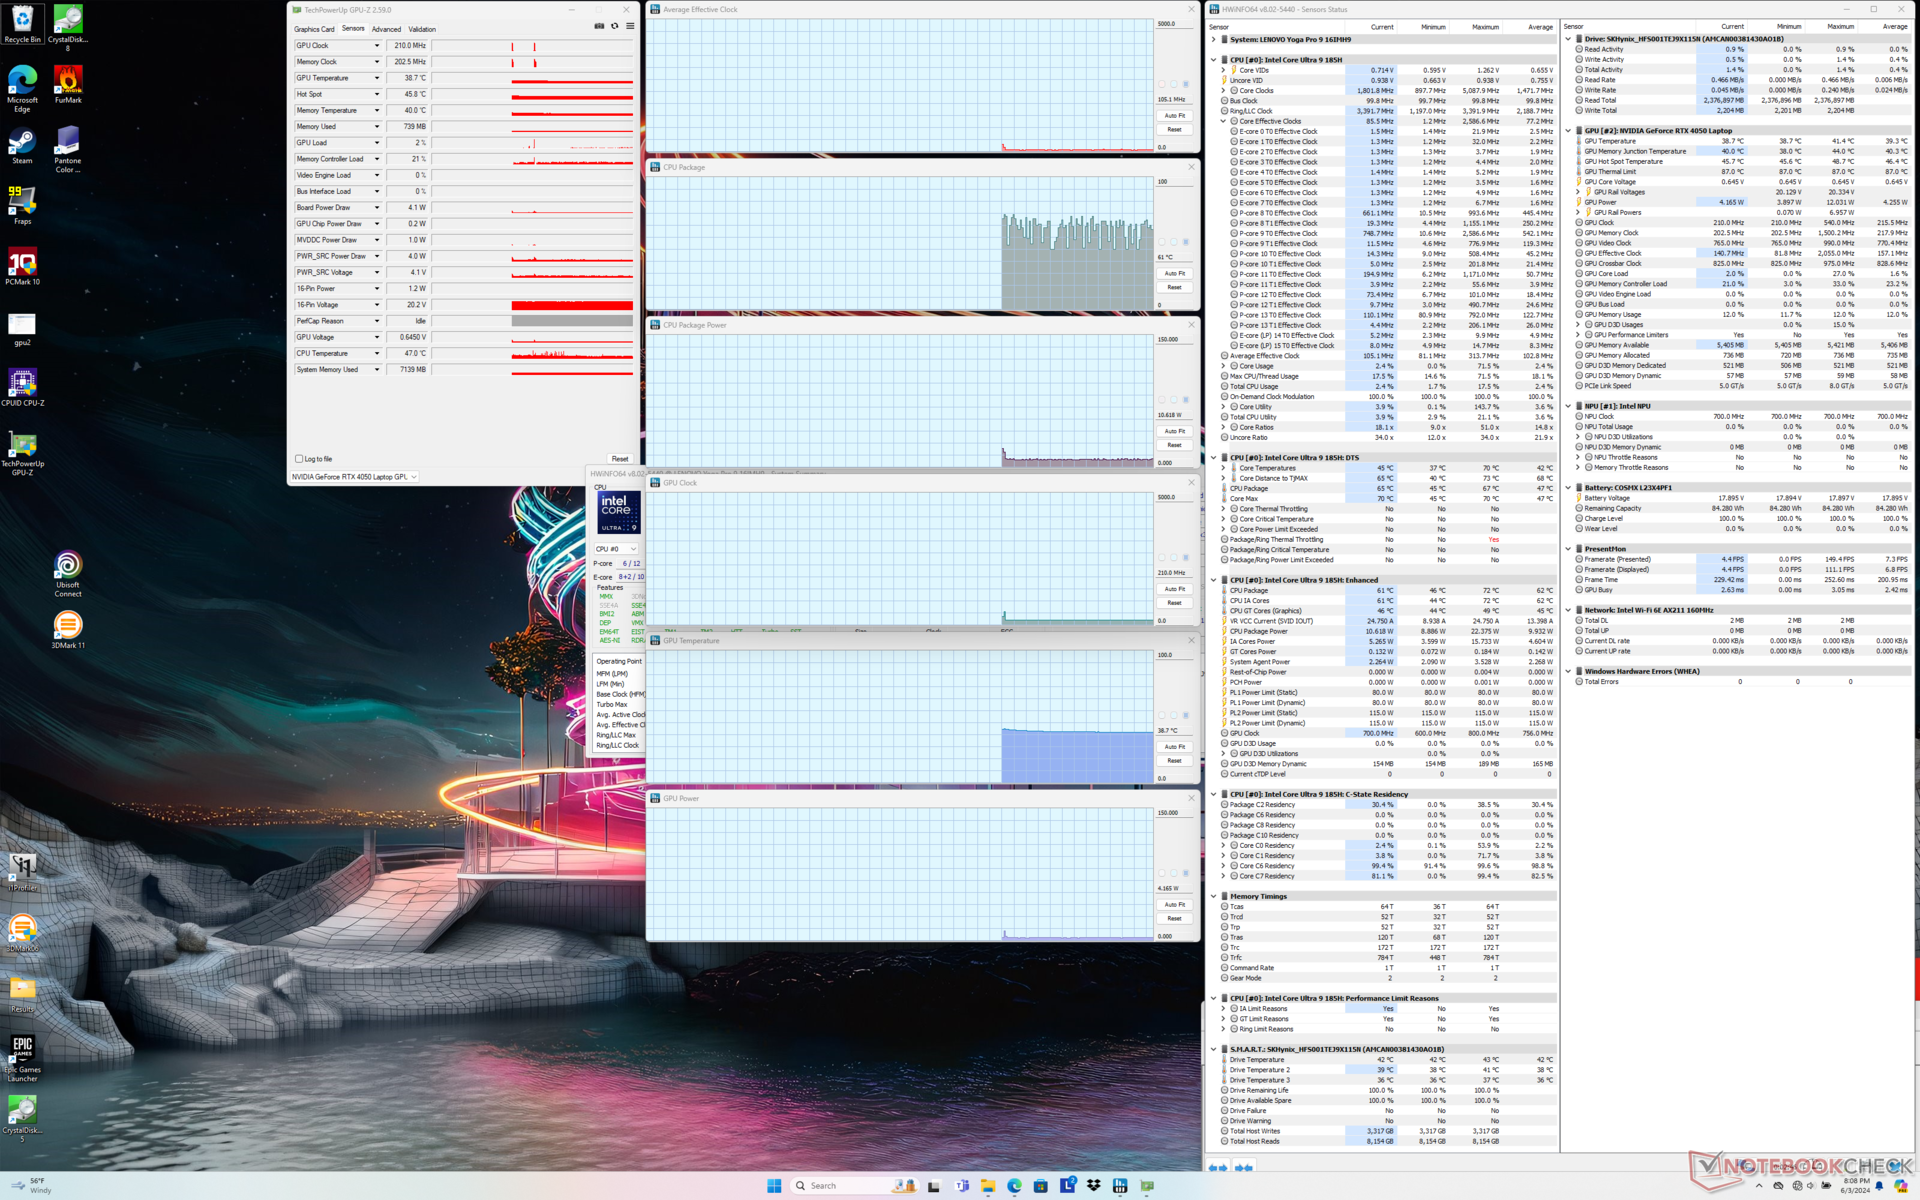
La CPU aumentaba a 3,6 GHz, 100 C y 120 W tras iniciar el estrés Prime95 antes de caer y estabilizarse en 3,1 GHz, 90 C y 83 W unos 70 segundos después.
El rendimiento gráfico se ve afectado si se ejecuta en modo Equilibrado en lugar de en modo Rendimiento, lo que complementa nuestros resultados de Rendimiento de la GPU a continuación. La GPU Nvidia mantendría 2855 MHz y 78 W cuando se ejecuta Witcher 3 en modo Rendimiento frente a los 2385 MHz y 63 W si se ejecuta en modo Equilibrado. La temperatura de la GPU también sería más cálida en el modo Rendimiento.
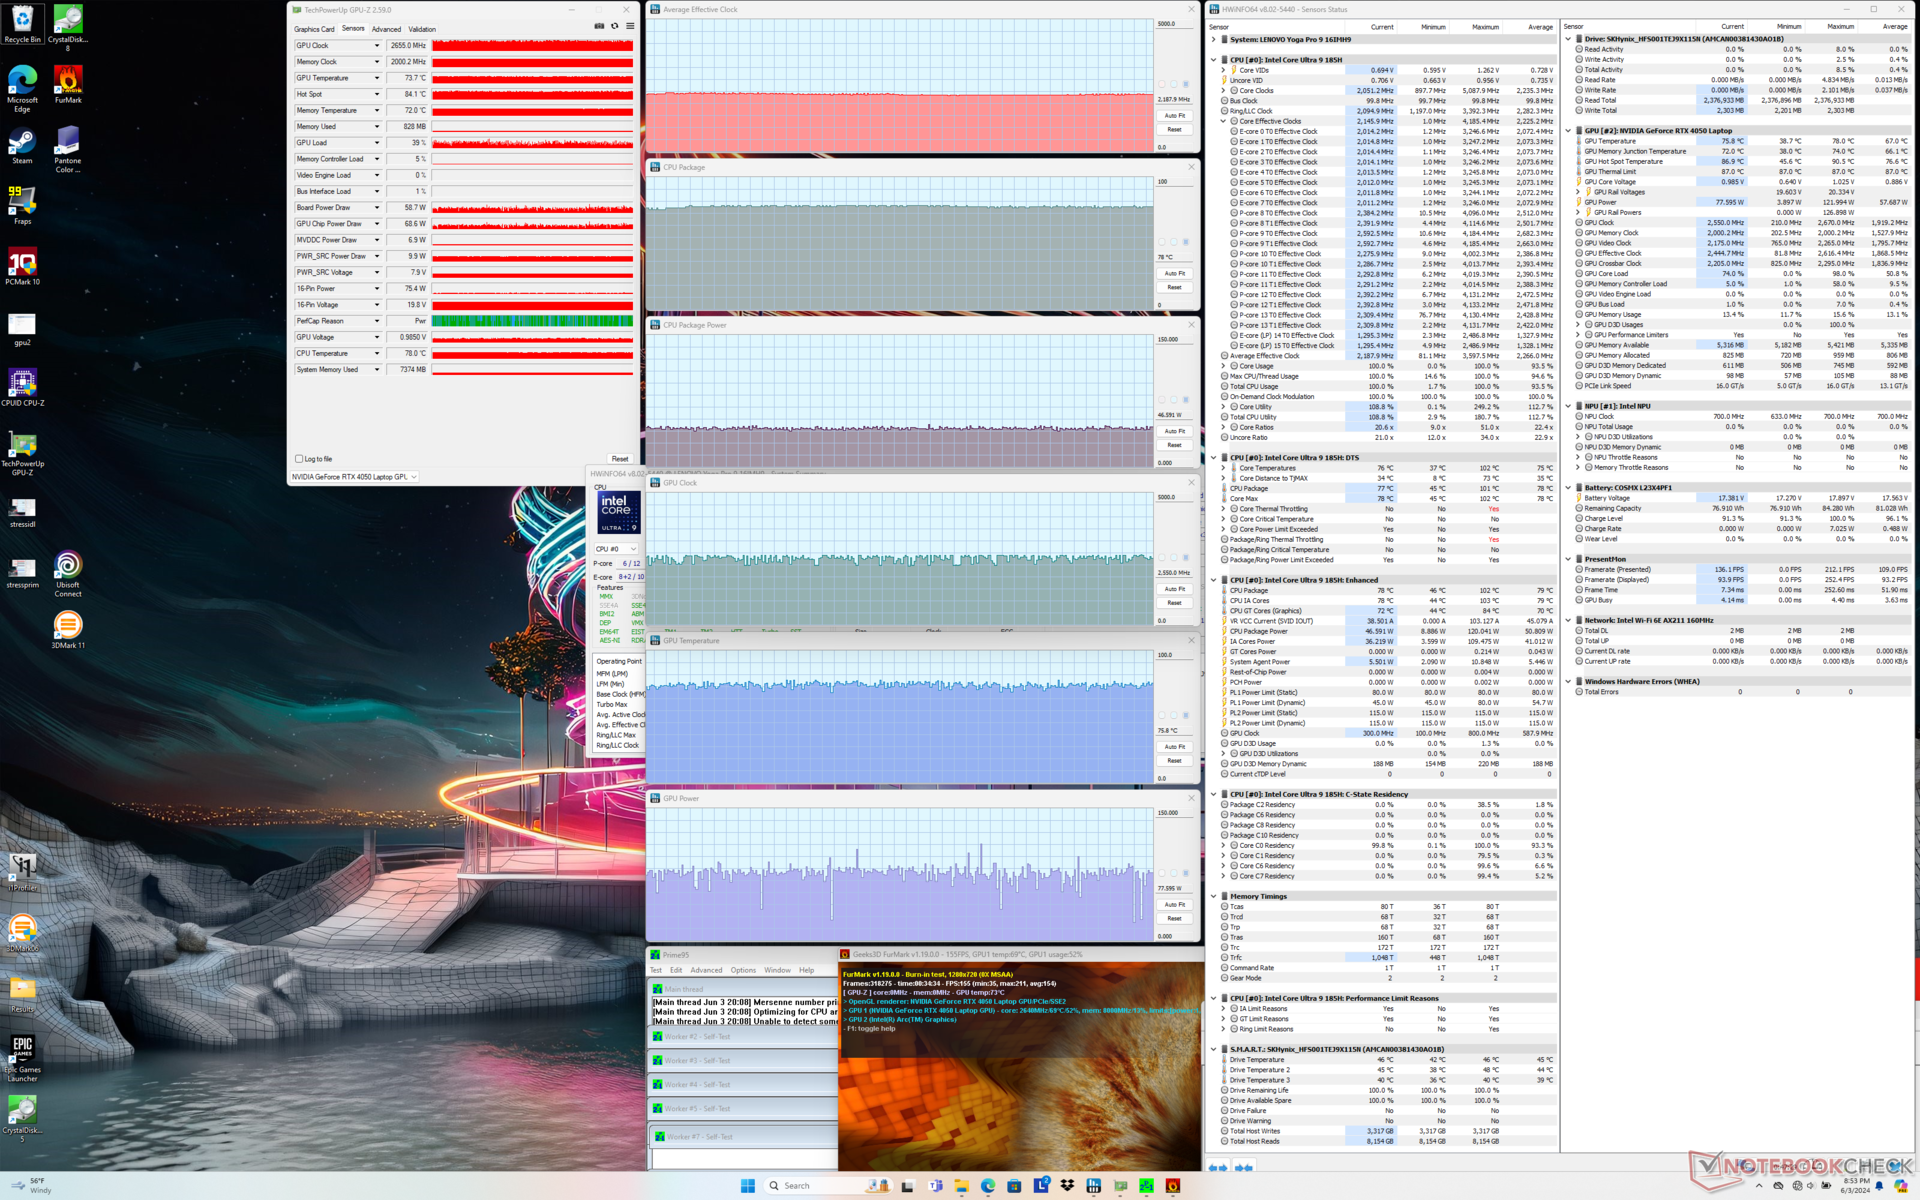
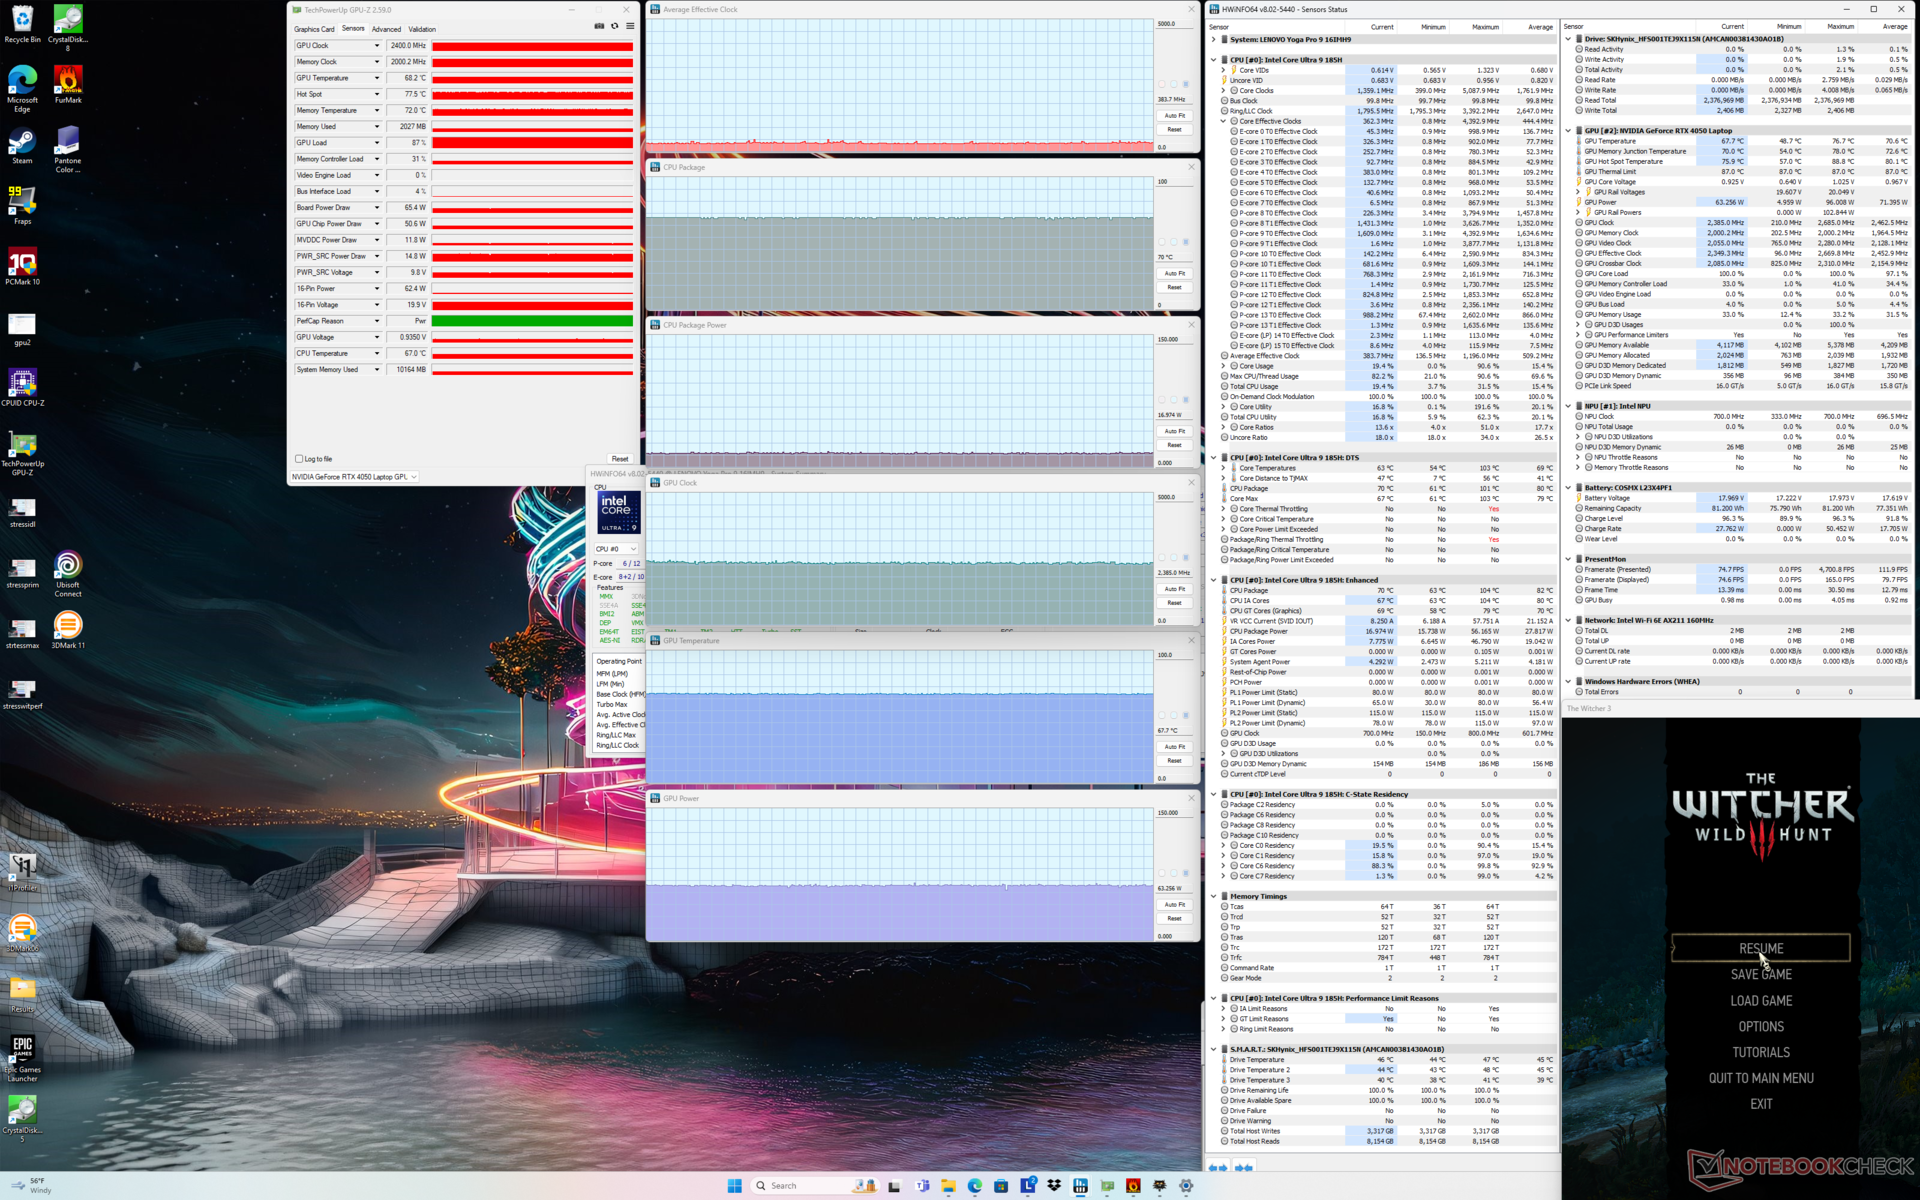

| Reloj medio de la CPU (GHz) | Reloj medio de la GPU (MHz) | Temperatura media dela CPU (°C) | Temperatura media de la GPU (°C) | |
| Sistema en reposo | -- | -- | 61 | 39 |
| Prime95 Stress | 3.1 | -- | 87 | 53 |
| Estrés Prime95+ FurMark | 2,2 | 2550 | 78 | 76 |
| Witcher 3 Estrés (modoequilibrado) | 0,4 | 2385 | 70 | 68 |
| Witcher 3 Estrés (modoRendimiento) | 0,7 | 2655 | 99 | 76 |
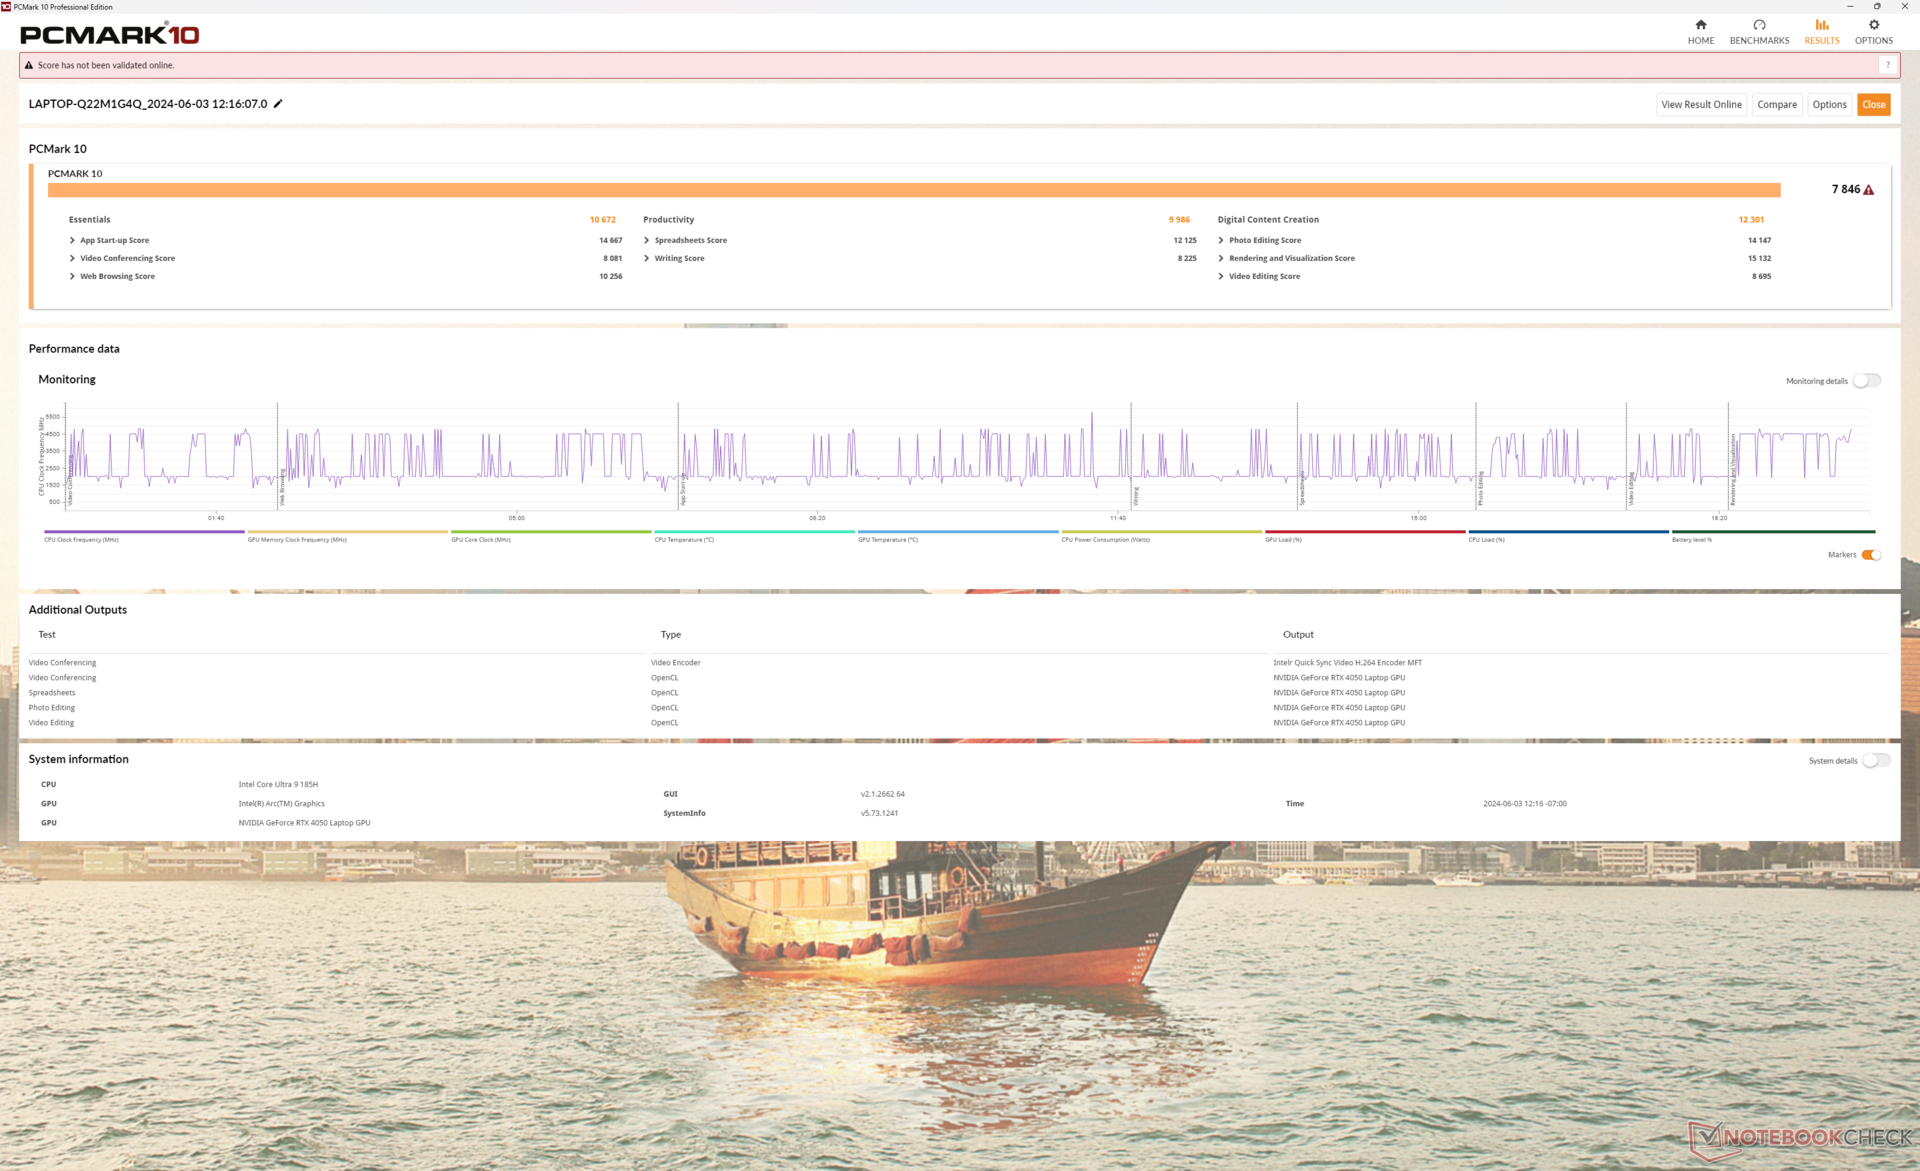
Rendimiento del sistema
Las puntuaciones de PCMark son comparables a las de la mayoría de portátiles multimedia, lo que sugiere que el Lenovo no es significativamente más lento en la mayoría de las cargas de trabajo cotidianas o tareas de edición a pesar de nuestra configuración RTX 4050 de gama baja.
CrossMark: Overall | Productivity | Creativity | Responsiveness
WebXPRT 3: Overall
WebXPRT 4: Overall
Mozilla Kraken 1.1: Total
| PCMark 10 / Score | |
| Lenovo Yoga Pro 9 16IMH9 RTX 4050 | |
| Medio Intel Core Ultra 9 185H, NVIDIA GeForce RTX 4050 Laptop GPU (7431 - 7846, n=2) | |
| Lenovo Yoga Pro 9 16IMH9 | |
| Dell XPS 16 9640 | |
| Asus VivoBook Pro 16 K6602VU | |
| Samsung Galaxy Book4 Ultra | |
| HP Envy x360 2-in-1 16-ad0097nr | |
| PCMark 10 / Essentials | |
| Lenovo Yoga Pro 9 16IMH9 | |
| Medio Intel Core Ultra 9 185H, NVIDIA GeForce RTX 4050 Laptop GPU (10672 - 10807, n=2) | |
| Lenovo Yoga Pro 9 16IMH9 RTX 4050 | |
| HP Envy x360 2-in-1 16-ad0097nr | |
| Samsung Galaxy Book4 Ultra | |
| Dell XPS 16 9640 | |
| Asus VivoBook Pro 16 K6602VU | |
| PCMark 10 / Productivity | |
| Lenovo Yoga Pro 9 16IMH9 RTX 4050 | |
| HP Envy x360 2-in-1 16-ad0097nr | |
| Medio Intel Core Ultra 9 185H, NVIDIA GeForce RTX 4050 Laptop GPU (9717 - 9986, n=2) | |
| Dell XPS 16 9640 | |
| Samsung Galaxy Book4 Ultra | |
| Lenovo Yoga Pro 9 16IMH9 | |
| Asus VivoBook Pro 16 K6602VU | |
| PCMark 10 / Digital Content Creation | |
| Lenovo Yoga Pro 9 16IMH9 RTX 4050 | |
| Lenovo Yoga Pro 9 16IMH9 | |
| Medio Intel Core Ultra 9 185H, NVIDIA GeForce RTX 4050 Laptop GPU (10607 - 12301, n=2) | |
| Asus VivoBook Pro 16 K6602VU | |
| Dell XPS 16 9640 | |
| Samsung Galaxy Book4 Ultra | |
| HP Envy x360 2-in-1 16-ad0097nr | |
| CrossMark / Overall | |
| Dell XPS 16 9640 | |
| Lenovo Yoga Pro 9 16IMH9 RTX 4050 | |
| Medio Intel Core Ultra 9 185H, NVIDIA GeForce RTX 4050 Laptop GPU (1790 - 1811, n=2) | |
| Samsung Galaxy Book4 Ultra | |
| Asus VivoBook Pro 16 K6602VU | |
| Lenovo Yoga Pro 9 16IMH9 | |
| HP Envy x360 2-in-1 16-ad0097nr | |
| CrossMark / Productivity | |
| Dell XPS 16 9640 | |
| Lenovo Yoga Pro 9 16IMH9 RTX 4050 | |
| Medio Intel Core Ultra 9 185H, NVIDIA GeForce RTX 4050 Laptop GPU (1700 - 1717, n=2) | |
| Asus VivoBook Pro 16 K6602VU | |
| Samsung Galaxy Book4 Ultra | |
| Lenovo Yoga Pro 9 16IMH9 | |
| HP Envy x360 2-in-1 16-ad0097nr | |
| CrossMark / Creativity | |
| Medio Intel Core Ultra 9 185H, NVIDIA GeForce RTX 4050 Laptop GPU (2037 - 2038, n=2) | |
| Lenovo Yoga Pro 9 16IMH9 RTX 4050 | |
| Dell XPS 16 9640 | |
| Lenovo Yoga Pro 9 16IMH9 | |
| Samsung Galaxy Book4 Ultra | |
| Asus VivoBook Pro 16 K6602VU | |
| HP Envy x360 2-in-1 16-ad0097nr | |
| CrossMark / Responsiveness | |
| Dell XPS 16 9640 | |
| Asus VivoBook Pro 16 K6602VU | |
| Lenovo Yoga Pro 9 16IMH9 RTX 4050 | |
| Samsung Galaxy Book4 Ultra | |
| Medio Intel Core Ultra 9 185H, NVIDIA GeForce RTX 4050 Laptop GPU (1419 - 1493, n=2) | |
| HP Envy x360 2-in-1 16-ad0097nr | |
| Lenovo Yoga Pro 9 16IMH9 | |
| WebXPRT 3 / Overall | |
| HP Envy x360 2-in-1 16-ad0097nr | |
| Medio Intel Core Ultra 9 185H, NVIDIA GeForce RTX 4050 Laptop GPU (293 - 301, n=2) | |
| Lenovo Yoga Pro 9 16IMH9 | |
| Lenovo Yoga Pro 9 16IMH9 RTX 4050 | |
| Dell XPS 16 9640 | |
| Samsung Galaxy Book4 Ultra | |
| WebXPRT 4 / Overall | |
| Medio Intel Core Ultra 9 185H, NVIDIA GeForce RTX 4050 Laptop GPU (268 - 271, n=2) | |
| Lenovo Yoga Pro 9 16IMH9 | |
| Lenovo Yoga Pro 9 16IMH9 RTX 4050 | |
| Samsung Galaxy Book4 Ultra | |
| Dell XPS 16 9640 | |
| HP Envy x360 2-in-1 16-ad0097nr | |
| Asus VivoBook Pro 16 K6602VU | |
| Mozilla Kraken 1.1 / Total | |
| Asus VivoBook Pro 16 K6602VU | |
| HP Envy x360 2-in-1 16-ad0097nr | |
| Lenovo Yoga Pro 9 16IMH9 RTX 4050 | |
| Medio Intel Core Ultra 9 185H, NVIDIA GeForce RTX 4050 Laptop GPU (498 - 512, n=2) | |
| Lenovo Yoga Pro 9 16IMH9 | |
| Samsung Galaxy Book4 Ultra | |
* ... más pequeño es mejor
| PCMark 10 Score | 7846 puntos | |
ayuda | ||
| AIDA64 / Memory Copy | |
| Lenovo Yoga Pro 9 16IMH9 | |
| Lenovo Yoga Pro 9 16IMH9 RTX 4050 | |
| Dell XPS 16 9640 | |
| Samsung Galaxy Book4 Ultra | |
| Medio Intel Core Ultra 9 185H (69929 - 95718, n=19) | |
| HP Envy x360 2-in-1 16-ad0097nr | |
| Asus VivoBook Pro 16 K6602VU | |
| AIDA64 / Memory Read | |
| Samsung Galaxy Book4 Ultra | |
| Lenovo Yoga Pro 9 16IMH9 | |
| Lenovo Yoga Pro 9 16IMH9 RTX 4050 | |
| Dell XPS 16 9640 | |
| Medio Intel Core Ultra 9 185H (64619 - 87768, n=19) | |
| Asus VivoBook Pro 16 K6602VU | |
| HP Envy x360 2-in-1 16-ad0097nr | |
| AIDA64 / Memory Write | |
| HP Envy x360 2-in-1 16-ad0097nr | |
| Samsung Galaxy Book4 Ultra | |
| Lenovo Yoga Pro 9 16IMH9 | |
| Lenovo Yoga Pro 9 16IMH9 RTX 4050 | |
| Dell XPS 16 9640 | |
| Medio Intel Core Ultra 9 185H (51114 - 93871, n=19) | |
| Asus VivoBook Pro 16 K6602VU | |
| AIDA64 / Memory Latency | |
| Medio Intel Core Ultra 9 185H (121.4 - 259, n=19) | |
| Samsung Galaxy Book4 Ultra | |
| Dell XPS 16 9640 | |
| Lenovo Yoga Pro 9 16IMH9 RTX 4050 | |
| Lenovo Yoga Pro 9 16IMH9 | |
| HP Envy x360 2-in-1 16-ad0097nr | |
| Asus VivoBook Pro 16 K6602VU | |
* ... más pequeño es mejor
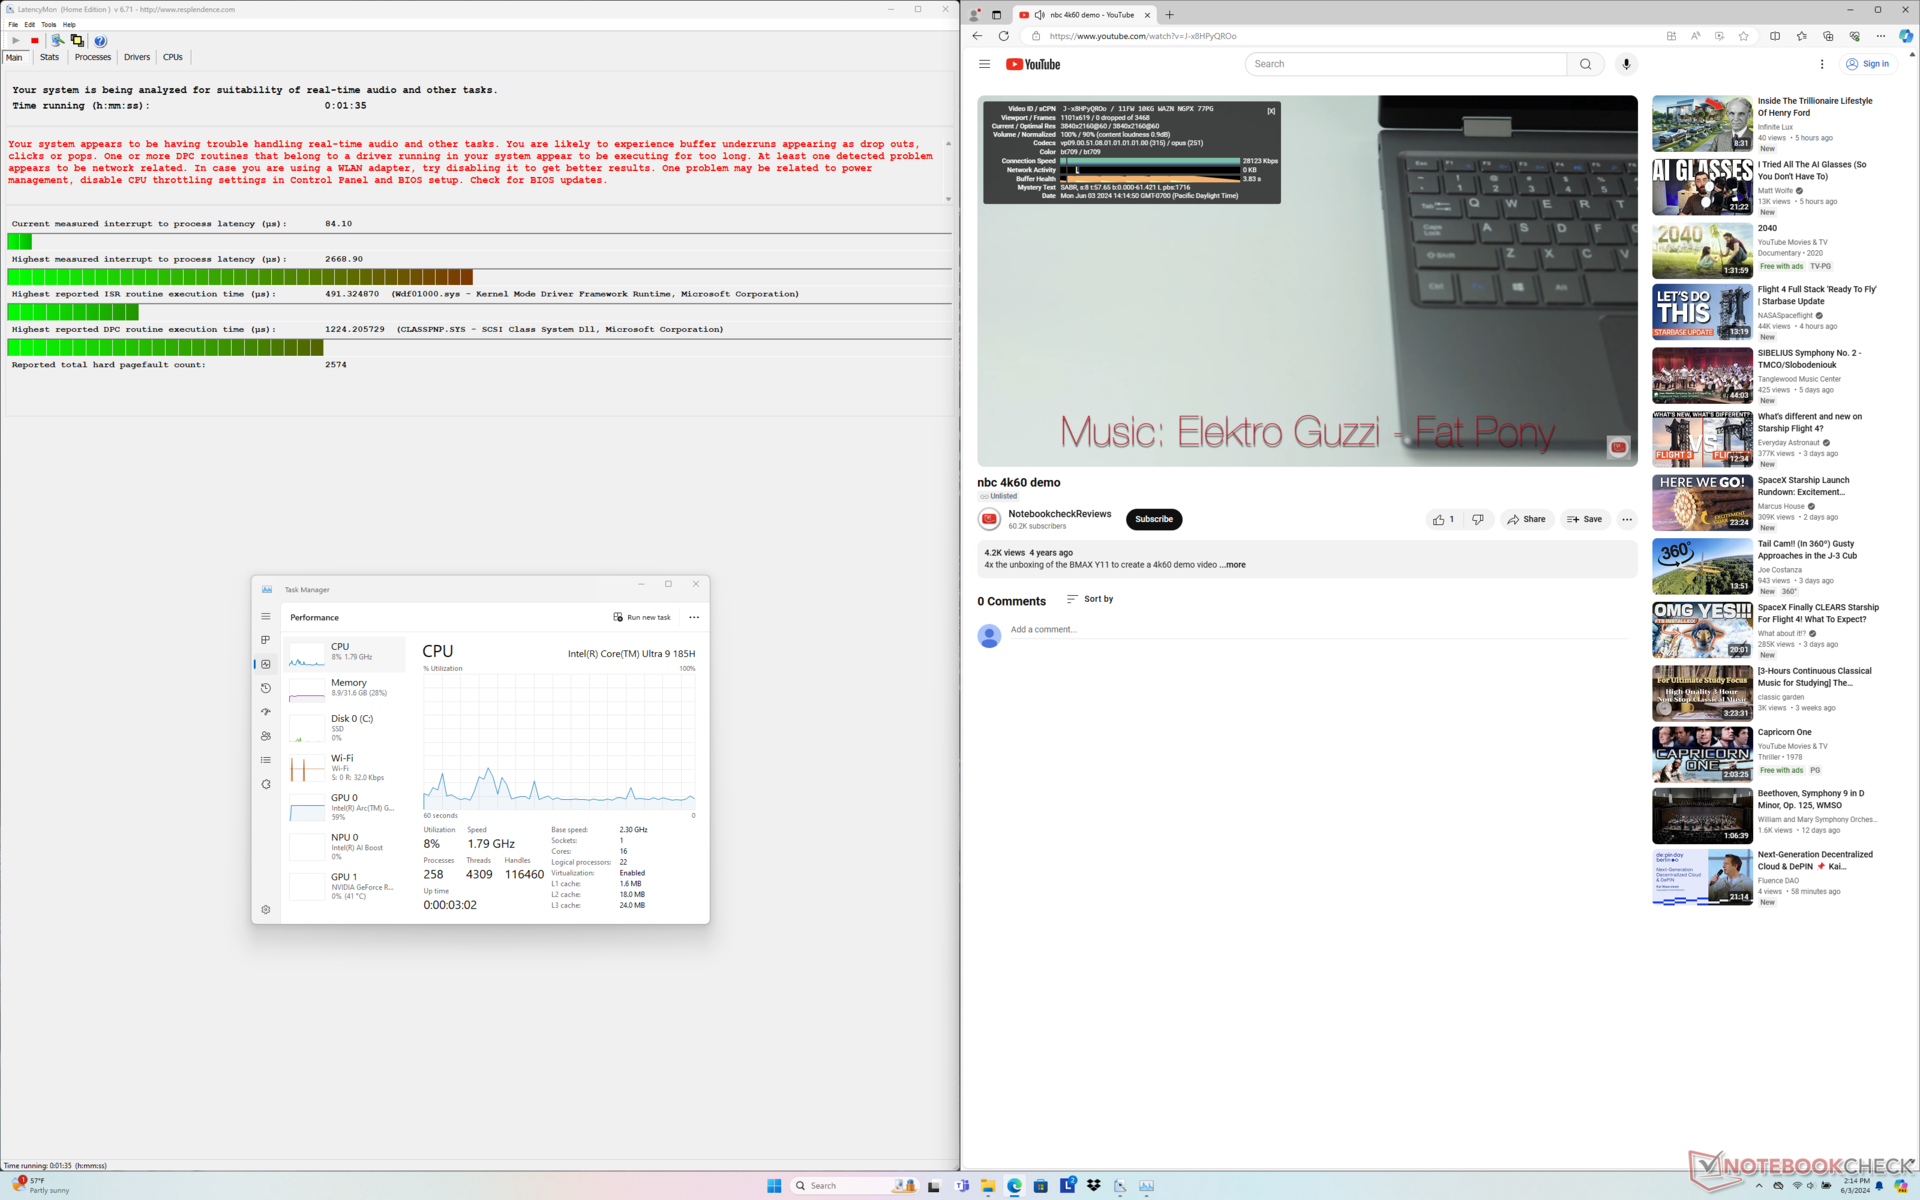
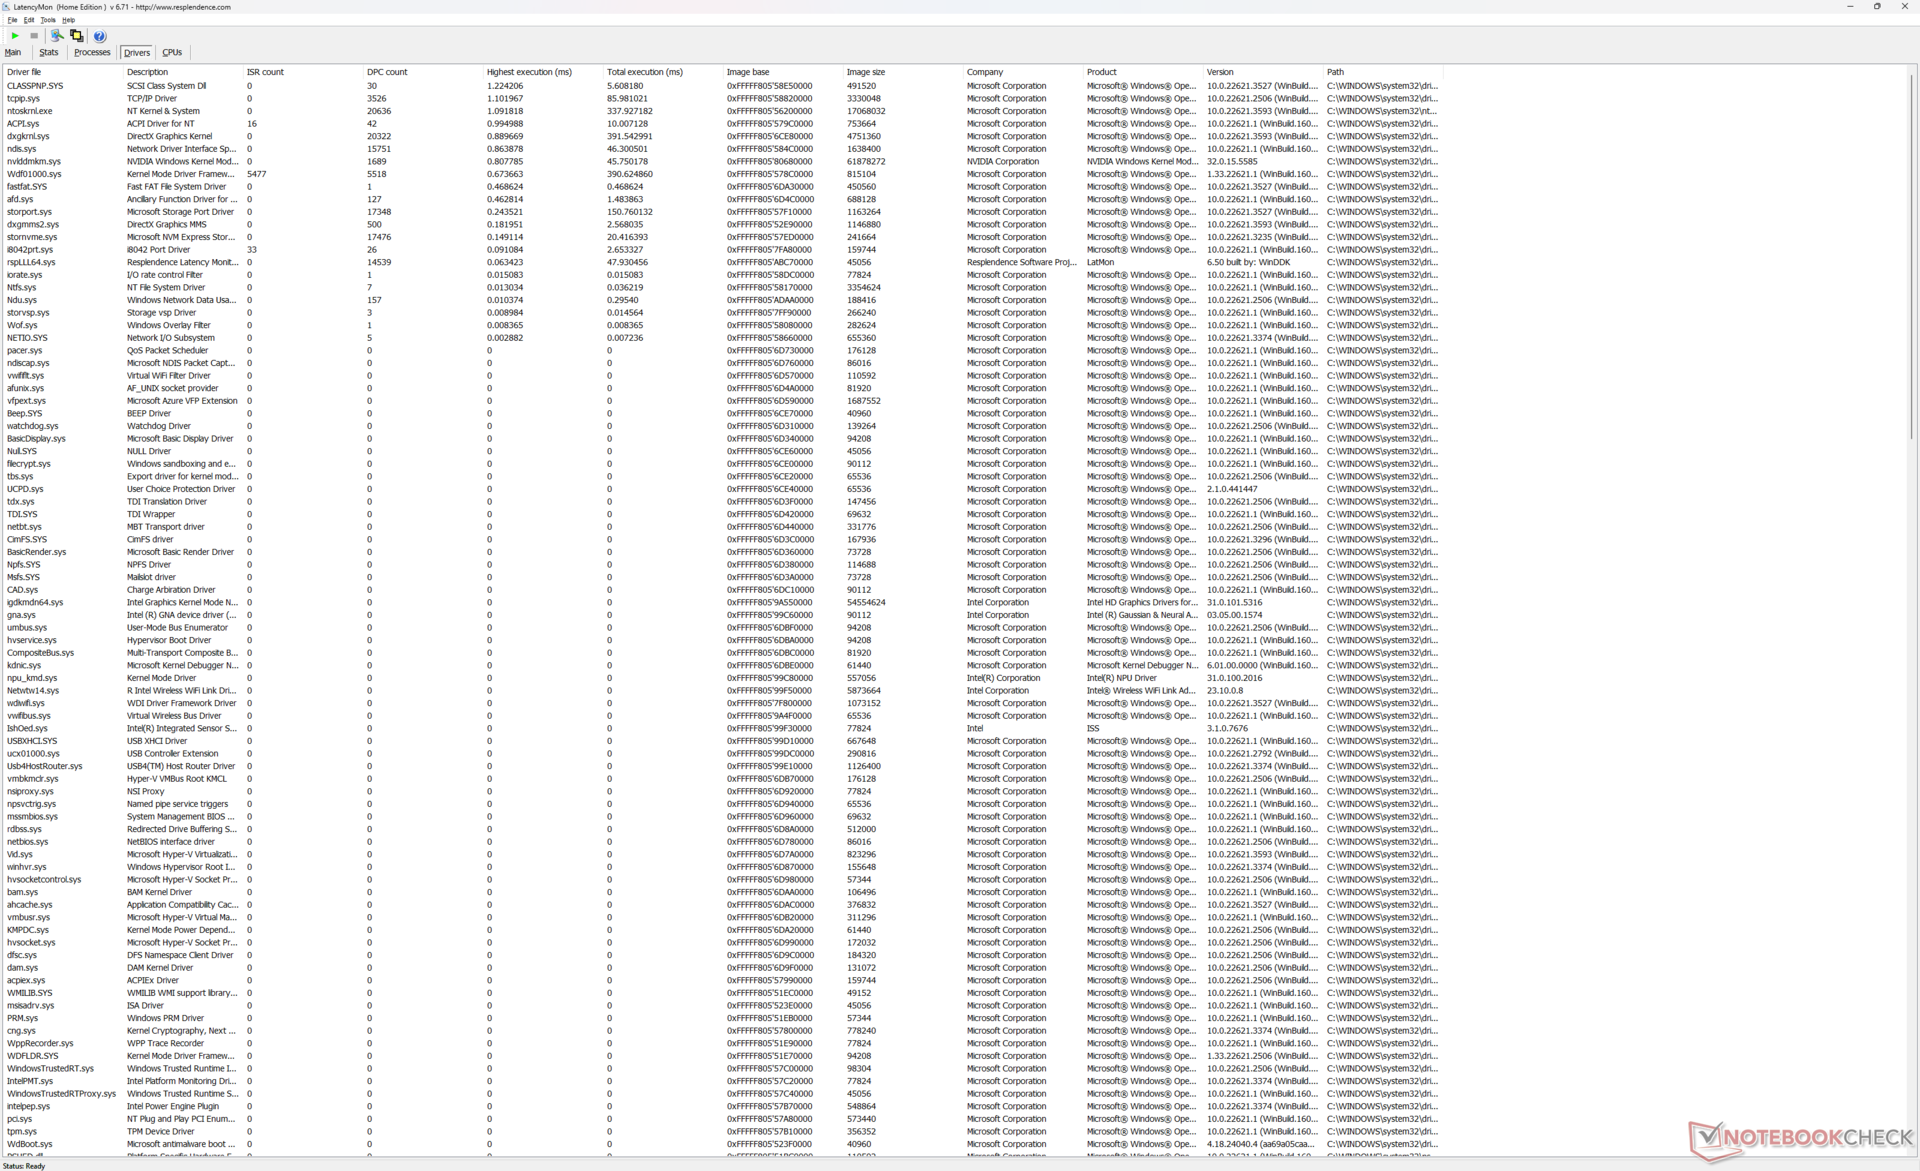
Latencia del CPD
LatencyMon revela más problemas de DPC que la configuración RTX 4070 al abrir varias pestañas del navegador de nuestra página principal. por lo demás, la reproducción de vídeo 4K a 60 FPS es perfecta, sin que se registren caídas de fotogramas.
| DPC Latencies / LatencyMon - interrupt to process latency (max), Web, Youtube, Prime95 | |
| Lenovo Yoga Pro 9 16IMH9 RTX 4050 | |
| Asus VivoBook Pro 16 K6602VU | |
| HP Envy x360 2-in-1 16-ad0097nr | |
| Dell XPS 16 9640 | |
| Samsung Galaxy Book4 Ultra | |
| Lenovo Yoga Pro 9 16IMH9 | |
* ... más pequeño es mejor
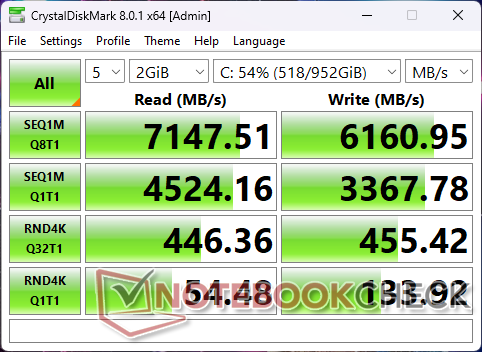
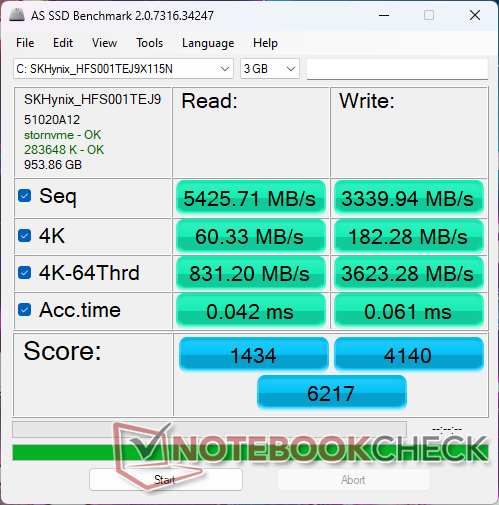
Dispositivos de almacenamiento
Lenovo envía el mismo SK Hynix HFS001TEJ9X115N PCIe4 NVMe SSD entre sus configuraciones RTX 4050 de gama más baja y RTX 4070 de gama más alta.

| Drive Performance Rating - Percent | |
| Dell XPS 16 9640 | |
| Samsung Galaxy Book4 Ultra | |
| Lenovo Yoga Pro 9 16IMH9 RTX 4050 | |
| Lenovo Yoga Pro 9 16IMH9 | |
| Asus VivoBook Pro 16 K6602VU | |
| HP Envy x360 2-in-1 16-ad0097nr | |
* ... más pequeño es mejor
Disk Throttling: DiskSpd Read Loop, Queue Depth 8
Rendimiento de la GPU
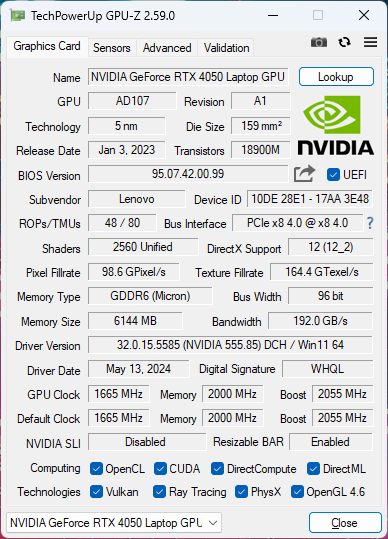
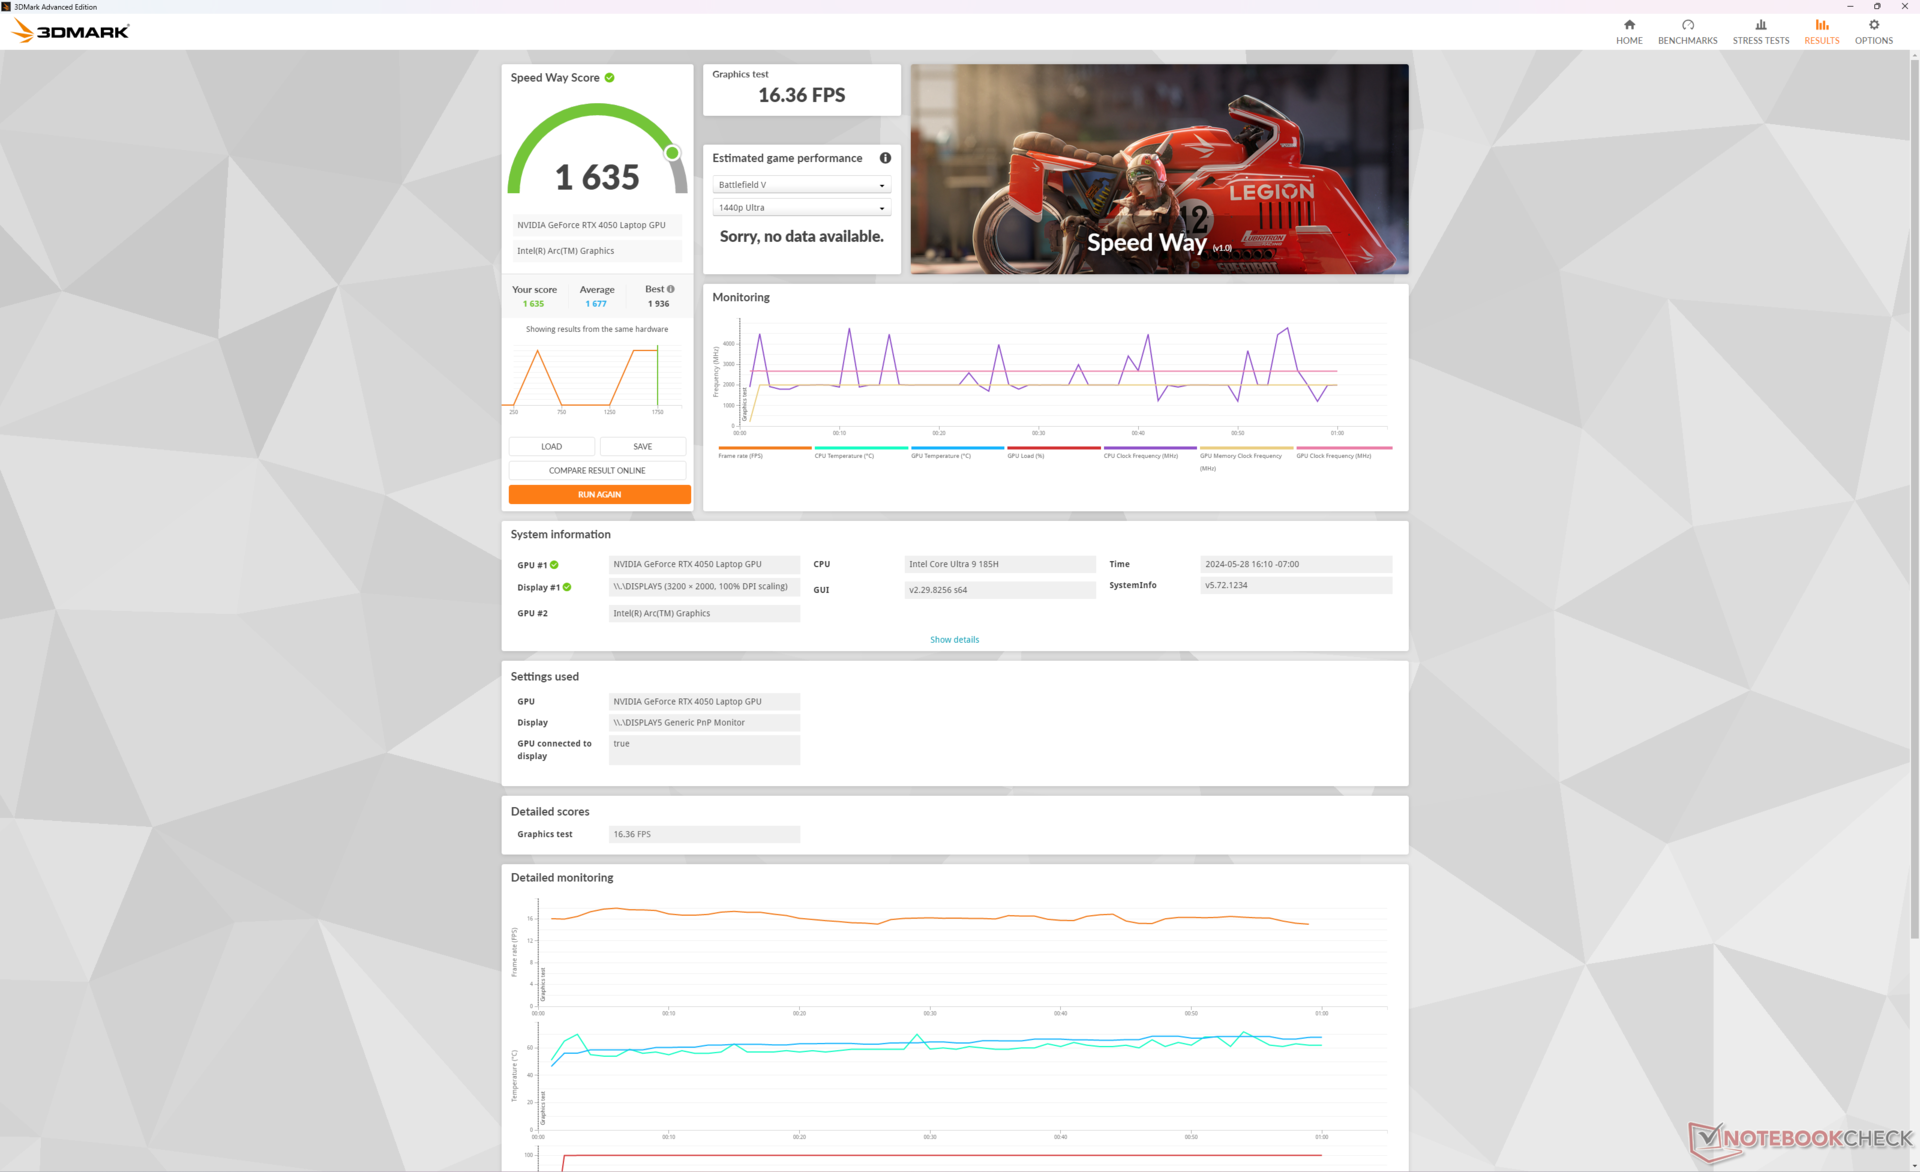
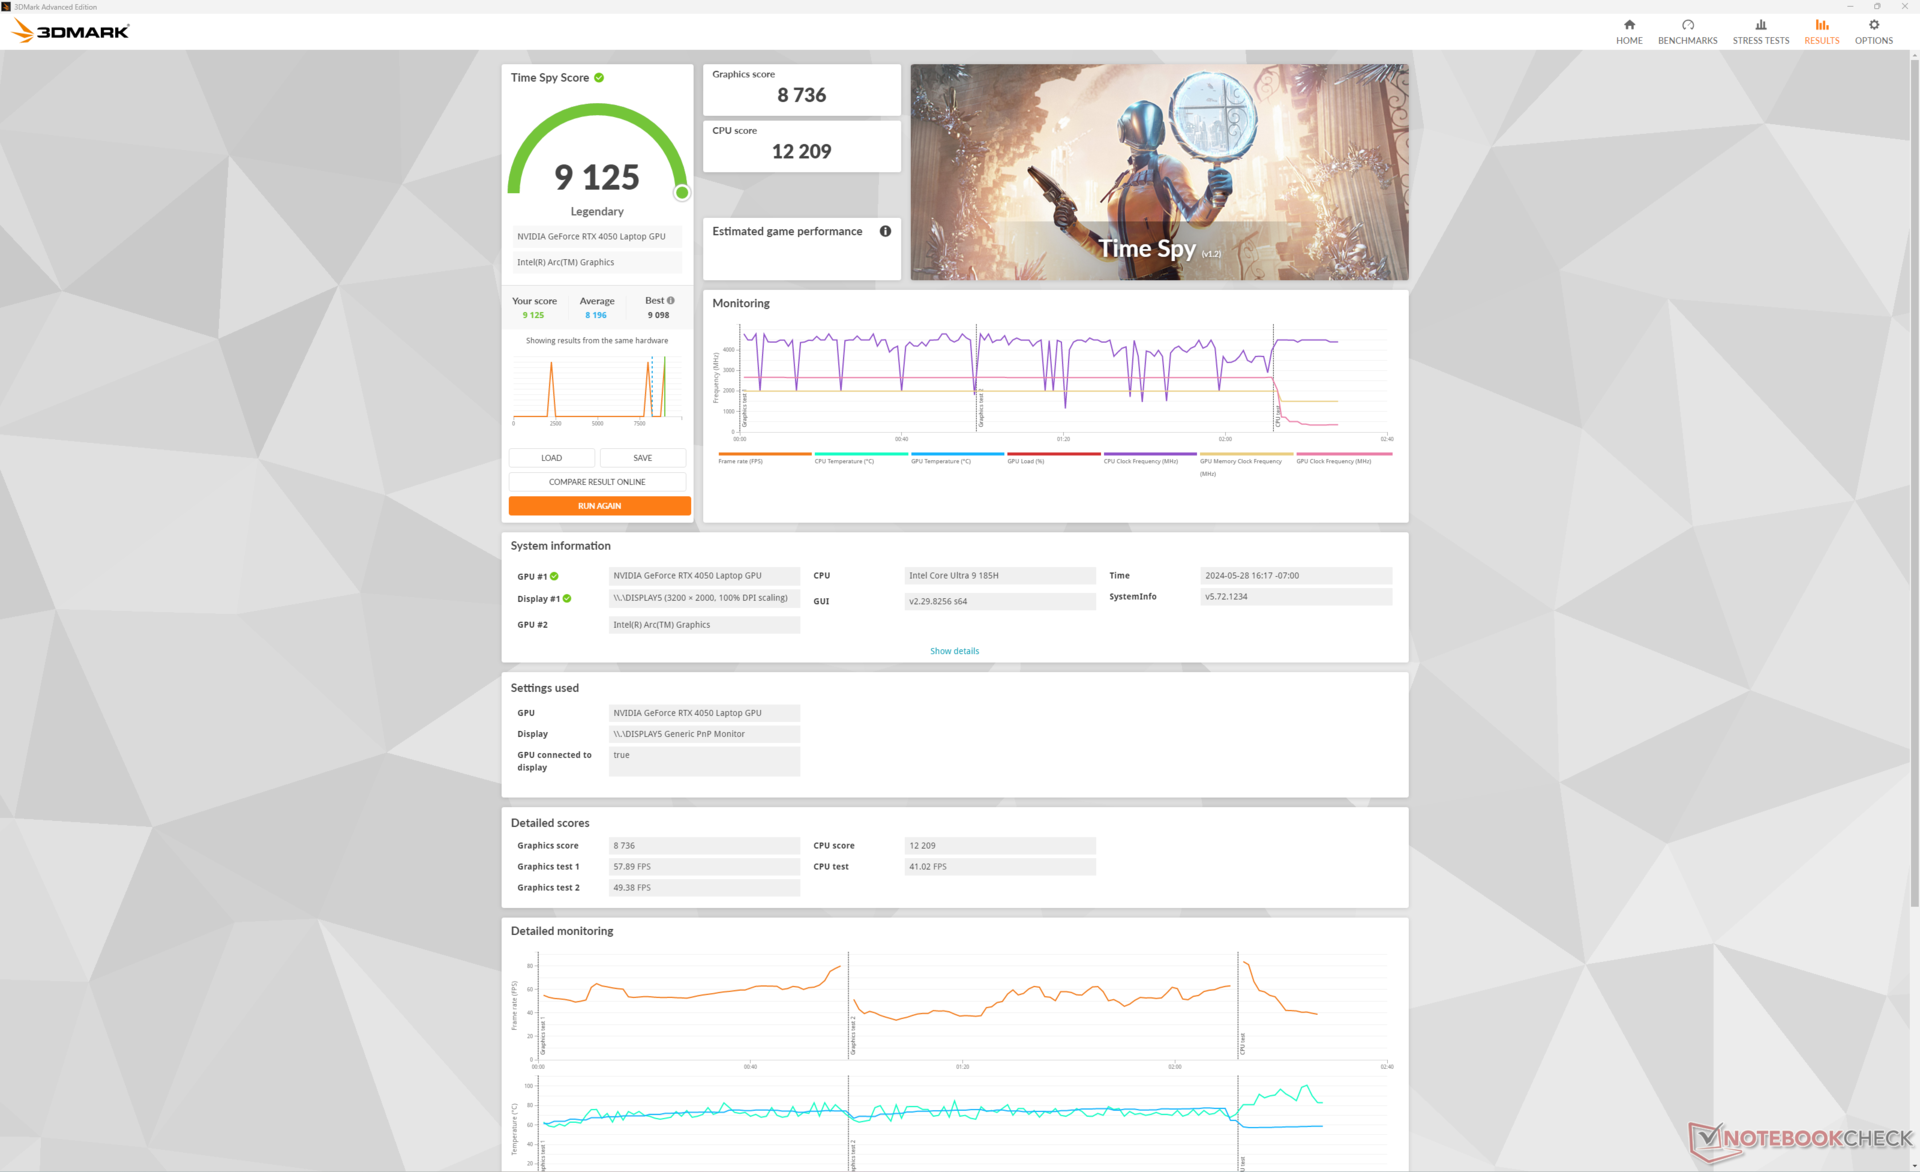
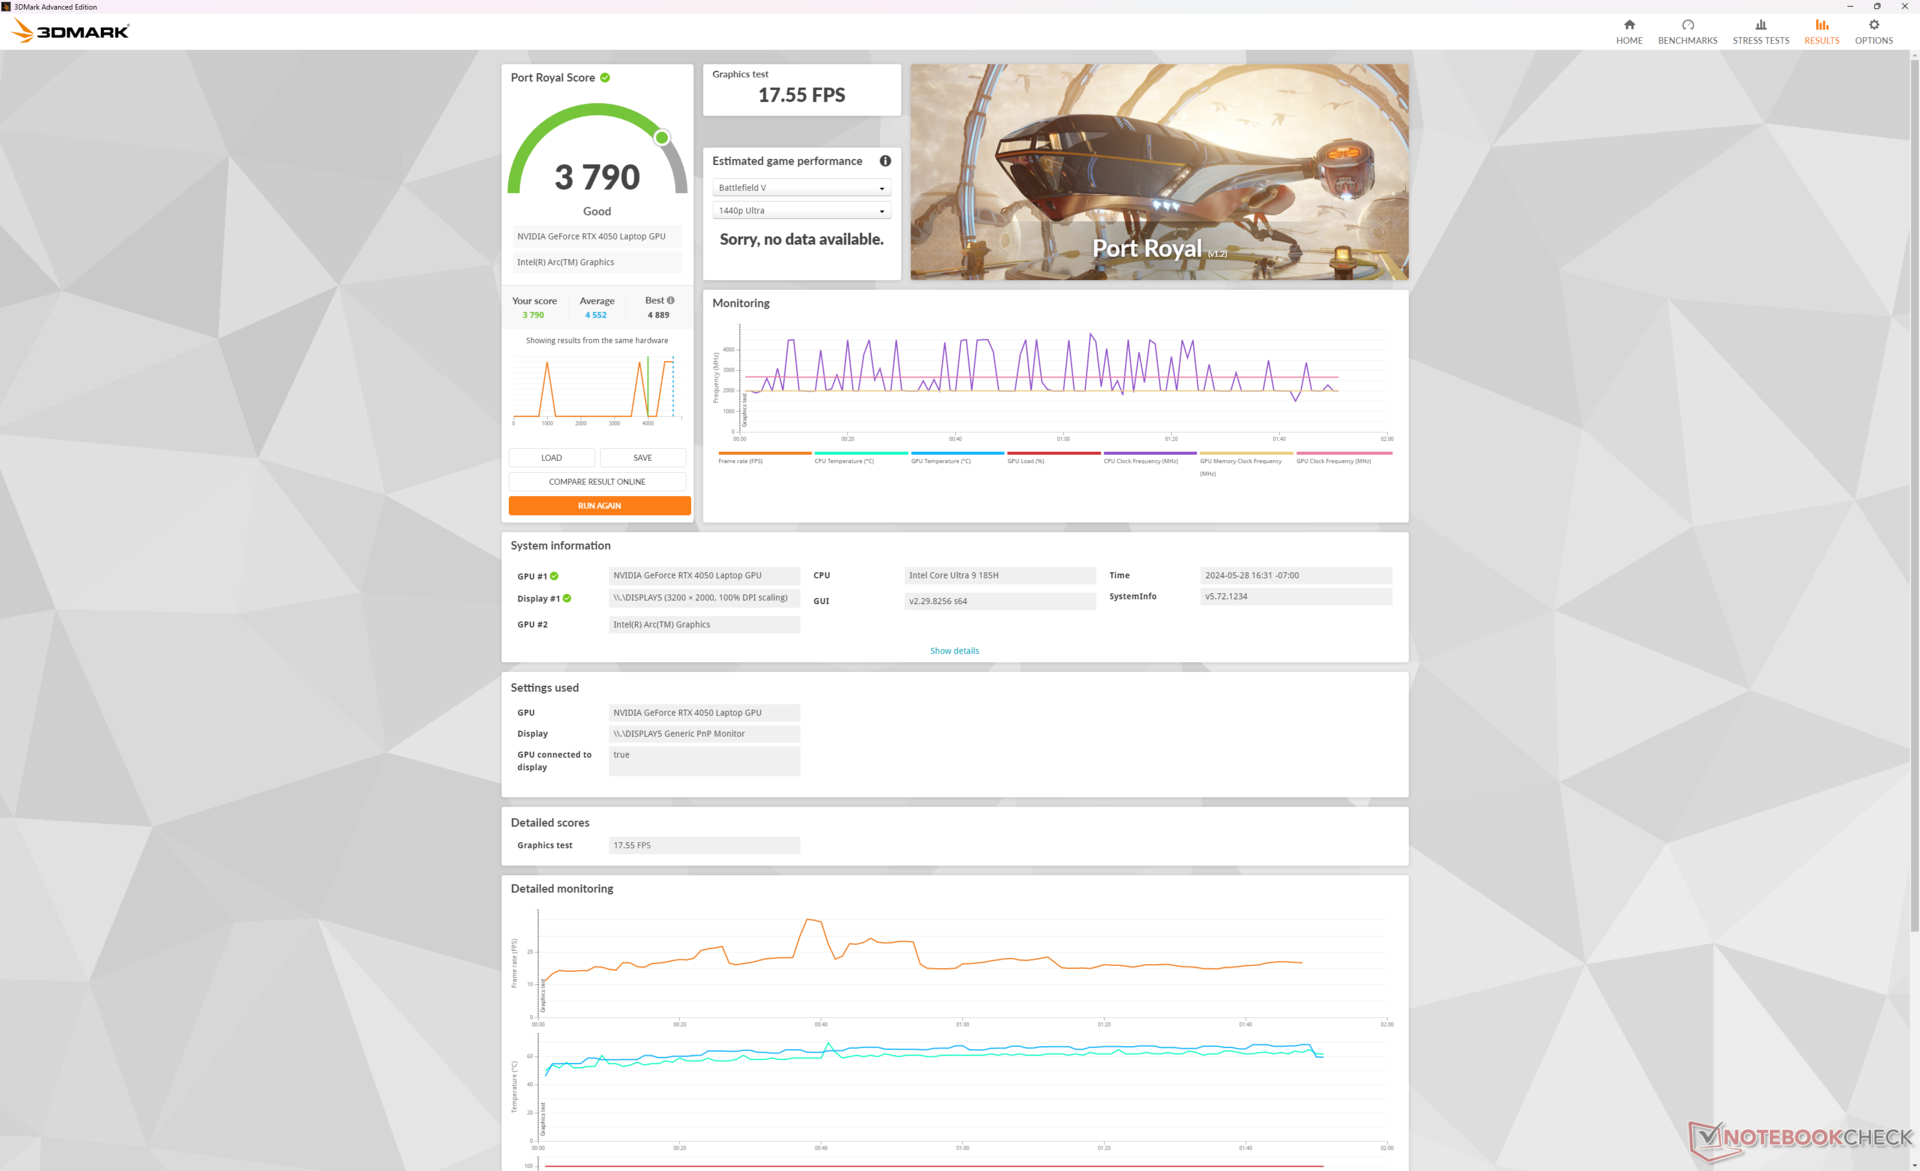
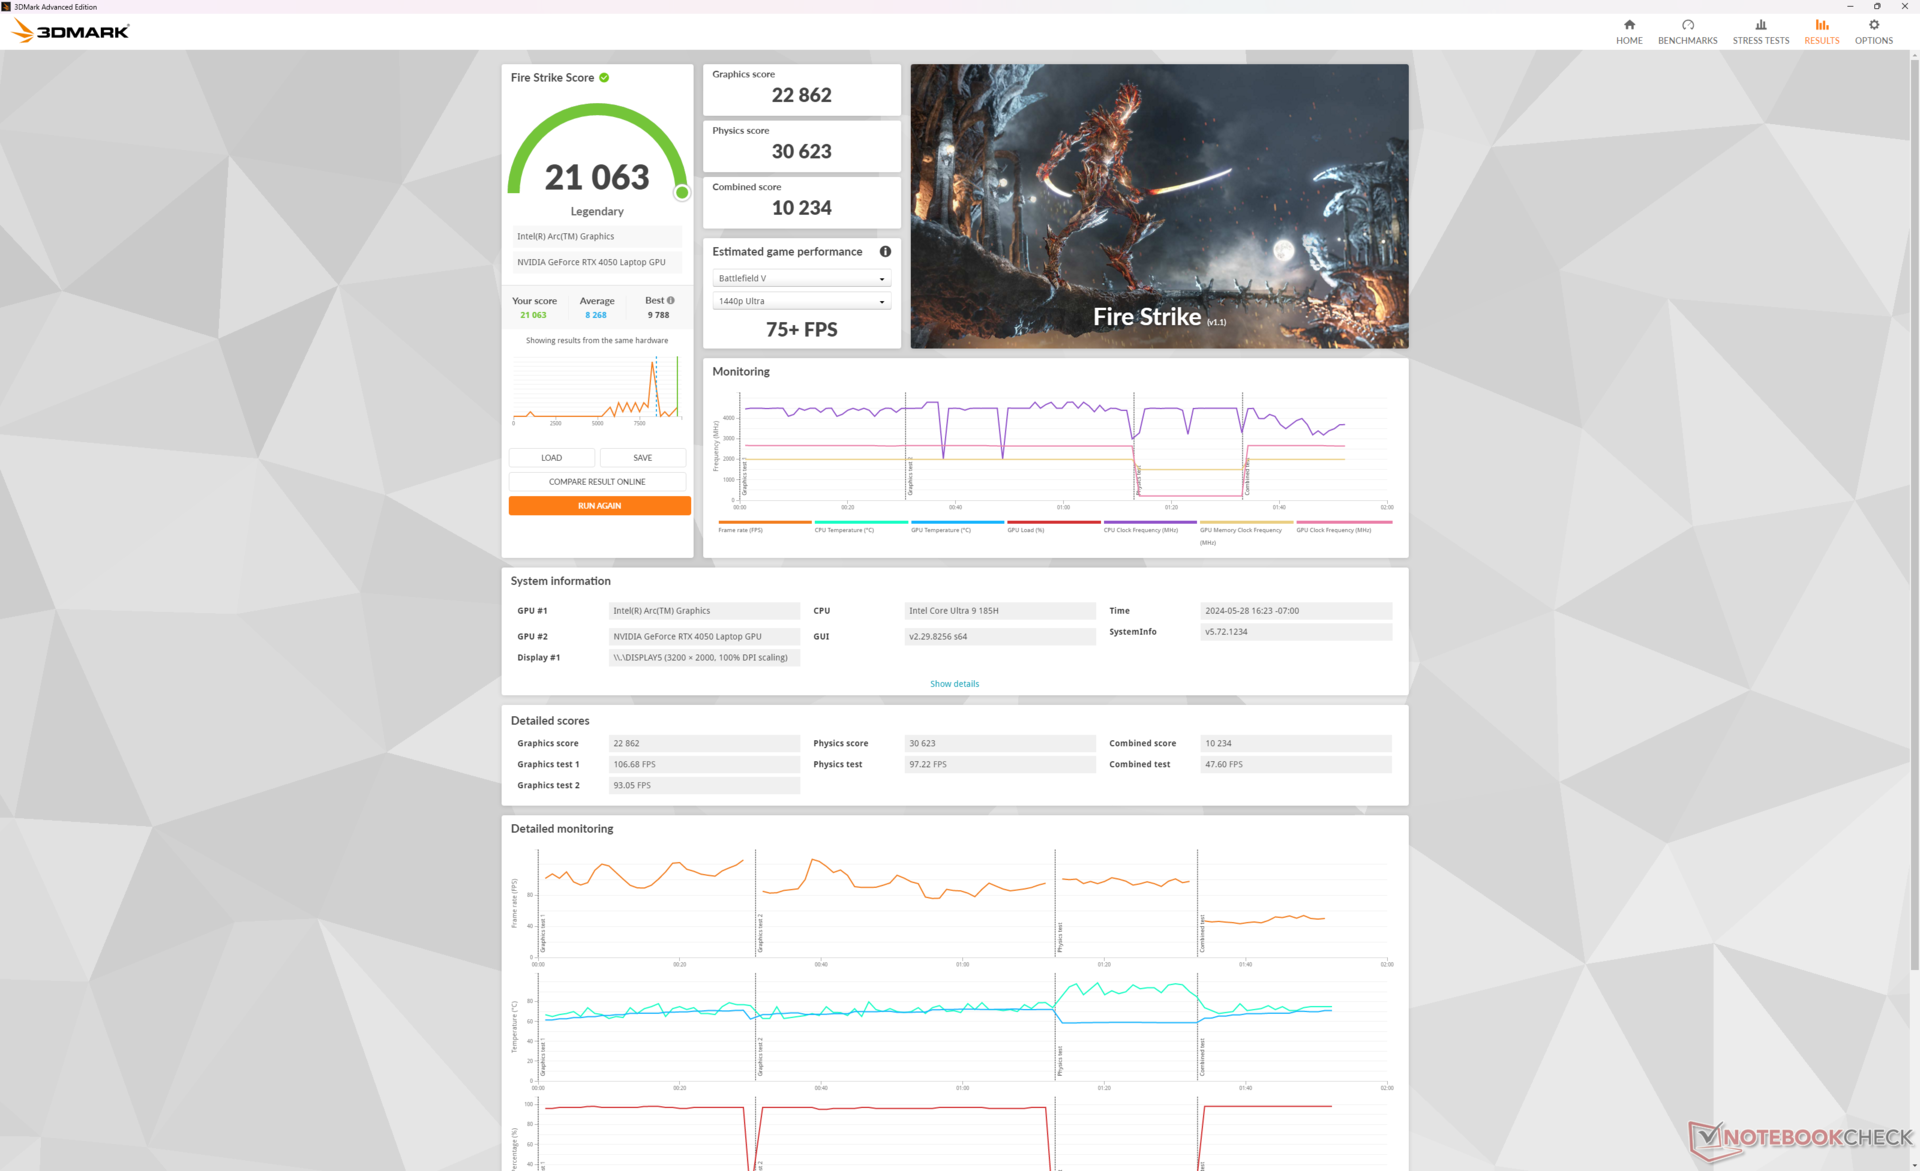
El rendimiento gráfico es mejor de lo esperado con puntuaciones 3DMark que son aproximadamente un 10% más rápidas que la media de portátiles de nuestra base de datos con la misma GPU GeForce RTX 4050. Esta ventaja puede atribuirse en gran medida al elevado objetivo de TGP de 75 W a 100 W del Lenovo, ya que la mayoría de los demás portátiles con la misma GPU tienen techos de TGP más bajos. Mientras que el panel de control de Nvidia afirma una potencia gráfica total de 100 W para la RTX 4050, en su lugar se estabilizaría típicamente en alrededor de 75 W a 85 W cuando se ejecutan juegos como se ejemplifica en nuestra sección de prueba de estrés anterior.
El rendimiento global es entre un 25 y un 30 por ciento más lento que el de la configuración RTX 4070, que puede alcanzar rangos de potencia más elevados, entre 90 W y 100 W. Es importante tener esto en cuenta para la sección de consumo de energía que aparece más adelante para los análisis de rendimiento por vatio.
| Perfil de potencia | Puntuación gráfica | Puntuación Física | Puntuación combinada |
| Modo Rendimiento | 22862 | 30623 | 10234 |
| Modo equilibrado | 21008 (-8%) | 29772 (-3%) | 8401 (-18%) |
| Batería | 20095 (-12%) | 30278 (-1%) | 7999 (-22%) |
Ejecutar en modo equilibrado afecta más al rendimiento de la GPU que al de la CPU, como muestra nuestra tabla de resultados Fire Strike.
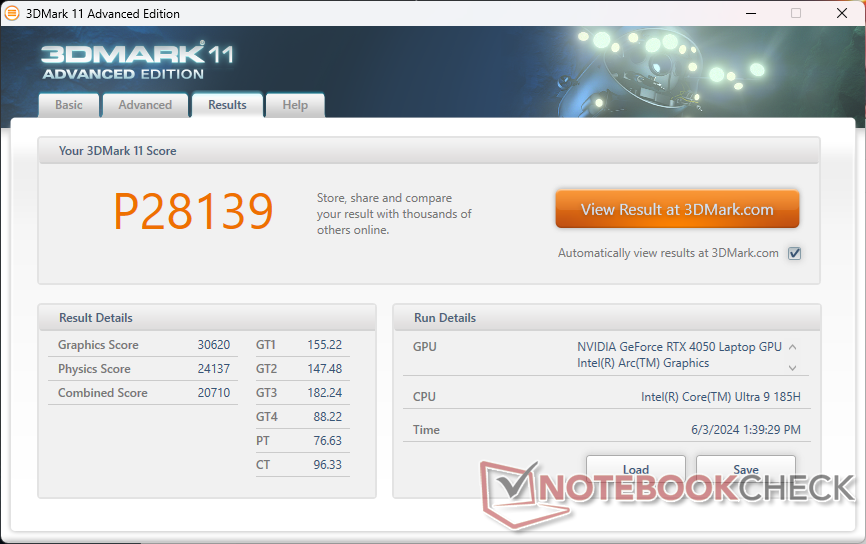
| 3DMark 11 Performance | 28139 puntos | |
| 3DMark Fire Strike Score | 21063 puntos | |
| 3DMark Time Spy Score | 9125 puntos | |
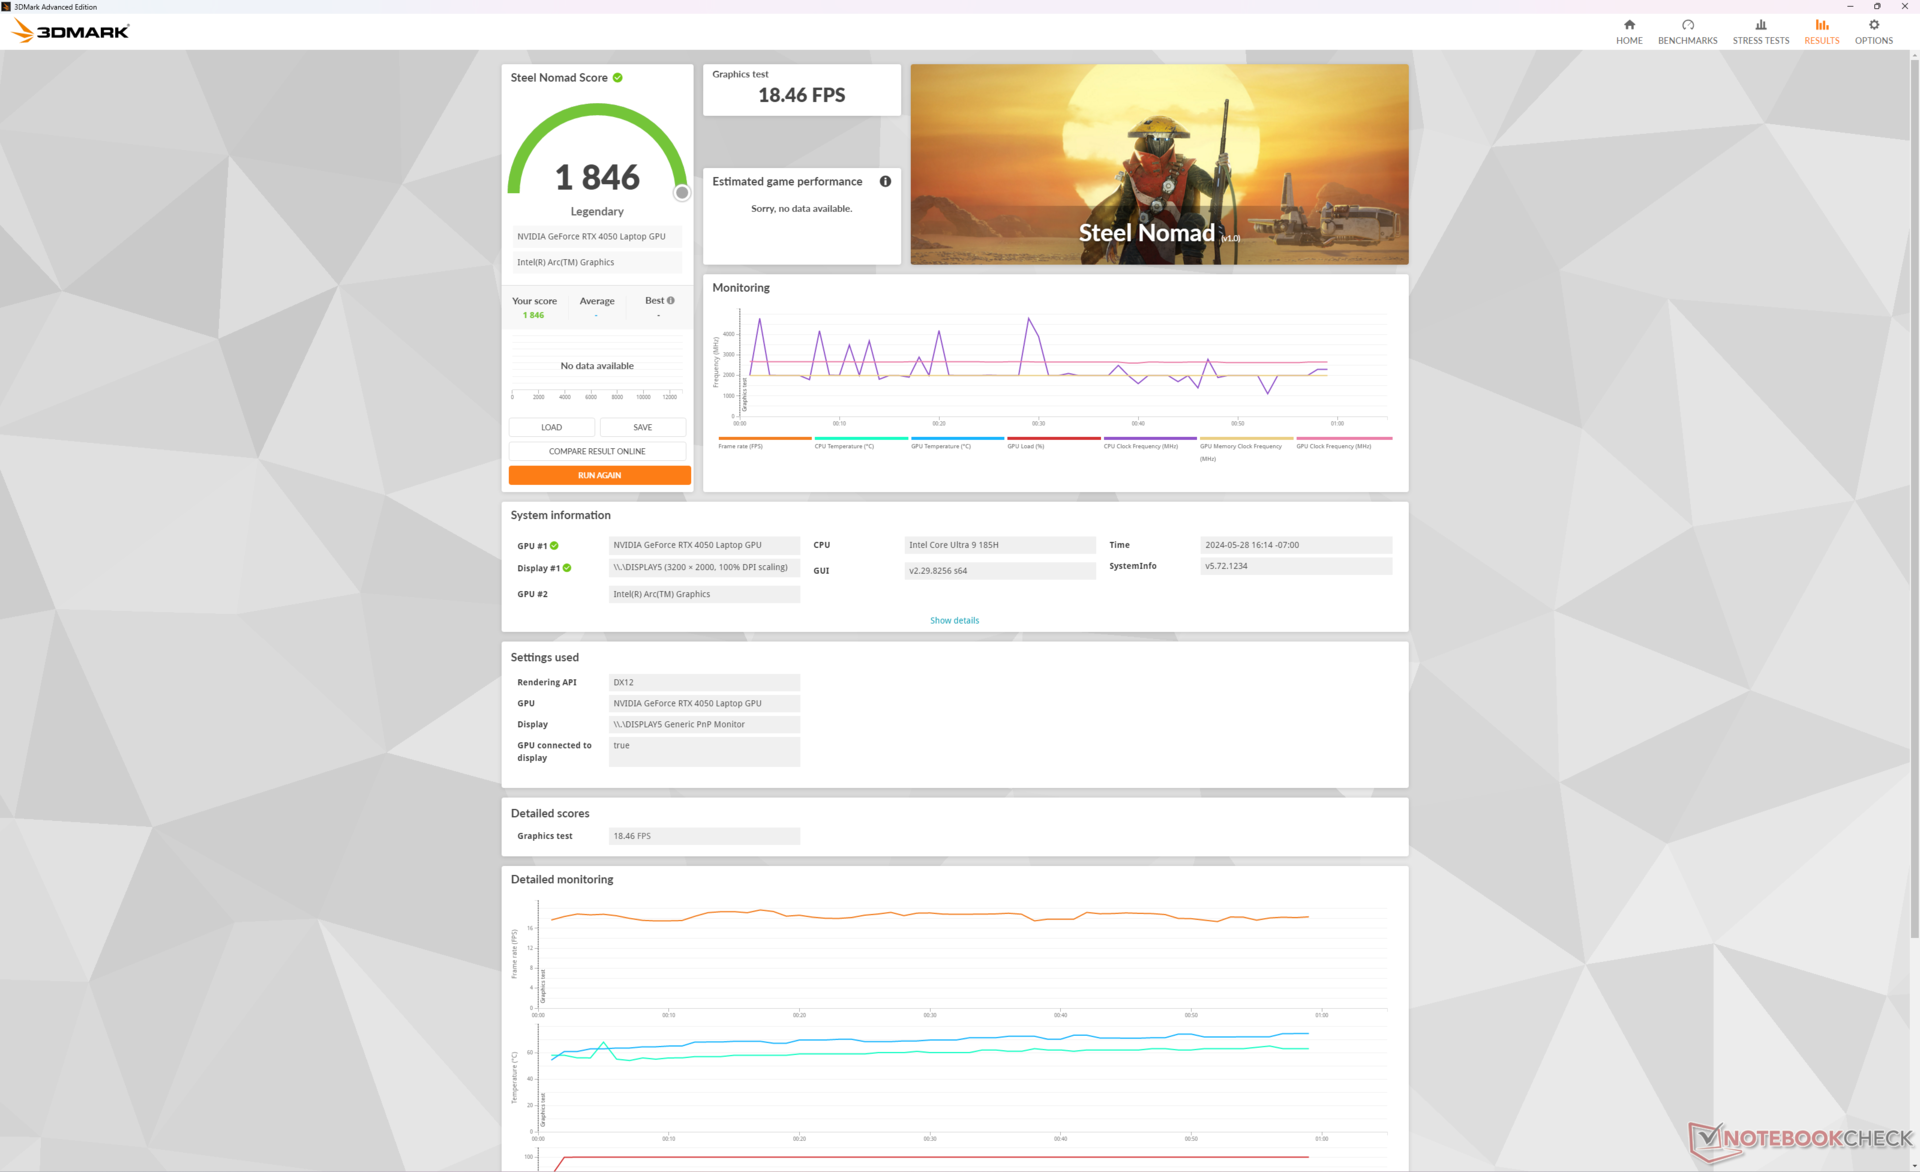
| 3DMark Steel Nomad Score | 1846 puntos | |
ayuda | ||
* ... más pequeño es mejor
Rendimiento en juegos
El sistema es lo suficientemente potente como para ejecutar juegos exigentes como Cyberpunk 2077 a la resolución nativa de 3200 x 2000 con ajustes medios o inferiores. Para obtener los mejores resultados, sin embargo, se recomienda activar DLSS siempre que sea posible para aumentar la velocidad de fotogramas más cerca de 60 + FPS.
| Performance Rating - Percent | |
| Lenovo Yoga Pro 9 16IMH9 | |
| Lenovo Yoga Pro 9 16IMH9 RTX 4050 | |
| Asus VivoBook Pro 16 K6602VU | |
| Dell XPS 16 9640 | |
| Samsung Galaxy Book4 Ultra | |
| HP Envy x360 2-in-1 16-ad0097nr | |
| The Witcher 3 - 1920x1080 Ultra Graphics & Postprocessing (HBAO+) | |
| Lenovo Yoga Pro 9 16IMH9 | |
| Dell XPS 16 9640 | |
| Lenovo Yoga Pro 9 16IMH9 RTX 4050 | |
| Asus VivoBook Pro 16 K6602VU | |
| Samsung Galaxy Book4 Ultra | |
| HP Envy x360 2-in-1 16-ad0097nr | |
| Final Fantasy XV Benchmark - 1920x1080 High Quality | |
| Lenovo Yoga Pro 9 16IMH9 | |
| Dell XPS 16 9640 | |
| Lenovo Yoga Pro 9 16IMH9 RTX 4050 | |
| Asus VivoBook Pro 16 K6602VU | |
| Samsung Galaxy Book4 Ultra | |
| HP Envy x360 2-in-1 16-ad0097nr | |
| Strange Brigade - 1920x1080 ultra AA:ultra AF:16 | |
| Lenovo Yoga Pro 9 16IMH9 | |
| Dell XPS 16 9640 | |
| Lenovo Yoga Pro 9 16IMH9 RTX 4050 | |
| Asus VivoBook Pro 16 K6602VU | |
| Samsung Galaxy Book4 Ultra | |
| HP Envy x360 2-in-1 16-ad0097nr | |
| Dota 2 Reborn - 1920x1080 ultra (3/3) best looking | |
| Lenovo Yoga Pro 9 16IMH9 | |
| Lenovo Yoga Pro 9 16IMH9 RTX 4050 | |
| Samsung Galaxy Book4 Ultra | |
| Asus VivoBook Pro 16 K6602VU | |
| Dell XPS 16 9640 | |
| HP Envy x360 2-in-1 16-ad0097nr | |
| X-Plane 11.11 - 1920x1080 high (fps_test=3) | |
| Asus VivoBook Pro 16 K6602VU | |
| Lenovo Yoga Pro 9 16IMH9 | |
| Lenovo Yoga Pro 9 16IMH9 RTX 4050 | |
| Dell XPS 16 9640 | |
| Dell XPS 16 9640 | |
| Samsung Galaxy Book4 Ultra | |
| HP Envy x360 2-in-1 16-ad0097nr | |
Witcher 3 FPS Chart
| bajo | medio | alto | ultra | QHD | |
|---|---|---|---|---|---|
| The Witcher 3 (2015) | 395.6 | 290.5 | 164 | 83.7 | 61 |
| Dota 2 Reborn (2015) | 174.6 | 148.7 | 145.1 | 138.5 | |
| Final Fantasy XV Benchmark (2018) | 182.4 | 121.5 | 84.2 | 61.6 | |
| X-Plane 11.11 (2018) | 134.8 | 117.7 | 89.4 | ||
| Far Cry 5 (2018) | 151 | 129 | 121 | 113 | 86 |
| Strange Brigade (2018) | 432 | 213 | 170.9 | 150 | 99.7 |
| Tiny Tina's Wonderlands (2022) | 181.1 | 141.8 | 93.3 | 72.3 | 49.5 |
| F1 22 (2022) | 221 | 219 | 171.5 | 53.4 | 34 |
| Baldur's Gate 3 (2023) | 112.3 | 91.9 | 83.5 | 81.3 | 55 |
| Cyberpunk 2077 2.2 Phantom Liberty (2023) | 101.9 | 79.6 | 67.8 | 58.3 | 36.4 |
Emisiones
Ruido del sistema
El comportamiento del ruido del ventilador es casi idéntico al que registramos en la configuración superior RTX 4070, lo que sugiere que la configuración más débil RTX 4050 no es más silenciosa a pesar de su GPU más lenta.
Ruido
| Ocioso |
| 23.6 / 25.4 / 25.4 dB(A) |
| Carga |
| 44.2 / 52.6 dB(A) |
 | ||
30 dB silencioso 40 dB(A) audible 50 dB(A) ruidosamente alto |
||
min: | ||
| Lenovo Yoga Pro 9 16IMH9 RTX 4050 NVIDIA GeForce RTX 4050 Laptop GPU, Ultra 9 185H, SK Hynix HFS001TEJ9X115N | Lenovo Yoga Pro 9 16IMH9 NVIDIA GeForce RTX 4070 Laptop GPU, Ultra 9 185H, SK Hynix HFS001TEJ9X115N | HP Envy x360 2-in-1 16-ad0097nr Radeon 780M, R7 8840HS, KIOXIA BG5 KBG50ZNV1T02 | Dell XPS 16 9640 NVIDIA GeForce RTX 4070 Laptop GPU, Ultra 7 155H, Kioxia XG8 KXG80ZNV1T02 | Samsung Galaxy Book4 Ultra NVIDIA GeForce RTX 4050 Laptop GPU, Ultra 7 155H, Samsung PM9A1 MZVL2512HCJQ | Asus VivoBook Pro 16 K6602VU NVIDIA GeForce RTX 4050 Laptop GPU, i9-13900H, Micron 2400 MTFDKBA1T0QFM | |
|---|---|---|---|---|---|---|
| Noise | -2% | 14% | 0% | 8% | -2% | |
| apagado / medio ambiente * | 23.6 | 24.3 -3% | 22.9 3% | 24.5 -4% | 24.2 -3% | 20.96 11% |
| Idle Minimum * | 23.6 | 24.3 -3% | 23 3% | 24.5 -4% | 24.2 -3% | 25.28 -7% |
| Idle Average * | 25.4 | 24.3 4% | 23 9% | 24.5 4% | 24.2 5% | 25.28 -0% |
| Idle Maximum * | 25.4 | 25.8 -2% | 23 9% | 27.5 -8% | 24.2 5% | 25.28 -0% |
| Load Average * | 44.2 | 48.1 -9% | 23.8 46% | 39.6 10% | 37.9 14% | 51.88 -17% |
| Witcher 3 ultra * | 48.9 | 49.7 -2% | 43.8 10% | 49.7 -2% | 41.7 15% | 49 -0% |
| Load Maximum * | 52.6 | 53.9 -2% | 43.8 17% | 49.7 6% | 41.7 21% | 51.8 2% |
* ... más pequeño es mejor
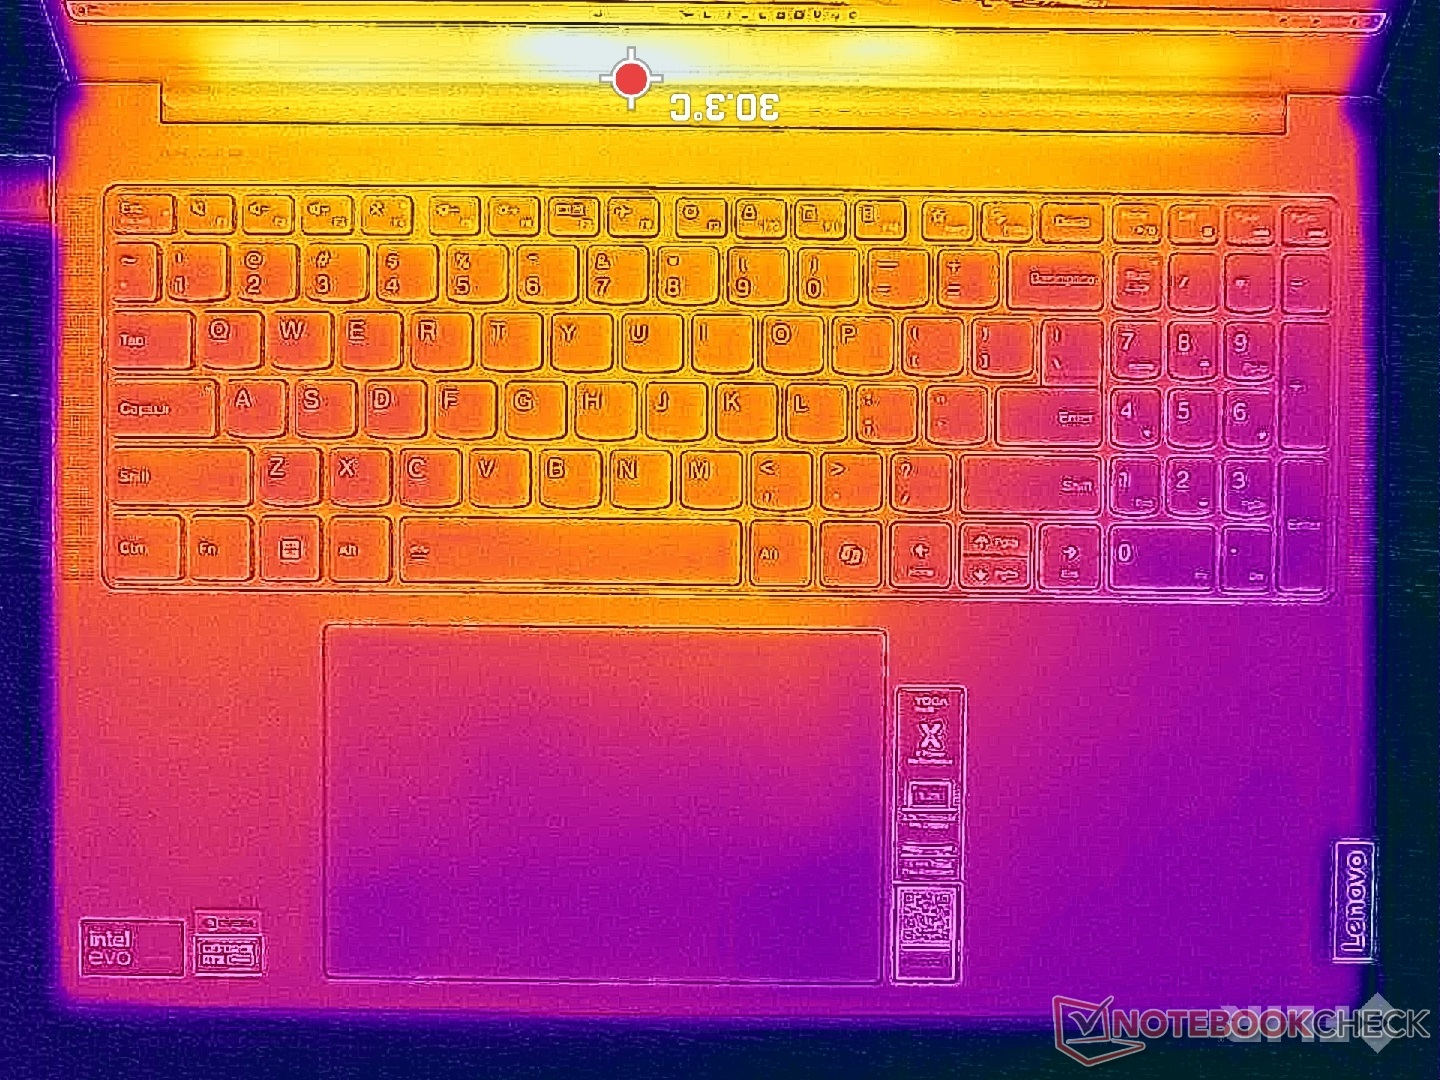
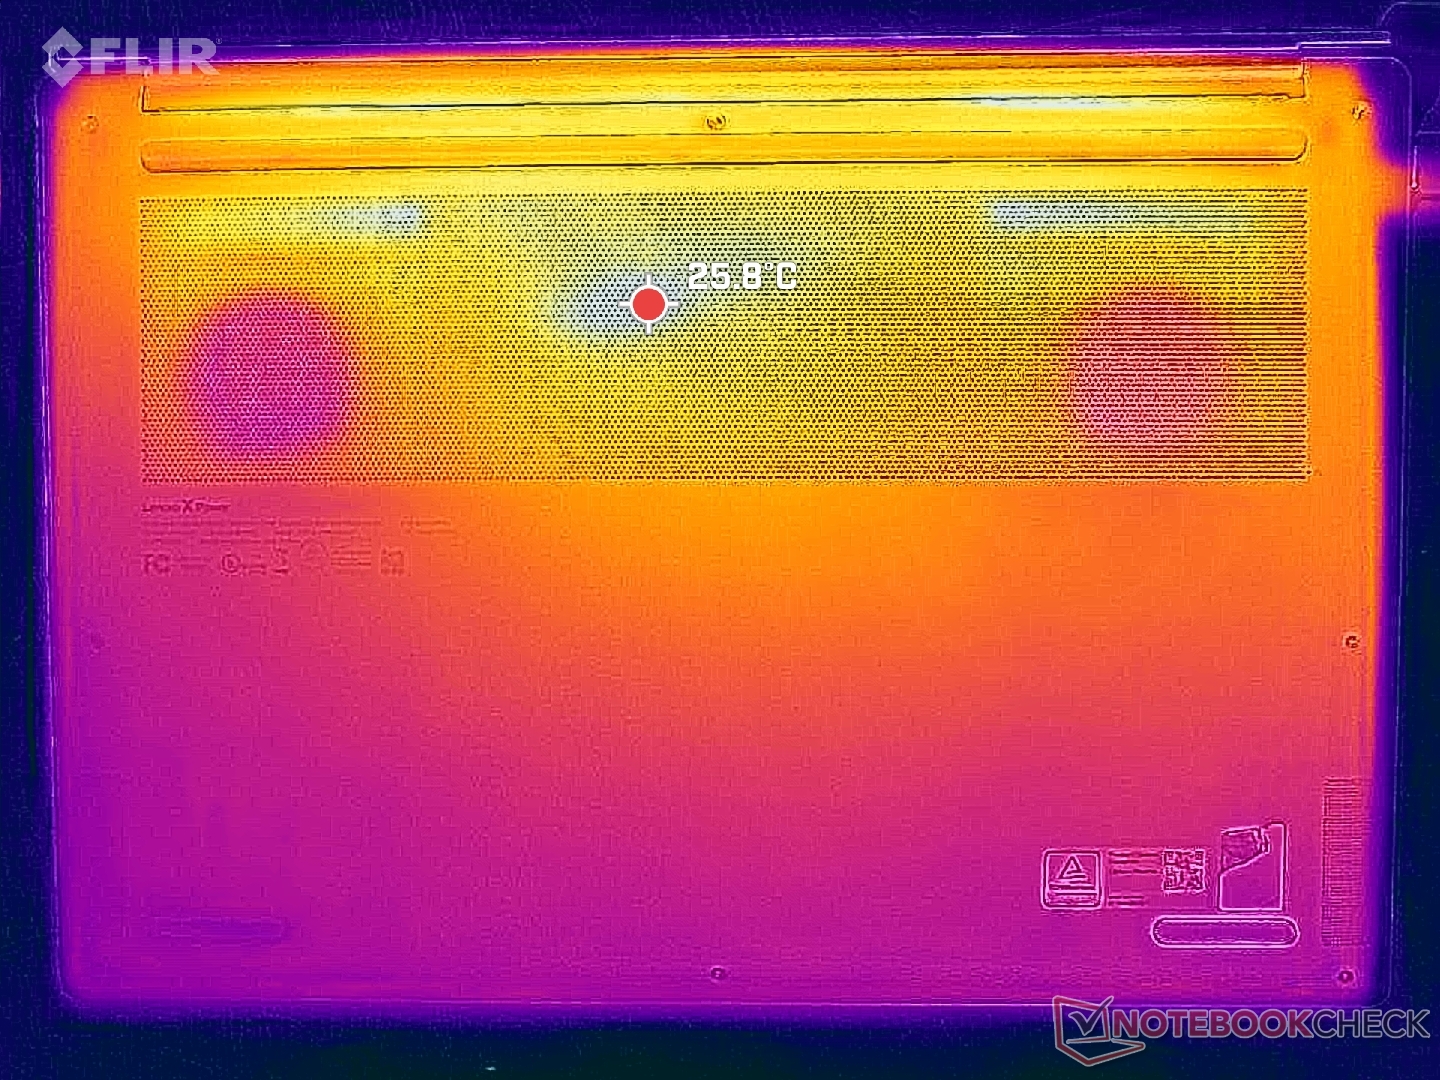
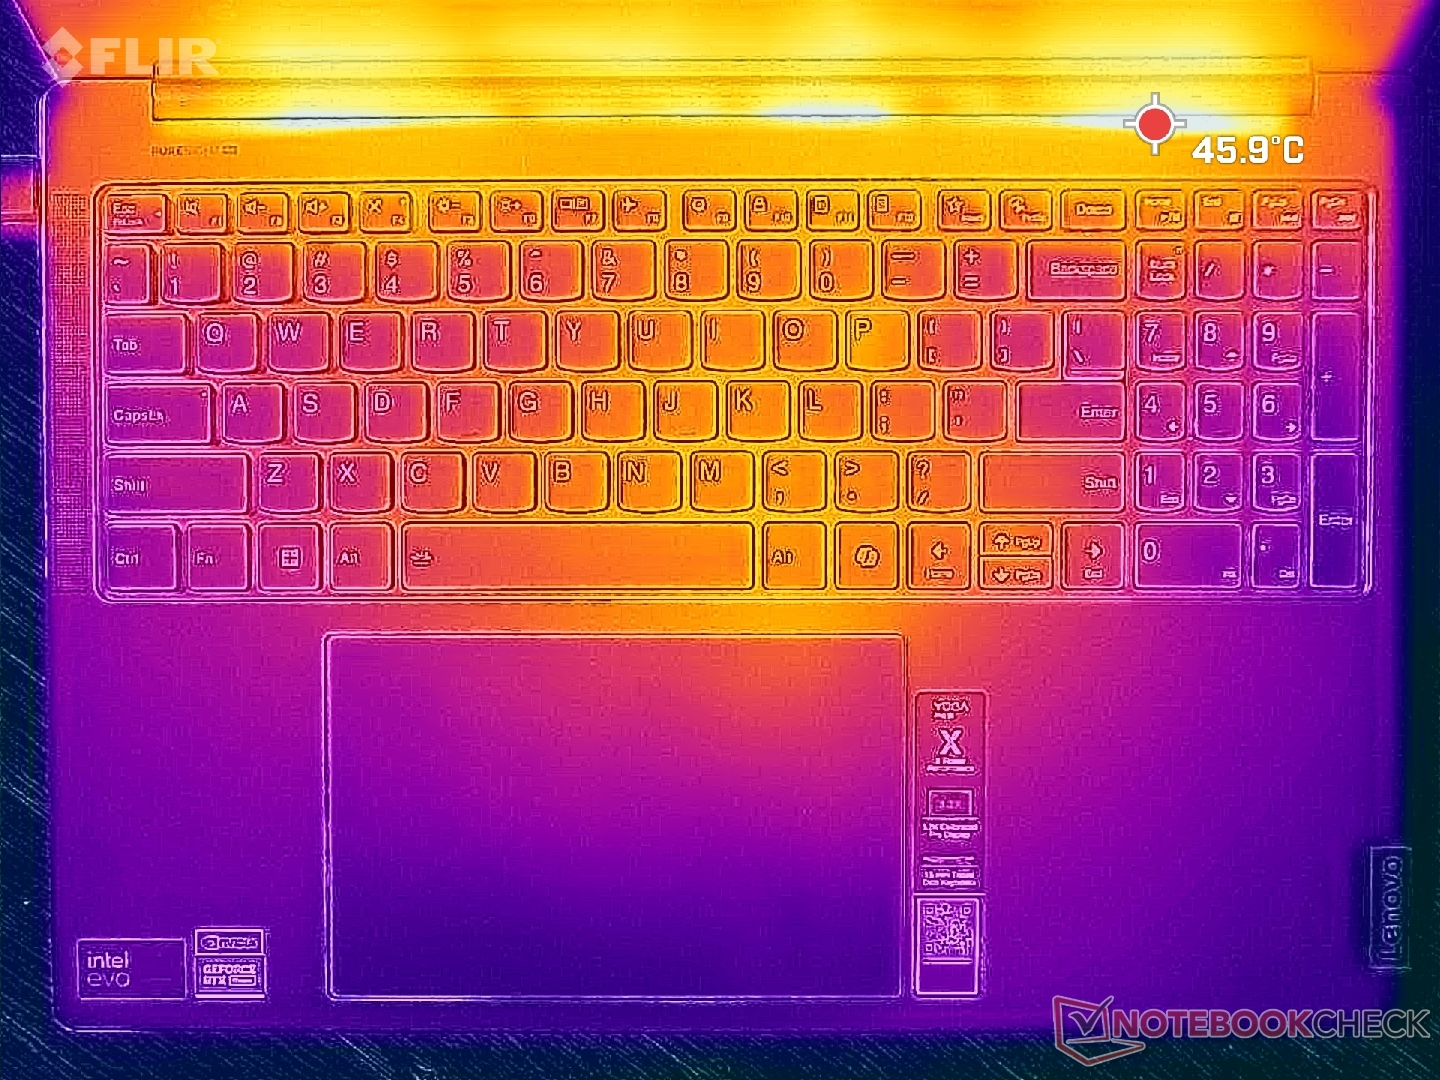
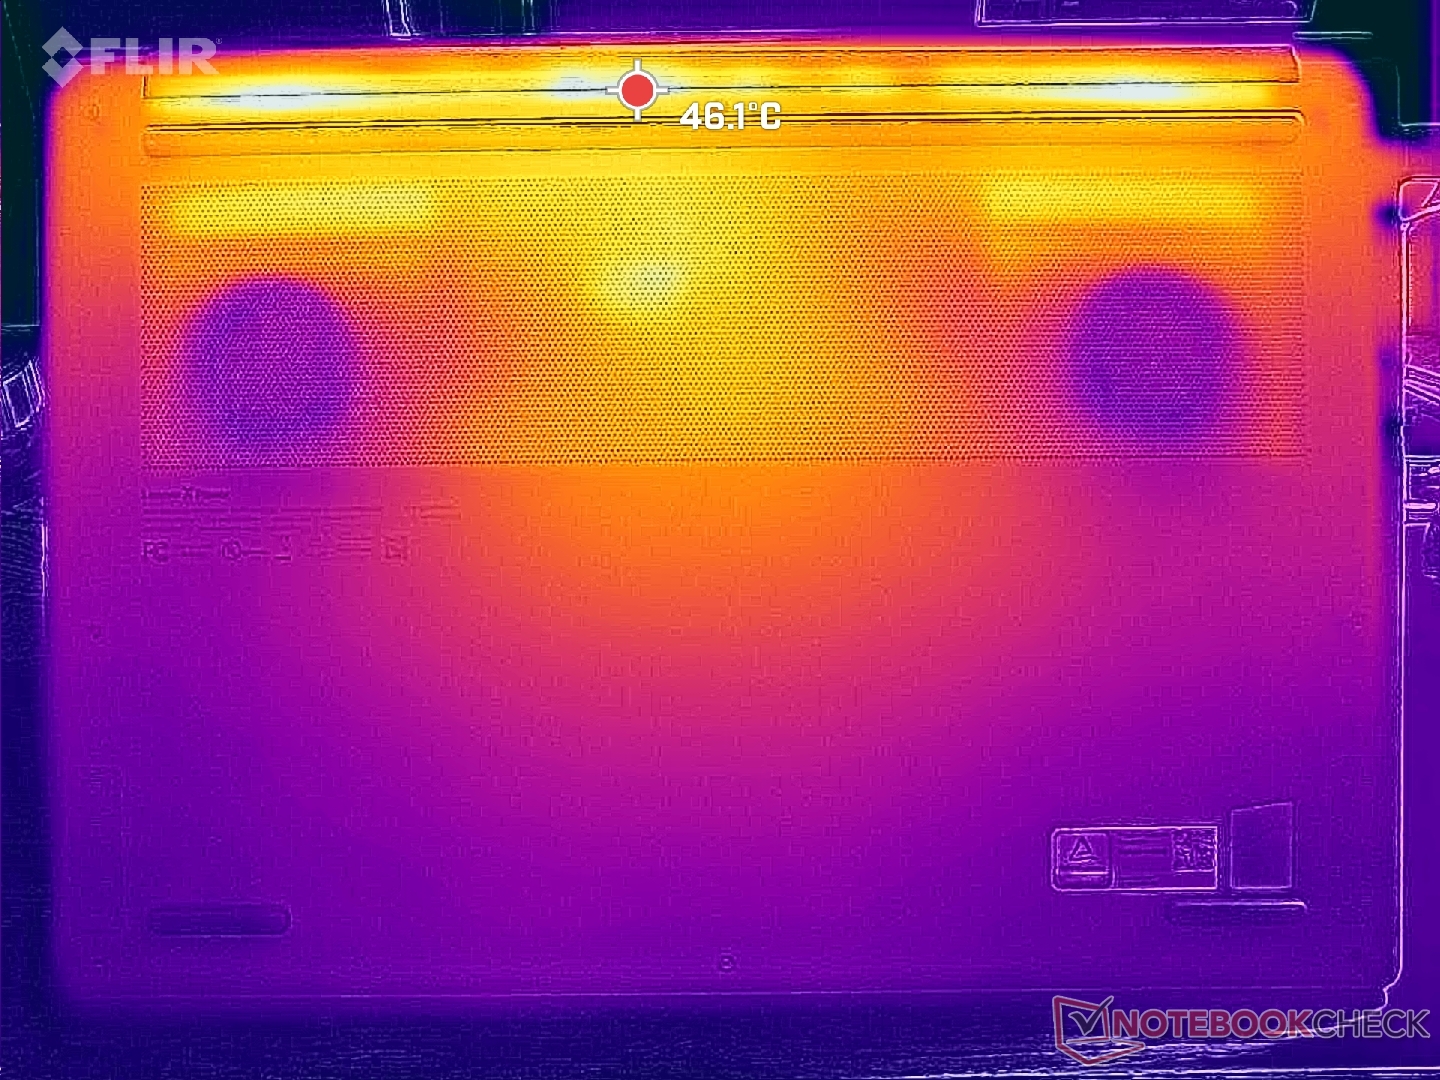
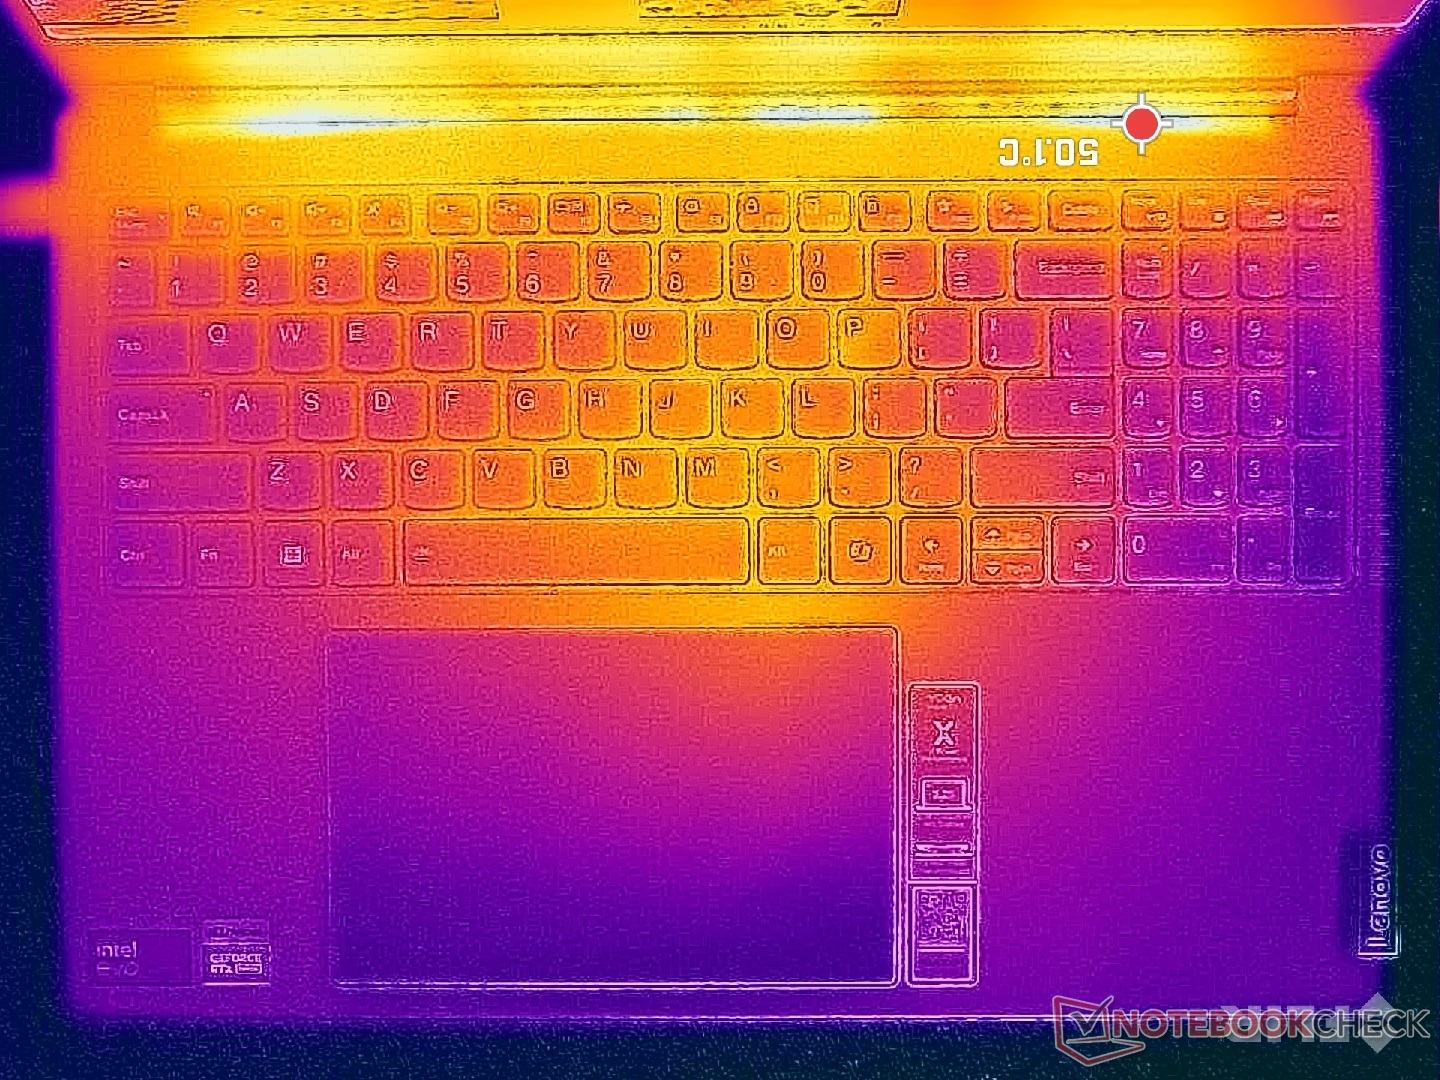
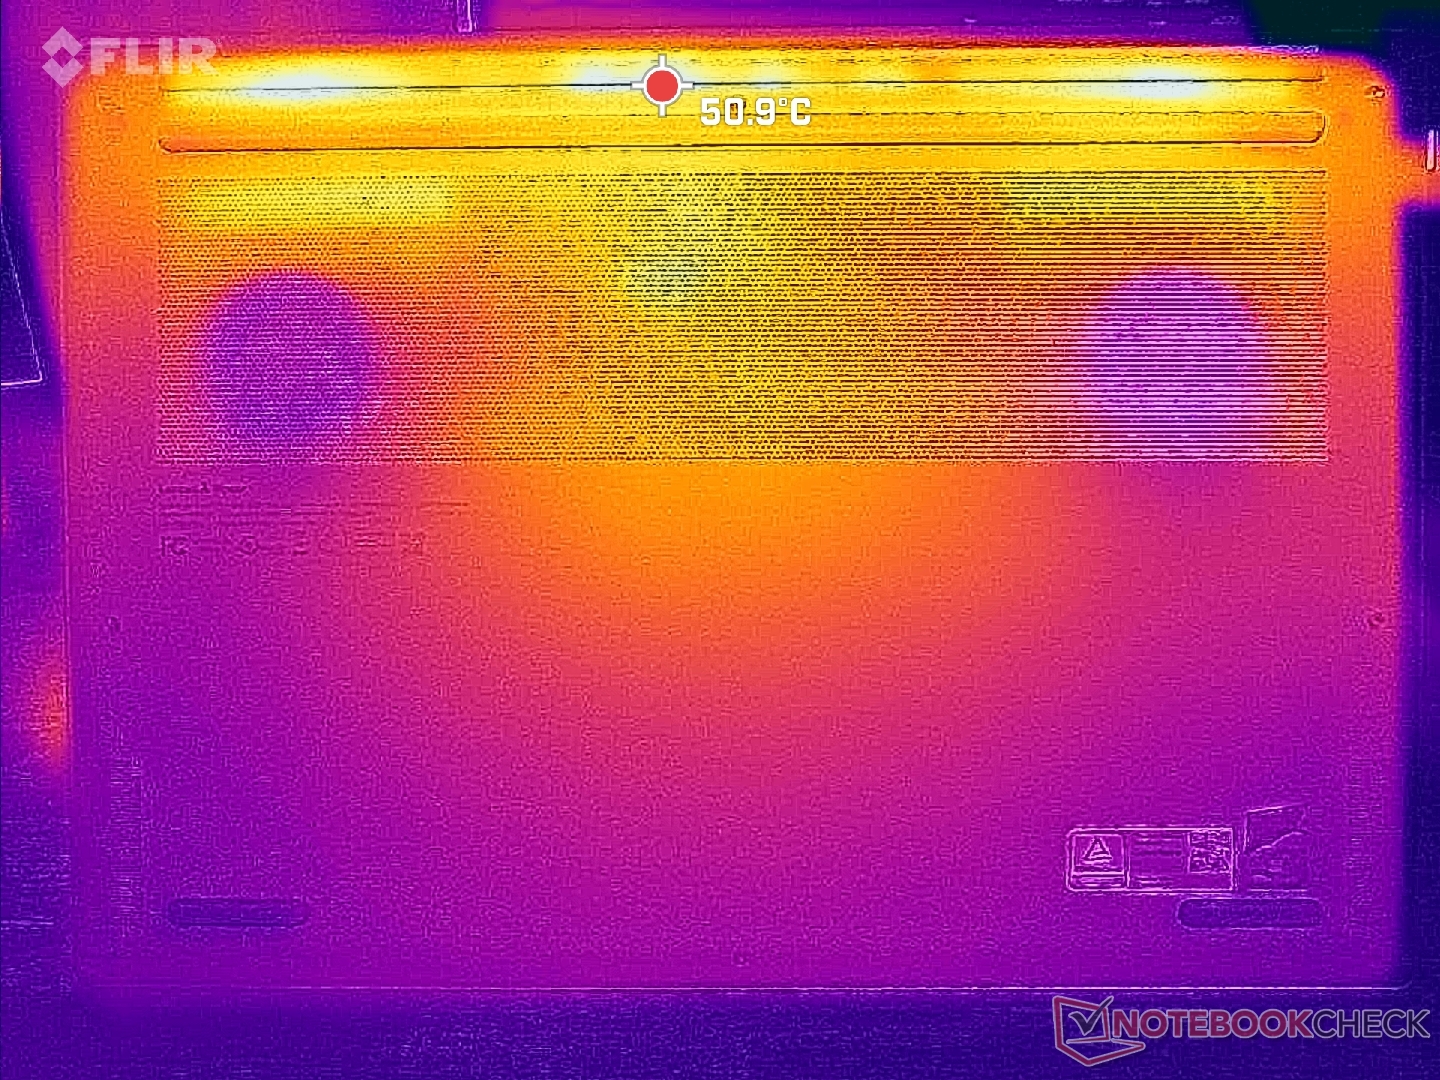
Temperatura
Los puntos calientes pueden alcanzar más de 41 C cuando se ejecutan cargas exigentes, lo que es varios grados más frío que lo que registramos en el Asus VivoBook Pro 16 con la misma GPU RTX 4050.
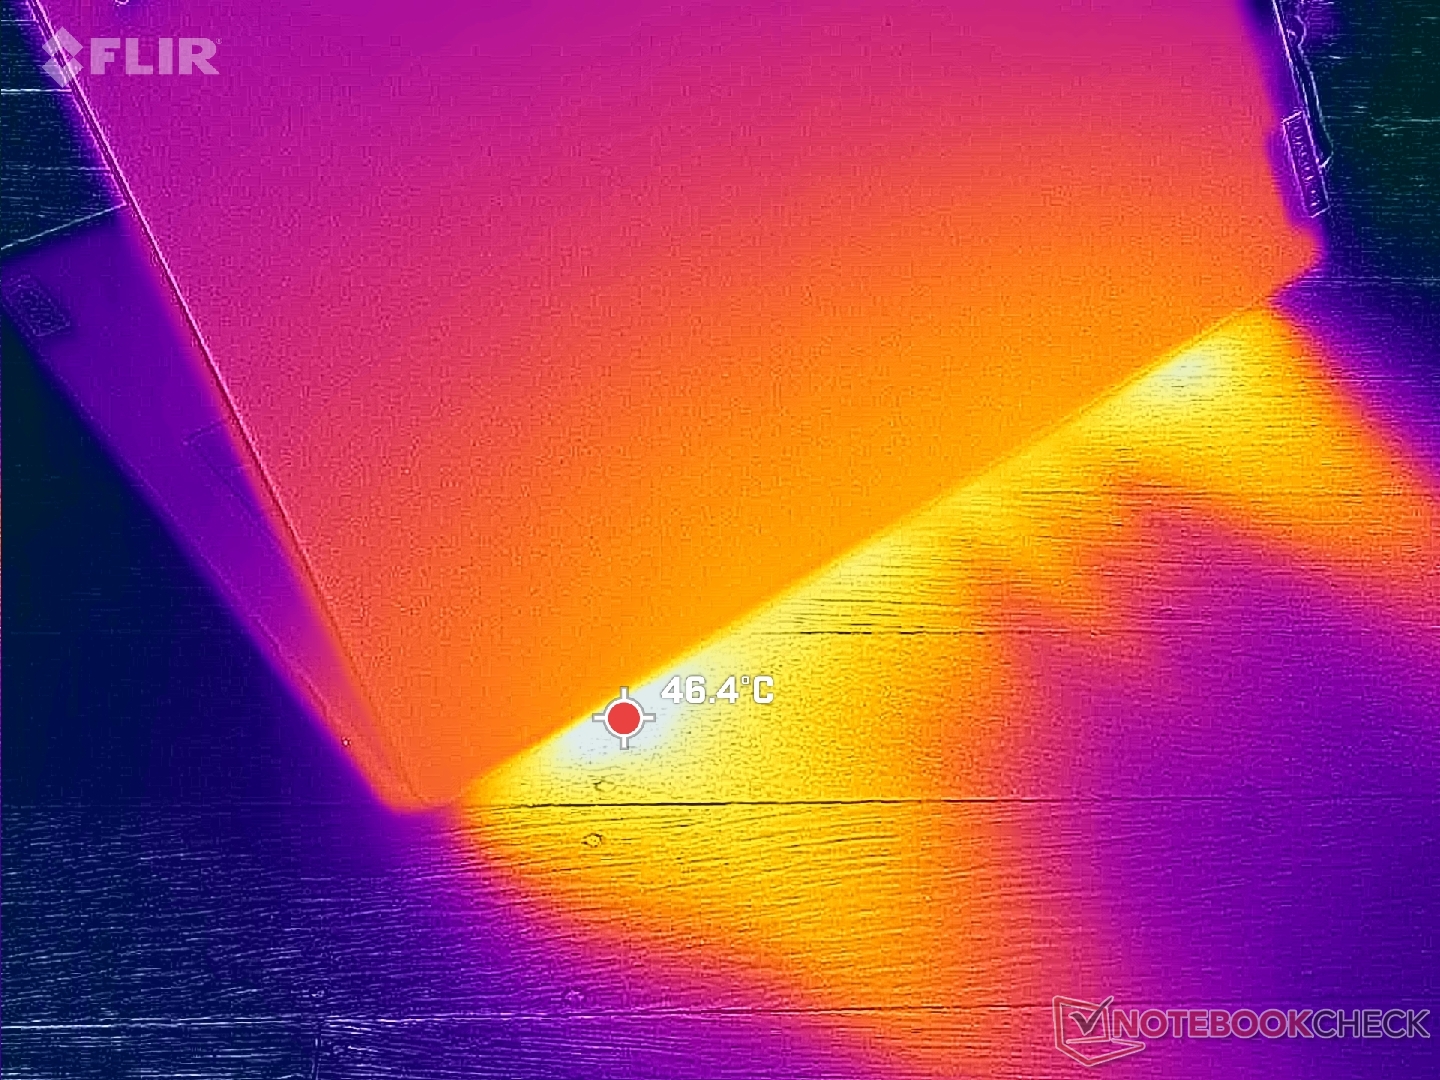
(±) La temperatura máxima en la parte superior es de 41 °C / 106 F, frente a la media de 40.4 °C / 105 F, que oscila entre 21.2 y 68.8 °C para la clase Gaming.
(±) El fondo se calienta hasta un máximo de 40.6 °C / 105 F, frente a la media de 43.2 °C / 110 F
(+) En reposo, la temperatura media de la parte superior es de 27.8 °C / 82# F, frente a la media del dispositivo de 33.9 °C / 93 F.
(±) Jugando a The Witcher 3, la temperatura media de la parte superior es de 33 °C / 91 F, frente a la media del dispositivo de 33.9 °C / 93 F.
(+) El reposamanos y el panel táctil están a una temperatura inferior a la de la piel, con un máximo de 29.6 °C / 85.3 F y, por tanto, son fríos al tacto.
(±) La temperatura media de la zona del reposamanos de dispositivos similares fue de 28.9 °C / 84 F (-0.7 °C / -1.3 F).
| Lenovo Yoga Pro 9 16IMH9 RTX 4050 Intel Core Ultra 9 185H, NVIDIA GeForce RTX 4050 Laptop GPU | Lenovo Yoga Pro 9 16IMH9 Intel Core Ultra 9 185H, NVIDIA GeForce RTX 4070 Laptop GPU | HP Envy x360 2-in-1 16-ad0097nr AMD Ryzen 7 8840HS, AMD Radeon 780M | Dell XPS 16 9640 Intel Core Ultra 7 155H, NVIDIA GeForce RTX 4070 Laptop GPU | Samsung Galaxy Book4 Ultra Intel Core Ultra 7 155H, NVIDIA GeForce RTX 4050 Laptop GPU | Asus VivoBook Pro 16 K6602VU Intel Core i9-13900H, NVIDIA GeForce RTX 4050 Laptop GPU | |
|---|---|---|---|---|---|---|
| Heat | 3% | -1% | 8% | 13% | -20% | |
| Maximum Upper Side * | 41 | 41.7 -2% | 42.6 -4% | 39.4 4% | 38.5 6% | 42.6 -4% |
| Maximum Bottom * | 40.6 | 46.3 -14% | 47.8 -18% | 36.9 9% | 41.2 -1% | 48.4 -19% |
| Idle Upper Side * | 30.2 | 26.2 13% | 27.4 9% | 28.2 7% | 23.5 22% | 39.4 -30% |
| Idle Bottom * | 31.4 | 27.2 13% | 27.8 11% | 27.4 13% | 24.1 23% | 39.8 -27% |
* ... más pequeño es mejor
Altavoces
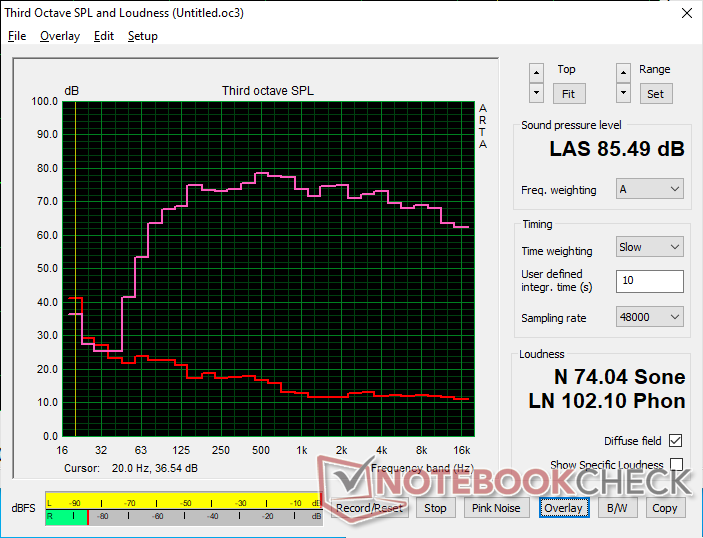
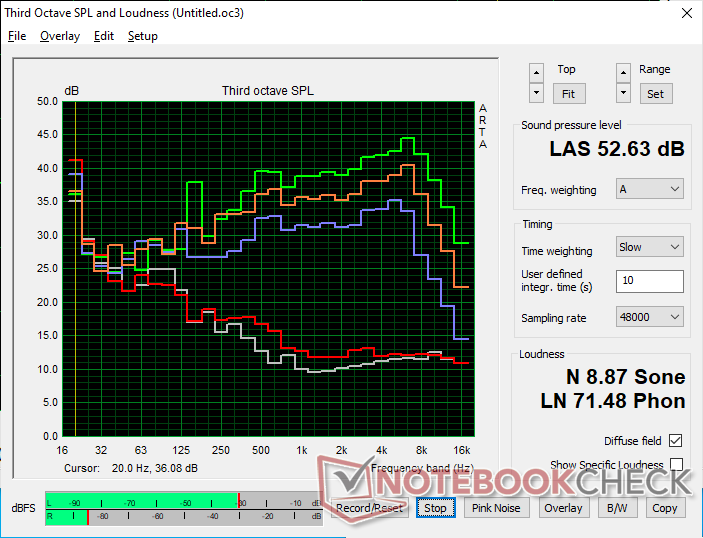
Lenovo Yoga Pro 9 16IMH9 RTX 4050 análisis de audio
(+) | los altavoces pueden reproducir a un volumen relativamente alto (#85.5 dB)
Graves 100 - 315 Hz
(+) | buen bajo - sólo 2.1% lejos de la mediana
(+) | el bajo es lineal (3.8% delta a la frecuencia anterior)
Medios 400 - 2000 Hz
(+) | medios equilibrados - a sólo 2.6% de la mediana
(+) | los medios son lineales (3.1% delta a la frecuencia anterior)
Altos 2 - 16 kHz
(+) | máximos equilibrados - a sólo 3.1% de la mediana
(+) | los máximos son lineales (3% delta a la frecuencia anterior)
Total 100 - 16.000 Hz
(+) | el sonido global es lineal (5.8% de diferencia con la mediana)
En comparación con la misma clase
» 0% de todos los dispositivos probados de esta clase eran mejores, 0% similares, 100% peores
» El mejor tuvo un delta de 6%, la media fue 18%, el peor fue ###max##%
En comparación con todos los dispositivos probados
» 0% de todos los dispositivos probados eran mejores, 0% similares, 100% peores
» El mejor tuvo un delta de 4%, la media fue 24%, el peor fue ###max##%
Apple MacBook Pro 16 2021 M1 Pro análisis de audio
(+) | los altavoces pueden reproducir a un volumen relativamente alto (#84.7 dB)
Graves 100 - 315 Hz
(+) | buen bajo - sólo 3.8% lejos de la mediana
(+) | el bajo es lineal (5.2% delta a la frecuencia anterior)
Medios 400 - 2000 Hz
(+) | medios equilibrados - a sólo 1.3% de la mediana
(+) | los medios son lineales (2.1% delta a la frecuencia anterior)
Altos 2 - 16 kHz
(+) | máximos equilibrados - a sólo 1.9% de la mediana
(+) | los máximos son lineales (2.7% delta a la frecuencia anterior)
Total 100 - 16.000 Hz
(+) | el sonido global es lineal (4.6% de diferencia con la mediana)
En comparación con la misma clase
» 0% de todos los dispositivos probados de esta clase eran mejores, 0% similares, 100% peores
» El mejor tuvo un delta de 5%, la media fue 18%, el peor fue ###max##%
En comparación con todos los dispositivos probados
» 0% de todos los dispositivos probados eran mejores, 0% similares, 100% peores
» El mejor tuvo un delta de 4%, la media fue 24%, el peor fue ###max##%
Gestión de la energía
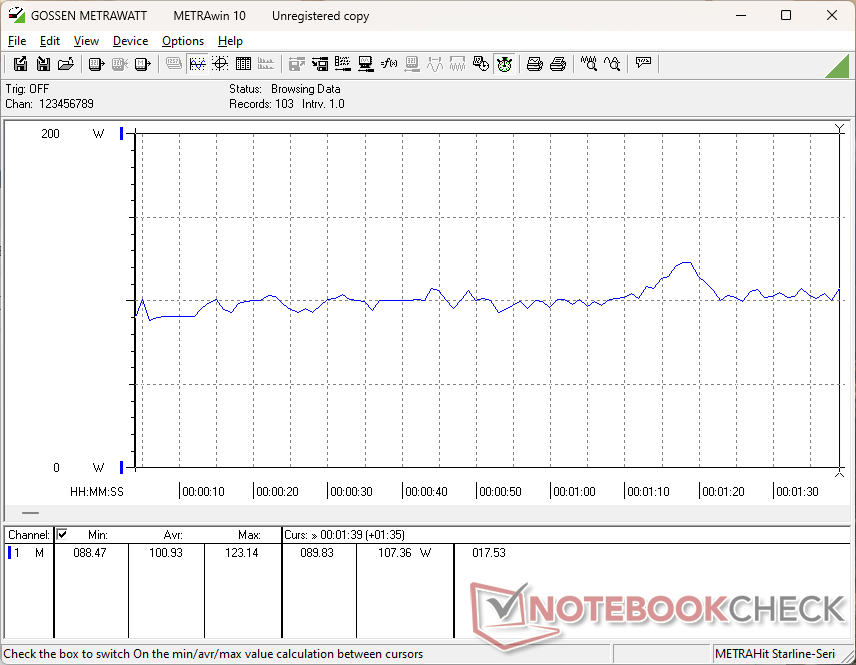
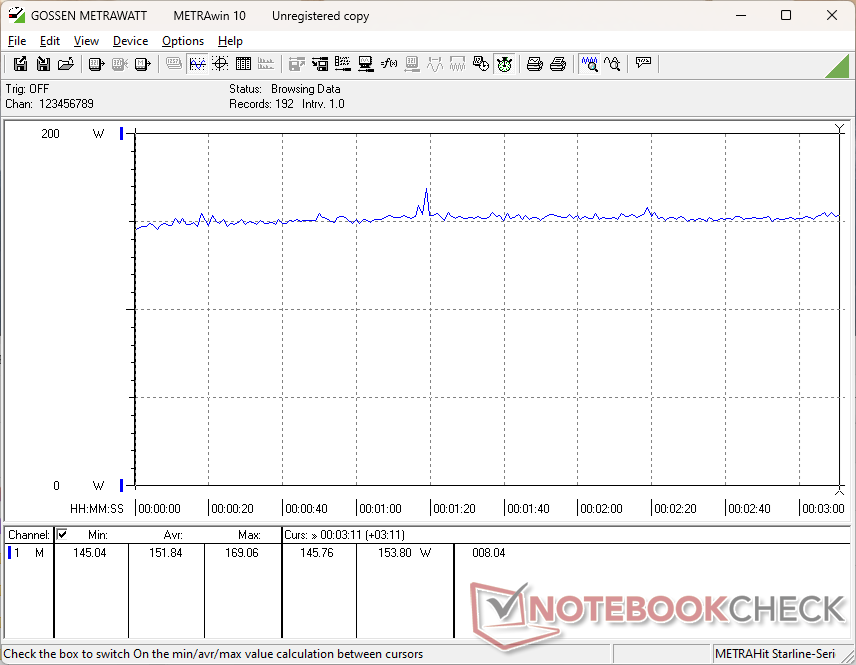
Consumo de energía
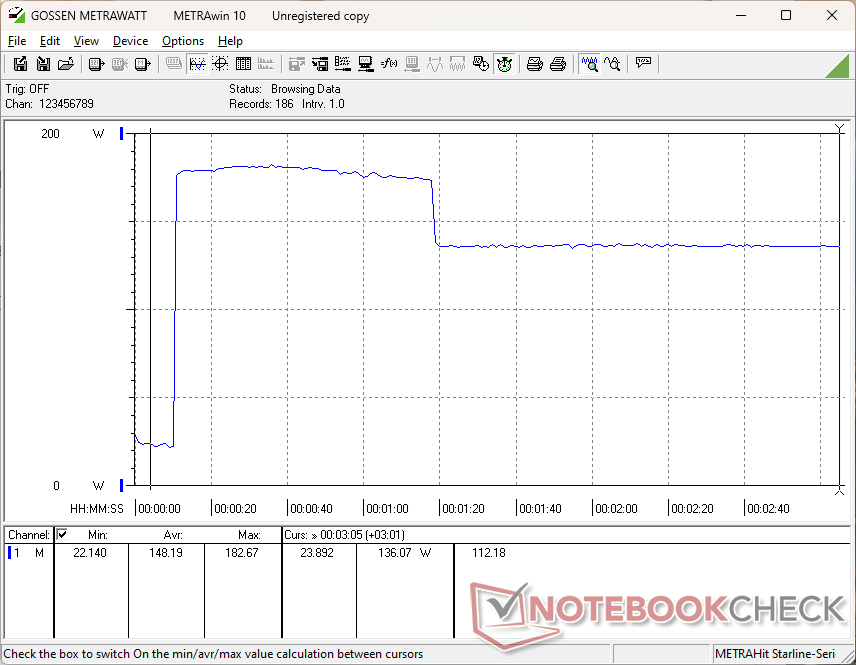
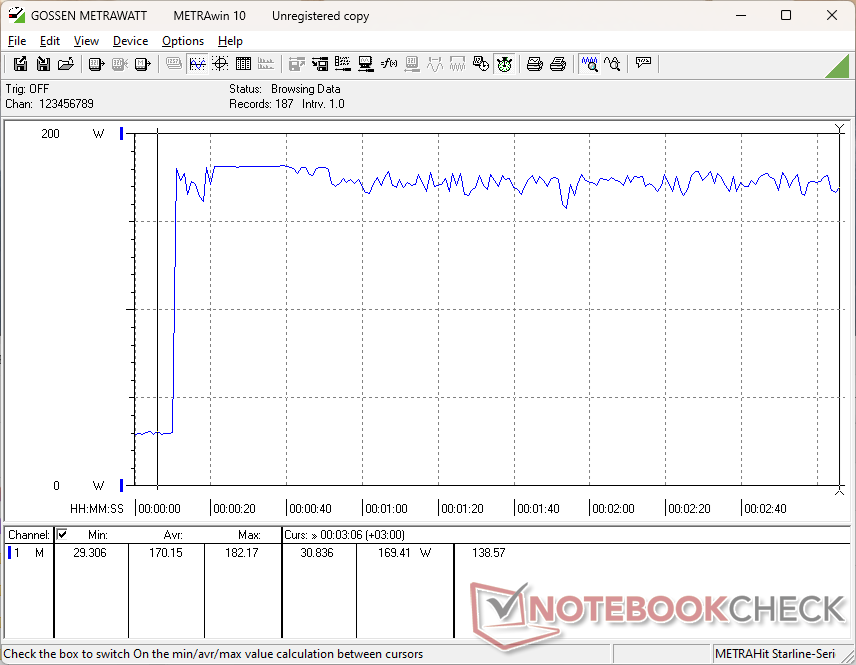
Los niveles generales de consumo son muy parecidos a los que registramos en la configuración de gama alta de la Mini-LED RTX 4070. Al ejecutar Witcher 3por ejemplo, nuestra configuración de gama baja consumiría sólo un 5 por ciento menos de media, a pesar de que supone un déficit de rendimiento gráfico de entre el 25 y el 30 por ciento frente a la RTX 4070. Por tanto, el rendimiento por vatio favorece bastante a la RTX 4070.
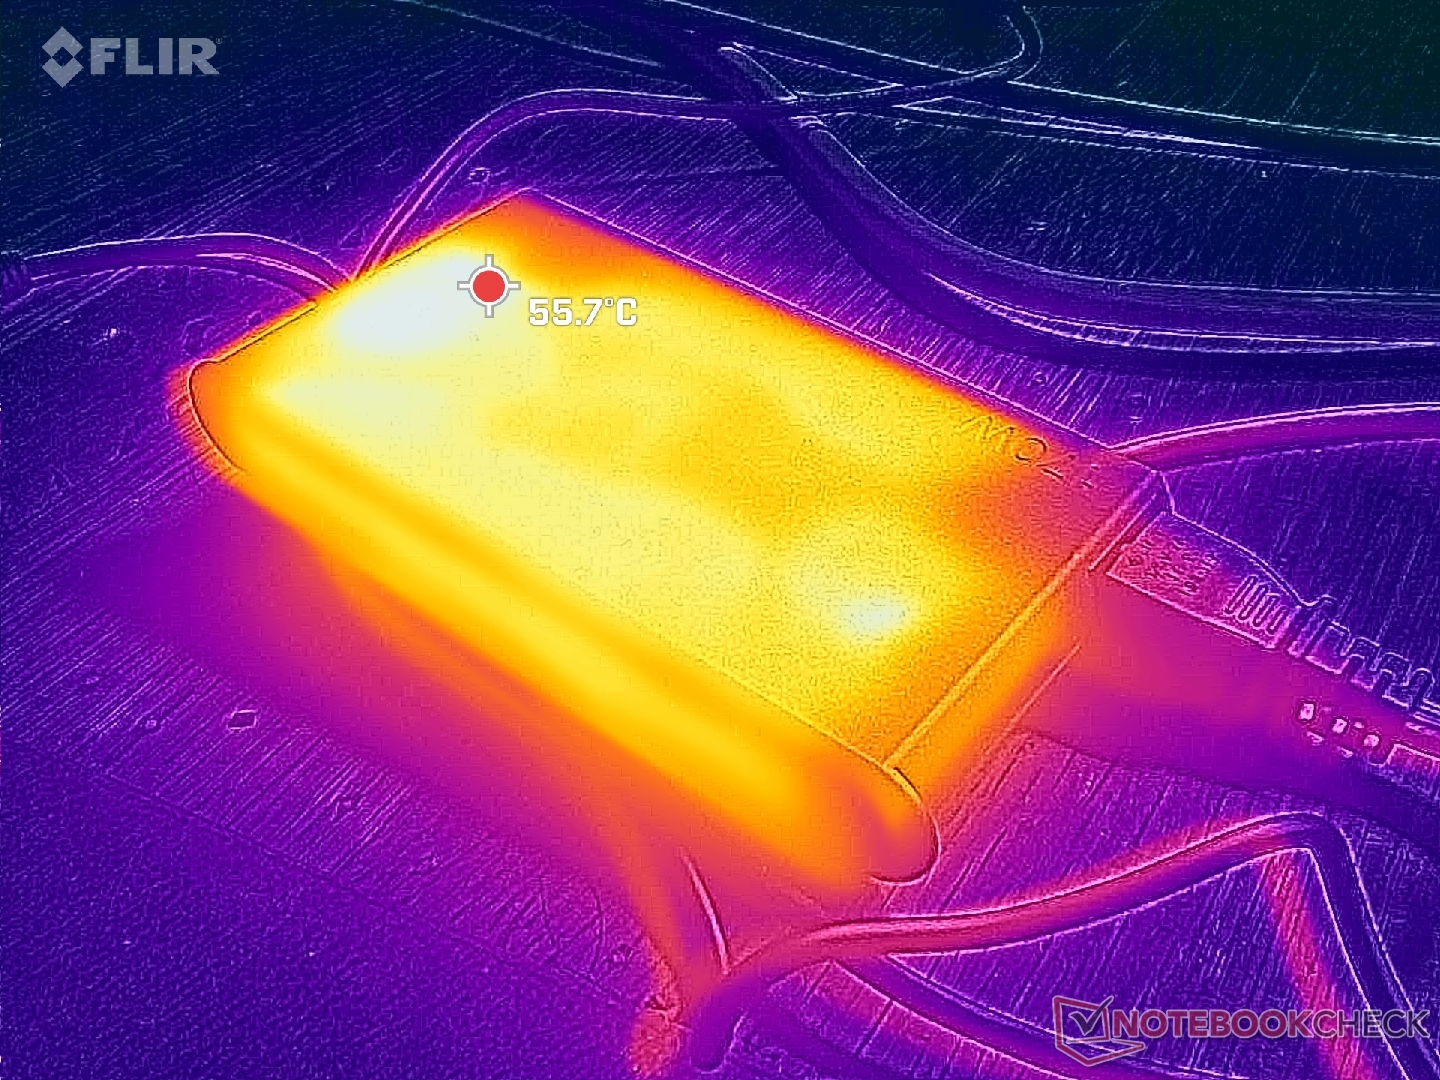
Los usuarios deben tener en cuenta que el adaptador de CA tiene una potencia nominal de sólo 170 W. Dado que los juegos ya exigen entre 150 W y 160 W, intentar cargar el portátil mientras se juega dará como resultado una velocidad de carga muy lenta.
| Off / Standby | |
| Ocioso | |
| Carga |
|
Clave:
min: | |
| Lenovo Yoga Pro 9 16IMH9 RTX 4050 Ultra 9 185H, NVIDIA GeForce RTX 4050 Laptop GPU, SK Hynix HFS001TEJ9X115N, IPS, 3200x2000, 16" | Lenovo Yoga Pro 9 16IMH9 Ultra 9 185H, NVIDIA GeForce RTX 4070 Laptop GPU, SK Hynix HFS001TEJ9X115N, Mini-LED, 3200x2000, 16" | HP Envy x360 2-in-1 16-ad0097nr R7 8840HS, Radeon 780M, KIOXIA BG5 KBG50ZNV1T02, OLED, 2880x1800, 16" | Dell XPS 16 9640 Ultra 7 155H, NVIDIA GeForce RTX 4070 Laptop GPU, Kioxia XG8 KXG80ZNV1T02, OLED, 3840x2400, 16.3" | Samsung Galaxy Book4 Ultra Ultra 7 155H, NVIDIA GeForce RTX 4050 Laptop GPU, Samsung PM9A1 MZVL2512HCJQ, OLED, 2880x1800, 16" | Asus VivoBook Pro 16 K6602VU i9-13900H, NVIDIA GeForce RTX 4050 Laptop GPU, Micron 2400 MTFDKBA1T0QFM, OLED, 3200x2000, 16" | |
|---|---|---|---|---|---|---|
| Power Consumption | -2% | 57% | 32% | 47% | -8% | |
| Idle Minimum * | 9.9 | 10.3 -4% | 5 49% | 7.7 22% | 4.8 52% | 21.06 -113% |
| Idle Average * | 16.6 | 21.9 -32% | 6.2 63% | 10.3 38% | 7.5 55% | 24.27 -46% |
| Idle Maximum * | 29.2 | 22.4 23% | 14.7 50% | 10.6 64% | 7.9 73% | 25.12 14% |
| Load Average * | 100.9 | 96.9 4% | 49.9 51% | 76.5 24% | 79.3 21% | 52.4 48% |
| Witcher 3 ultra * | 151.8 | 159.6 -5% | 54.5 64% | 126.4 17% | 79.2 48% | 110.2 27% |
| Load Maximum * | 182.2 | 173.8 5% | 65 64% | 138.5 24% | 125 31% | 146 20% |
* ... más pequeño es mejor
Power Consumption Witcher 3 / Stresstest
Power Consumption external Monitor
Duración de las pilas
La autonomía en los modos Equilibrado y Optimus con la pantalla ajustada a 150 nits duraría más o menos lo mismo que la configuración Mini-LED de la RTX 4070, más cara. Los resultados son un poco sorprendentes a primera vista, ya que la mini-LED y la GPU RTX 4070 pueden exigir más energía que la IPS y la RTX 4050, pero los datos tienen sentido una vez que se tiene en cuenta el modo Optimus y los ajustes de brillo similares durante las pruebas. El tiempo de navegación de 9 horas sigue siendo muy bueno para un portátil multimedia de 16 pulgadas con gráficos discretos, incluso si es un poco más corto que el de competidores como el Dell XPS 16 o el Samsung Galaxy Book4 Ultra.
| Lenovo Yoga Pro 9 16IMH9 RTX 4050 Ultra 9 185H, NVIDIA GeForce RTX 4050 Laptop GPU, 84 Wh | Lenovo Yoga Pro 9 16IMH9 Ultra 9 185H, NVIDIA GeForce RTX 4070 Laptop GPU, 84 Wh | HP Envy x360 2-in-1 16-ad0097nr R7 8840HS, Radeon 780M, 68 Wh | Dell XPS 16 9640 Ultra 7 155H, NVIDIA GeForce RTX 4070 Laptop GPU, 99.5 Wh | Samsung Galaxy Book4 Ultra Ultra 7 155H, NVIDIA GeForce RTX 4050 Laptop GPU, 76 Wh | Asus VivoBook Pro 16 K6602VU i9-13900H, NVIDIA GeForce RTX 4050 Laptop GPU, 96 Wh | |
|---|---|---|---|---|---|---|
| Duración de Batería | -3% | -15% | 16% | 21% | 12% | |
| WiFi v1.3 | 540 | 526 -3% | 459 -15% | 629 16% | 656 21% | 606 12% |
| H.264 | 692 | 988 | 1076 | 585 | ||
| Load | 73 | 116 | 87 | 78 | ||
| Reader / Idle | 935 |
Pro
Contra
Veredicto - Uno de los mejores de Lenovo si está dispuesto a pagar
El Yoga Pro 9 16IMH9 es el modelo más impresionante de la serie hasta el momento, incluso en la configuración de gama baja sin gráficos RTX 4070 ni la extravagante pantalla mini-LED para ser una alternativa real al XPS 16 o MacBook Pro 16. Su pantalla IPS, rendimiento y tamaño son competitivos frente a los equivalentes de Dell o Apple a la vez que son más fáciles de mantener y con un teclado posiblemente mejor que el XPS. También podemos apreciar su mayor variedad de puertos, mientras que los dos modelos de la competencia sólo tienen USB-C.
Otros factores como la duración de la batería y el ruido del ventilador no son notablemente más largos o silenciosos, respectivamente, que la configuración RTX 4070 de gama alta.
El Lenovo Yoga Pro 9 16IMH9 preparado para IA no es solo una gran alternativa al Dell XPS 16 o al MacBook Pro 16, sino que también hace algunas cosas mejor que ambos.
El precio de venta al público de 1.700 dólares para la configuración RTX 4050 es un poco elevado, ya que los portátiles para juegos con la misma GPU como el MSI Thin GF63 o el Acer Nitro V se pueden encontrar por menos de 1000 dólares cada uno. Sin embargo, cuando se compara con el XPS 16 o el MacBook Pro 15 de la competencia, el Lenovo es varios cientos de dólares más barato para ser una solución atractiva para aquellos que buscan ahorrar algo de dinero conservando la experiencia de usuario premium.
Precio y disponibilidad
Best Buy está enviando actualmente el Lenovo Yoga Pro 9 16 configuración como revisado por $ 1700.
Lenovo Yoga Pro 9 16IMH9 RTX 4050
- 06/06/2024 v7 (old)
Allen Ngo
Transparencia
La selección de los dispositivos que se van a reseñar corre a cargo de nuestro equipo editorial. La muestra de prueba fue proporcionada al autor en calidad de préstamo por el fabricante o el minorista a los efectos de esta reseña. El prestamista no tuvo ninguna influencia en esta reseña, ni el fabricante recibió una copia de la misma antes de su publicación. No había ninguna obligación de publicar esta reseña. Nunca aceptamos compensaciones o pagos a cambio de nuestras reseñas. Como empresa de medios independiente, Notebookcheck no está sujeta a la autoridad de fabricantes, minoristas o editores.
Así es como prueba Notebookcheck
Cada año, Notebookcheck revisa de forma independiente cientos de portátiles y smartphones utilizando procedimientos estandarizados para asegurar que todos los resultados son comparables. Hemos desarrollado continuamente nuestros métodos de prueba durante unos 20 años y hemos establecido los estándares de la industria en el proceso. En nuestros laboratorios de pruebas, técnicos y editores experimentados utilizan equipos de medición de alta calidad. Estas pruebas implican un proceso de validación en varias fases. Nuestro complejo sistema de clasificación se basa en cientos de mediciones y puntos de referencia bien fundamentados, lo que mantiene la objetividad.Price comparison

