

Reseña del mini PC Beelink GTI12 Ultra EX Docking Station: Más asequible de lo esperado

Una de las principales quejas sobre los mini PC de Beelink hasta ahora es que todos vienen únicamente con gráficos integrados. Aunque la última serie GTI Ultra no aborda directamente esta cuestión, sigue siendo la primera incursión de Beelink en la compatibilidad oficial con eGPU a través de la EX Docking Station para atraer a usuarios avanzados o jugadores.
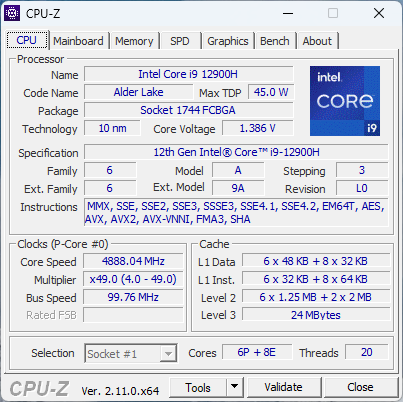
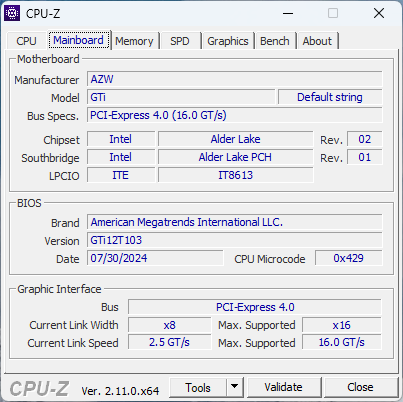
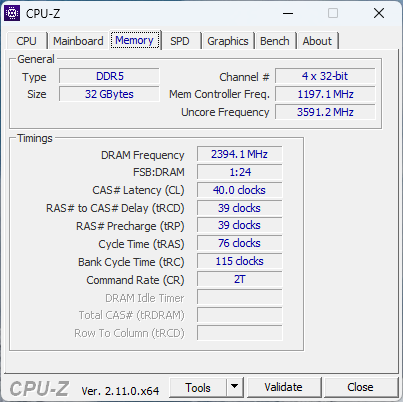
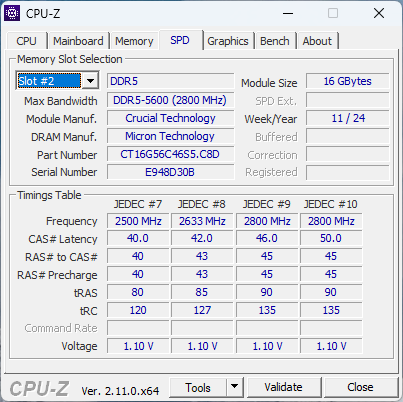
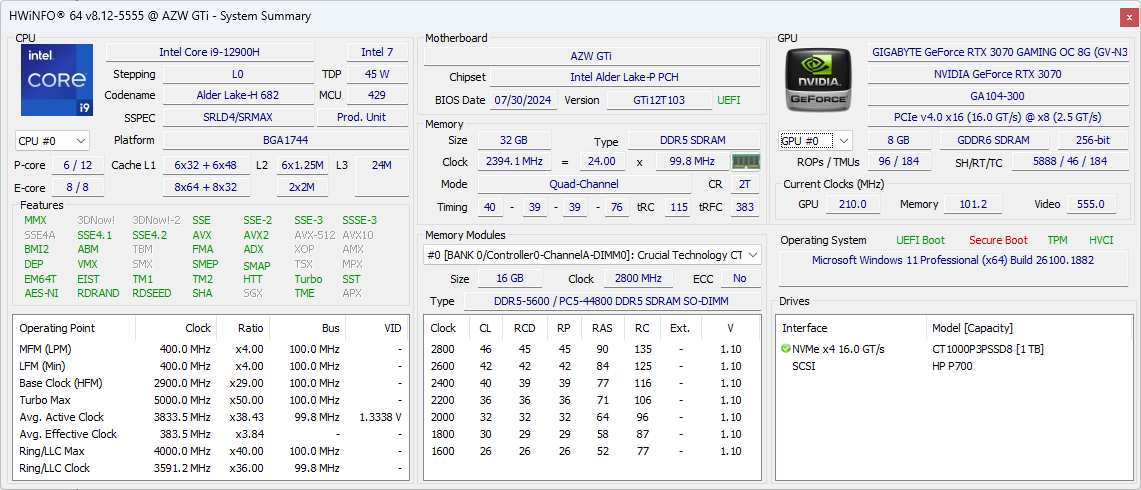
Nuestra unidad de prueba es el GTI12 Ultra equipado con el Core i9-12900H, 1 TB SSD, y 32 GB DDR5-5600 RAM por aproximadamente $740 USD cuando se empareja con la EX Docking Station. CPUs Meteor Lake más recientes están disponibles bajo el nombre de modelo GTI14 Ultra que es visualmente idéntico al GTI12 Ultra.
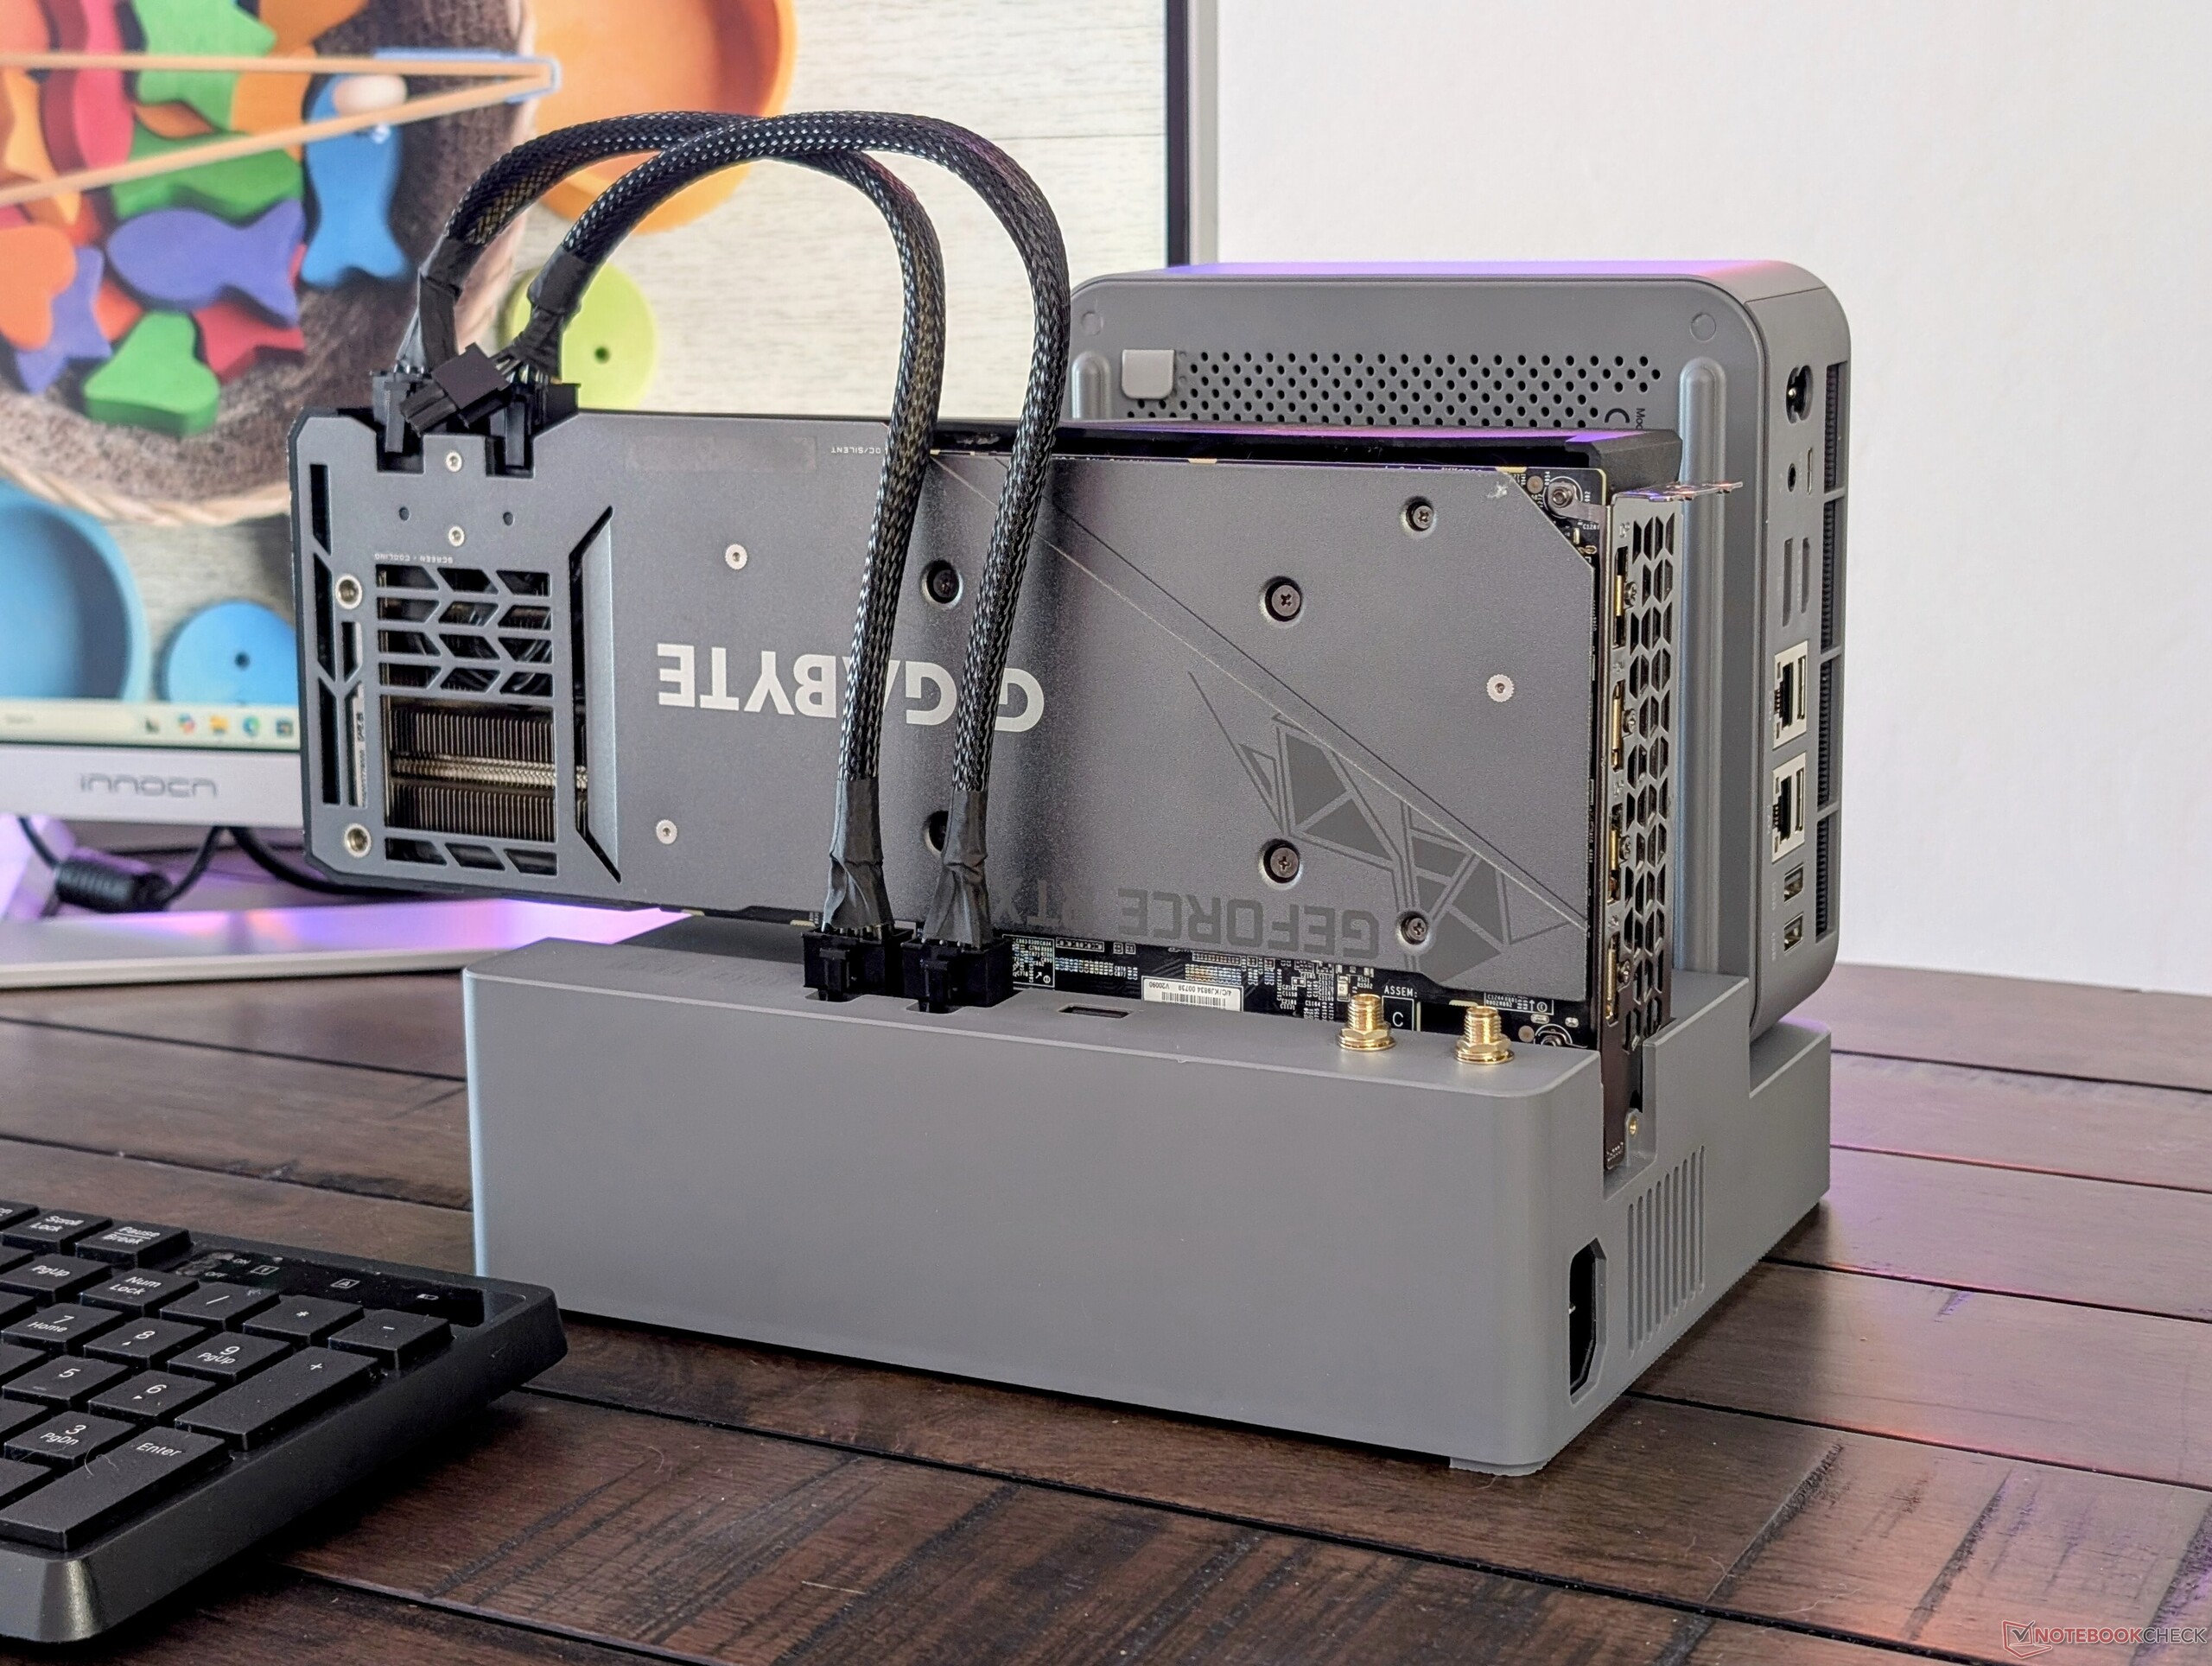
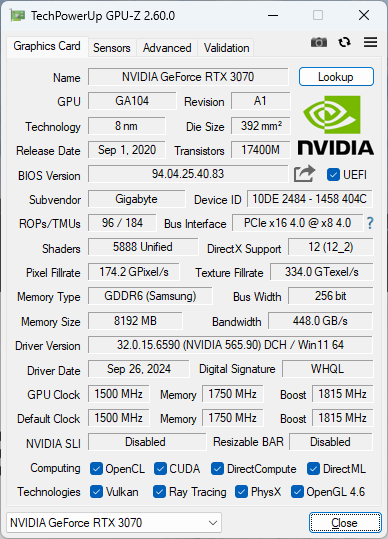
Hemos adquirido una GPU Gigabyte GeForce RTX 3070 personal para probar la EX Docking Station, pero la propia base puede admitir GPU de hasta la RTX 4090 a 600 W como máximo.
Más reseñas de Beelink:
Posibles contendientes en la comparación
Valoración | Versión | Fecha | Modelo | Peso | Altura | Tamaño | Resolución | Precio |
|---|---|---|---|---|---|---|---|---|
| 76.5 % | v8 | 10/2024 | Beelink GTI12 Ultra EX Docking Station i9-12900H, NVIDIA GeForce RTX 3070 | 1.3 kg | 55.8 mm | x | ||
| 76.7 % | v8 | 10/2024 | Minisforum MS-A1 Ryzen 7 8700G, Radeon 780M | 1.7 kg | 48 mm | x | ||
| 67.3 % | v8 | 09/2024 | GMK NucBox K9 Ultra 5 125H, Arc 7-Core | 528 g | 47 mm | x | ||
| 74.7 % | v8 | 08/2024 | Asus NUC 14 Pro Ultra 5 125H, Arc 7-Core | 525 g | 37 mm | x | ||
| 78.4 % | v8 | 08/2024 | Geekom AX8 Pro R9 8945HS, Radeon 780M | 548 g | 37 mm | x | ||
| 86 % | v8 | 08/2024 | Asus ROG NUC 14-90AS0051 Ultra 9 185H, NVIDIA GeForce RTX 4070 Laptop GPU | 2.6 kg | 50 mm | x |
Caso
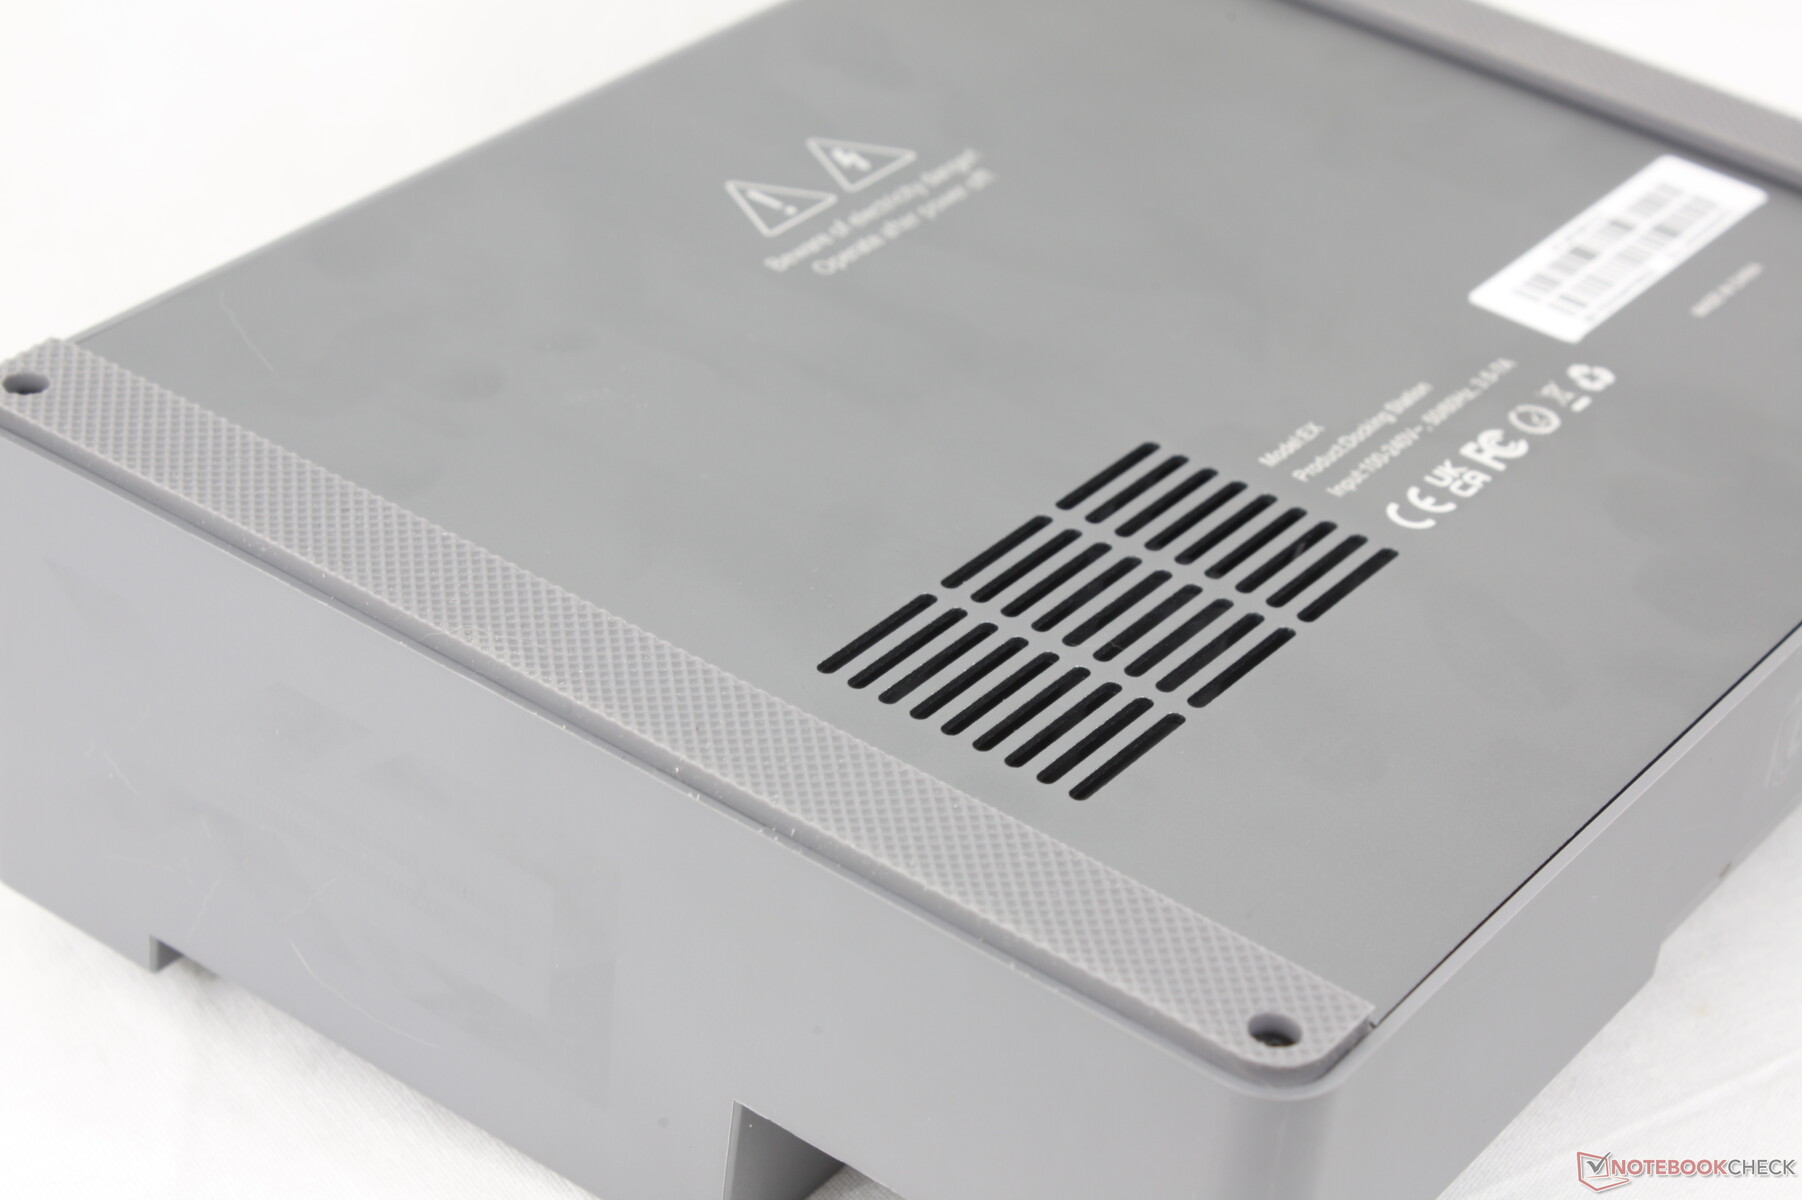
El GTI12 Ultra es esencialmente un SER8 utilizando los mismos materiales de chasis metálico, fondo de plástico y acabado mate liso. Internamente, sin embargo, los dos modelos son muy diferentes ya que el GTI12 Ultra integra una fuente de alimentación de 145 W en lugar de depender de un ladrillo de alimentación externo. También integra dos altavoces para ser uno de los pocos mini PC con audio integrado y una fuente de alimentación.
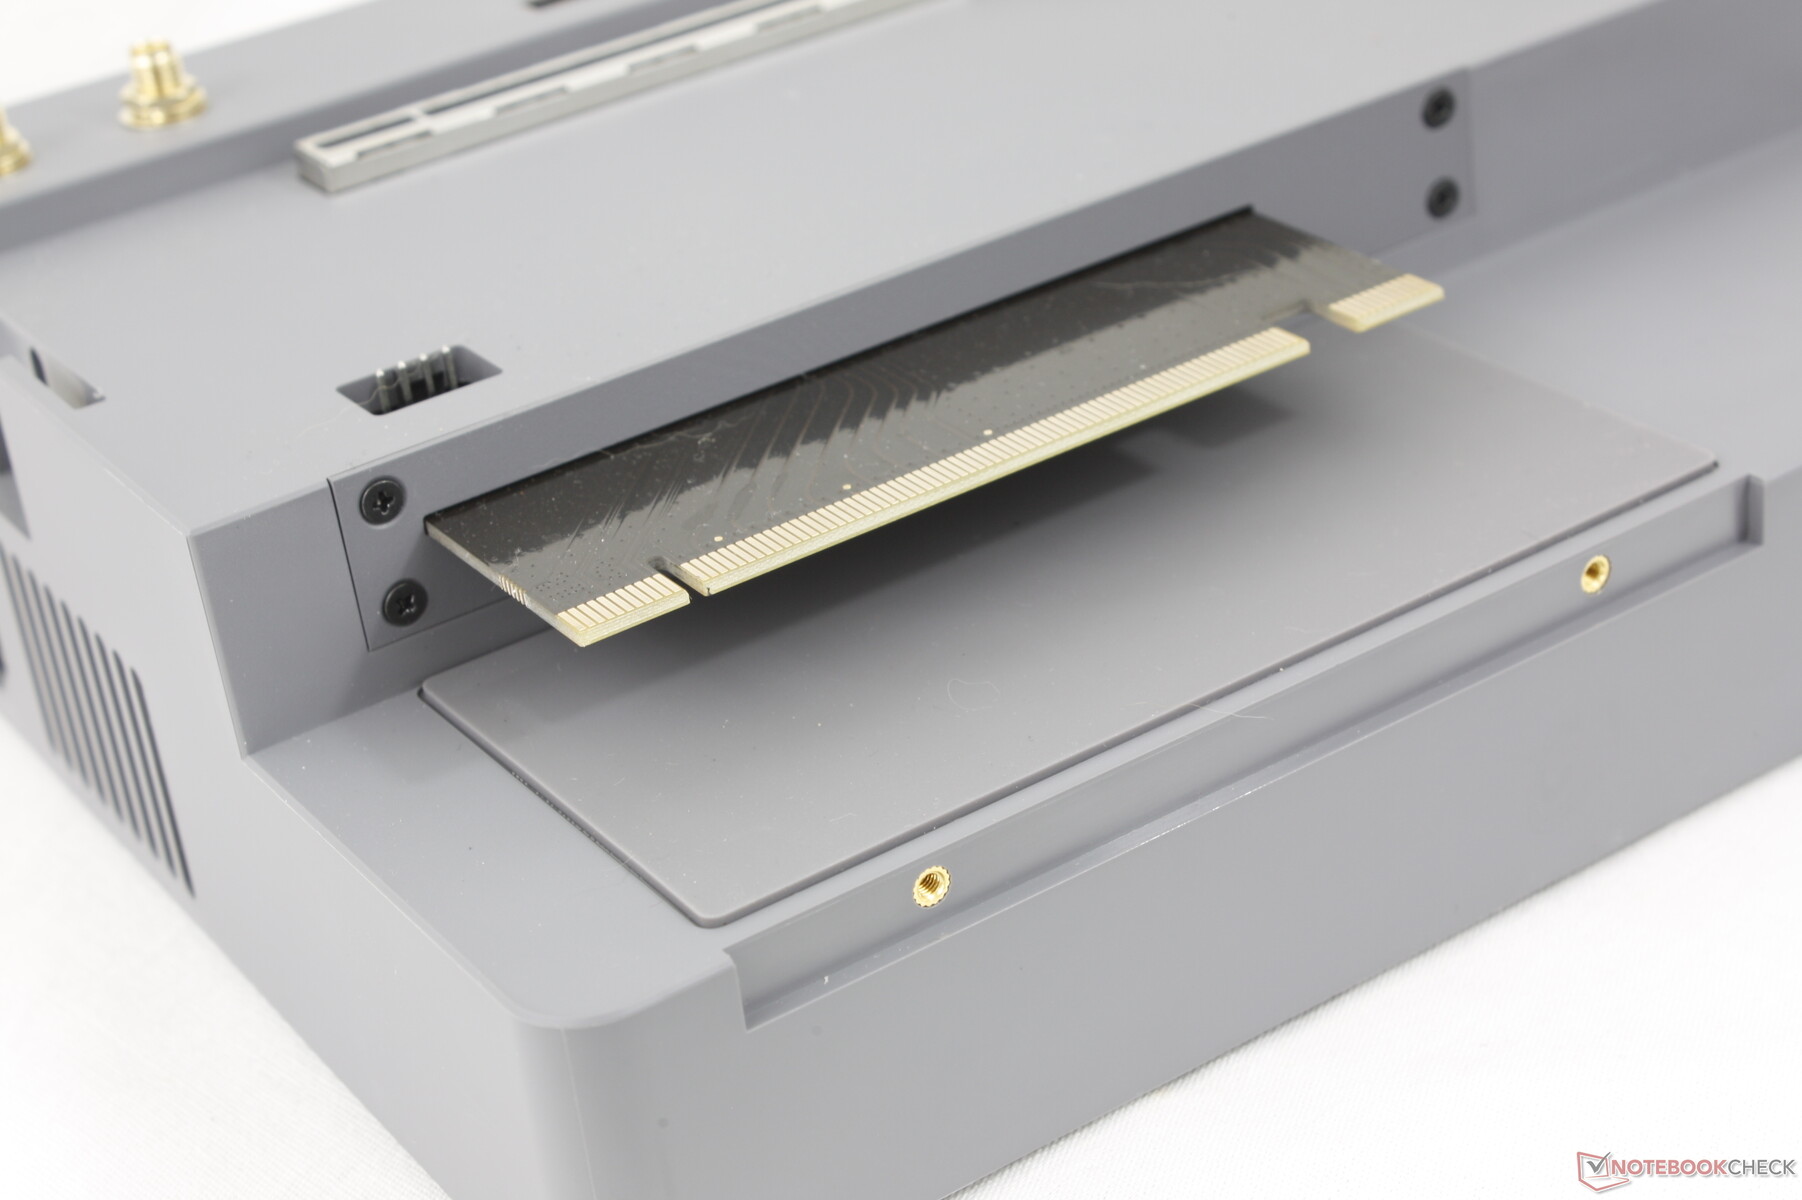
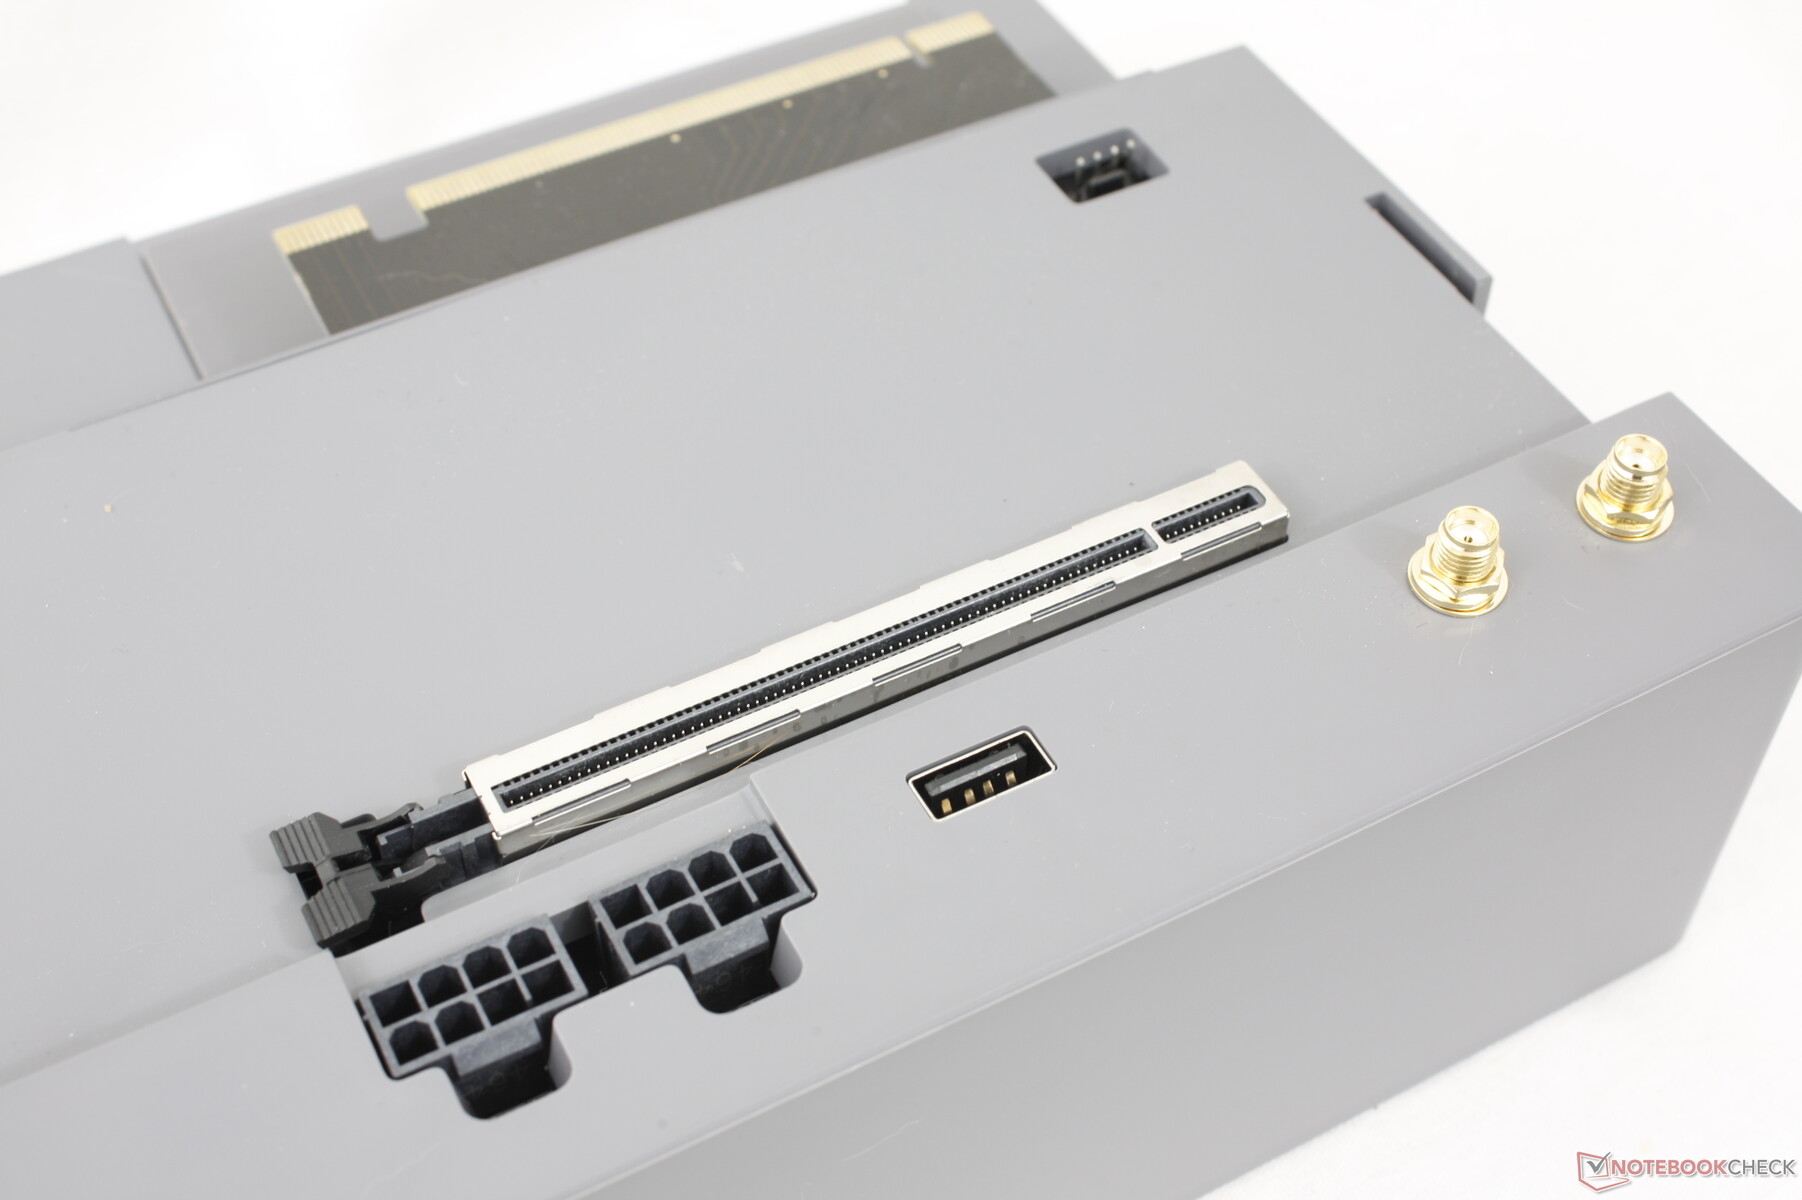
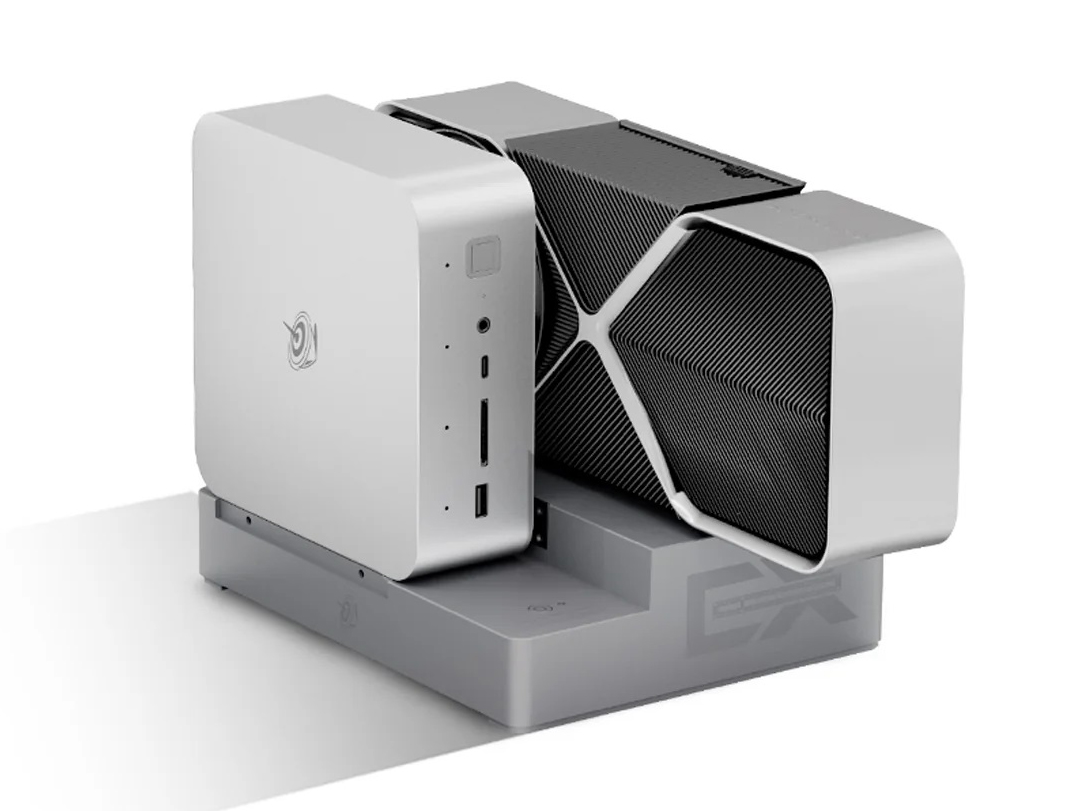
Otra característica exclusiva es la ranura PCI x8 en la parte inferior de la unidad para acoplarla a la base de conexión EX, como muestra la imagen inferior. Apreciamos que el conector no sea propietario a diferencia de lo que ocurre con el Asus ROG XG Mobile.
La unidad es significativamente más grande y pesada que la mayoría de los otros mini PC con gráficos integrados debido a las características únicas mencionadas anteriormente.
| Mini PC | Estación de acoplamiento EX | Mini PC + Estación de acoplamiento EX |
| 1316 g | 1419 g | 2735 g |

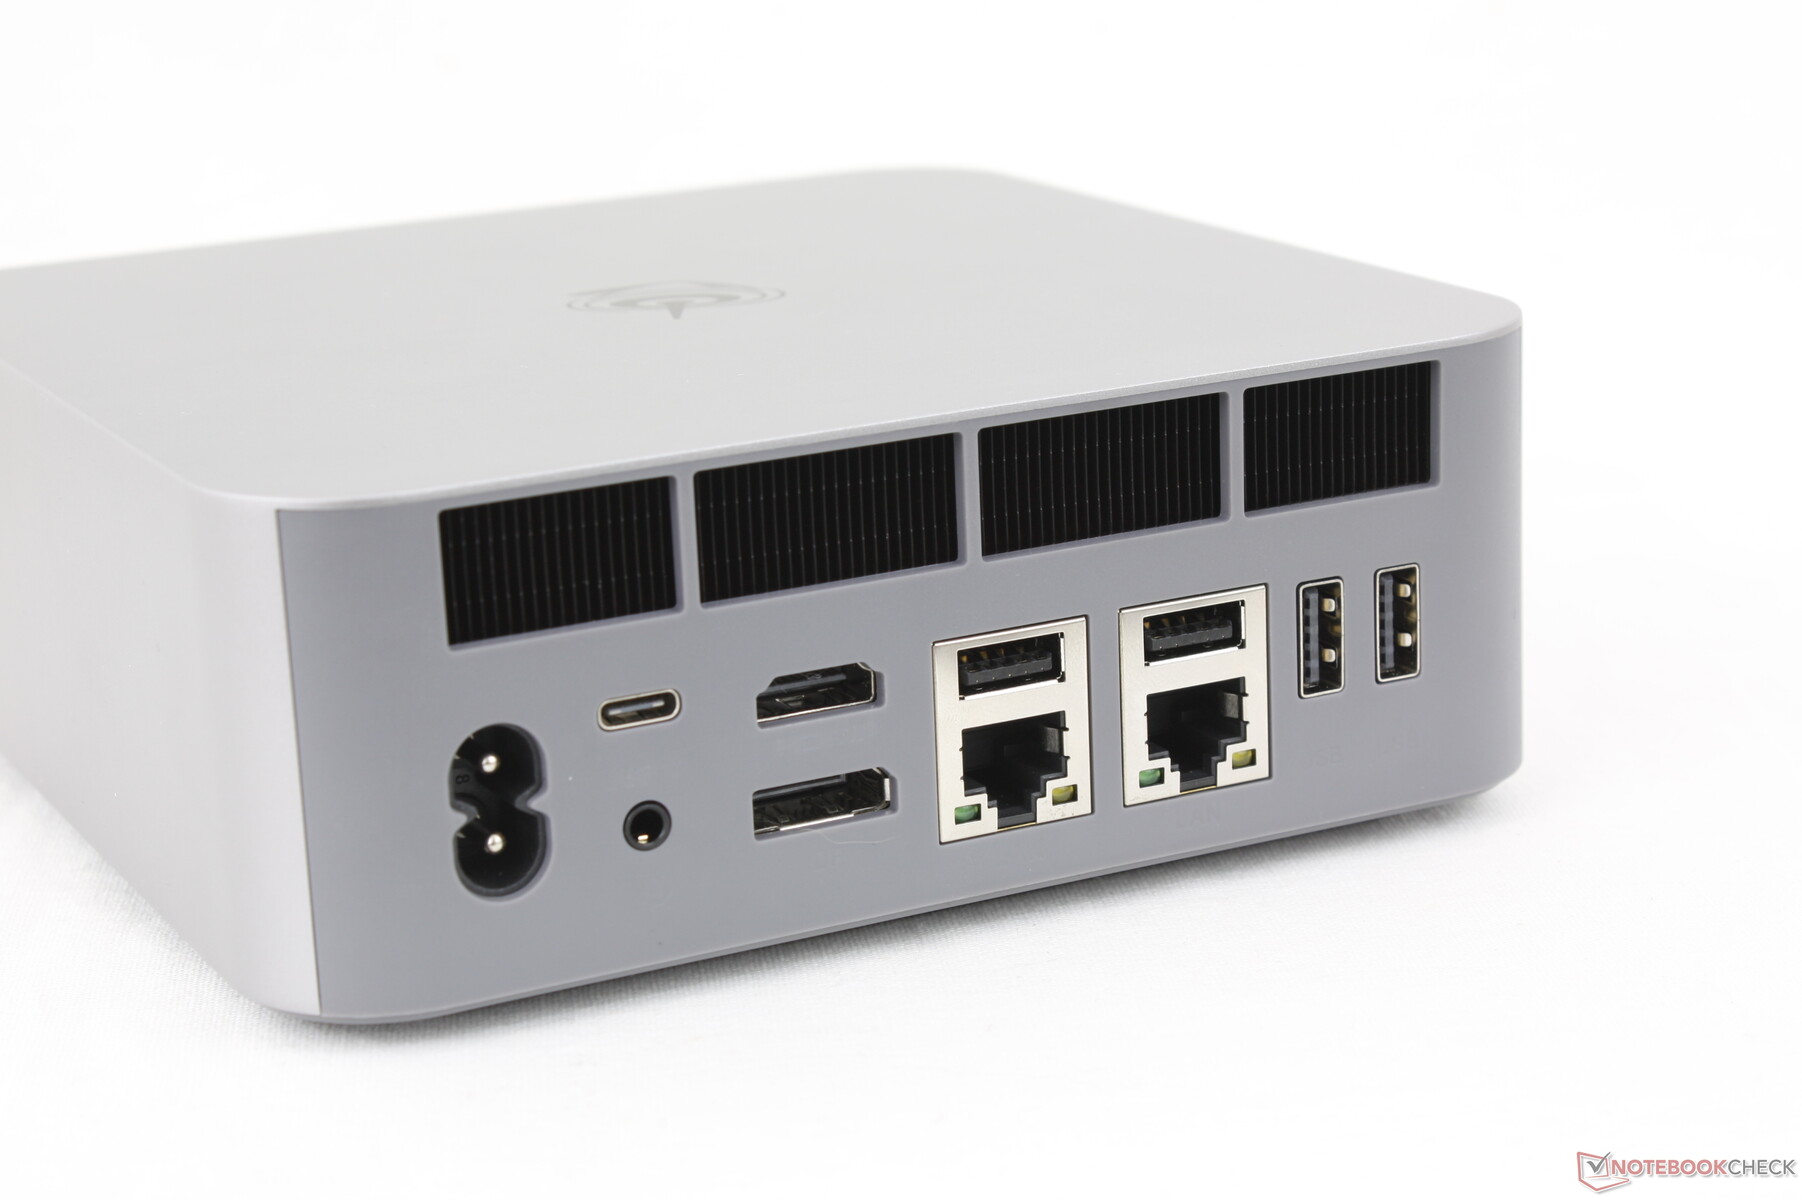
Conectividad
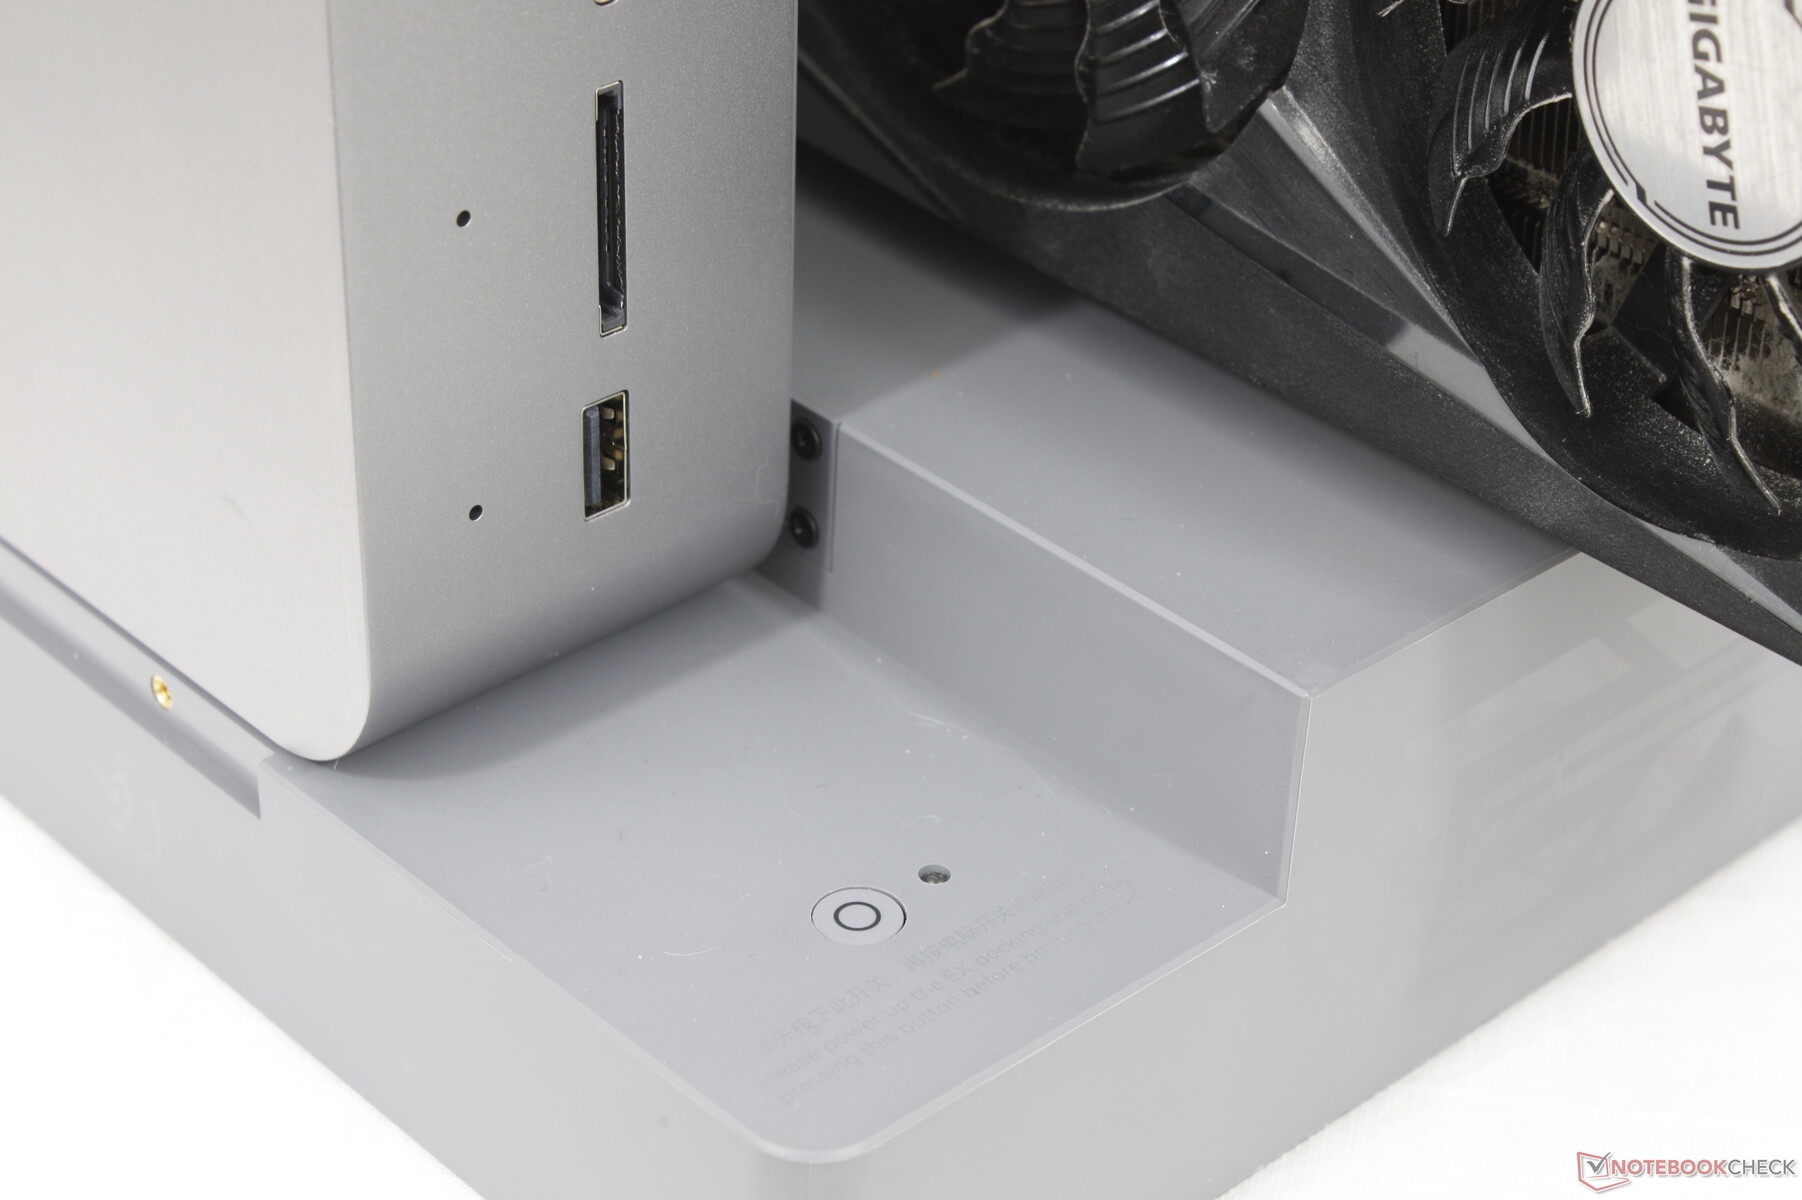
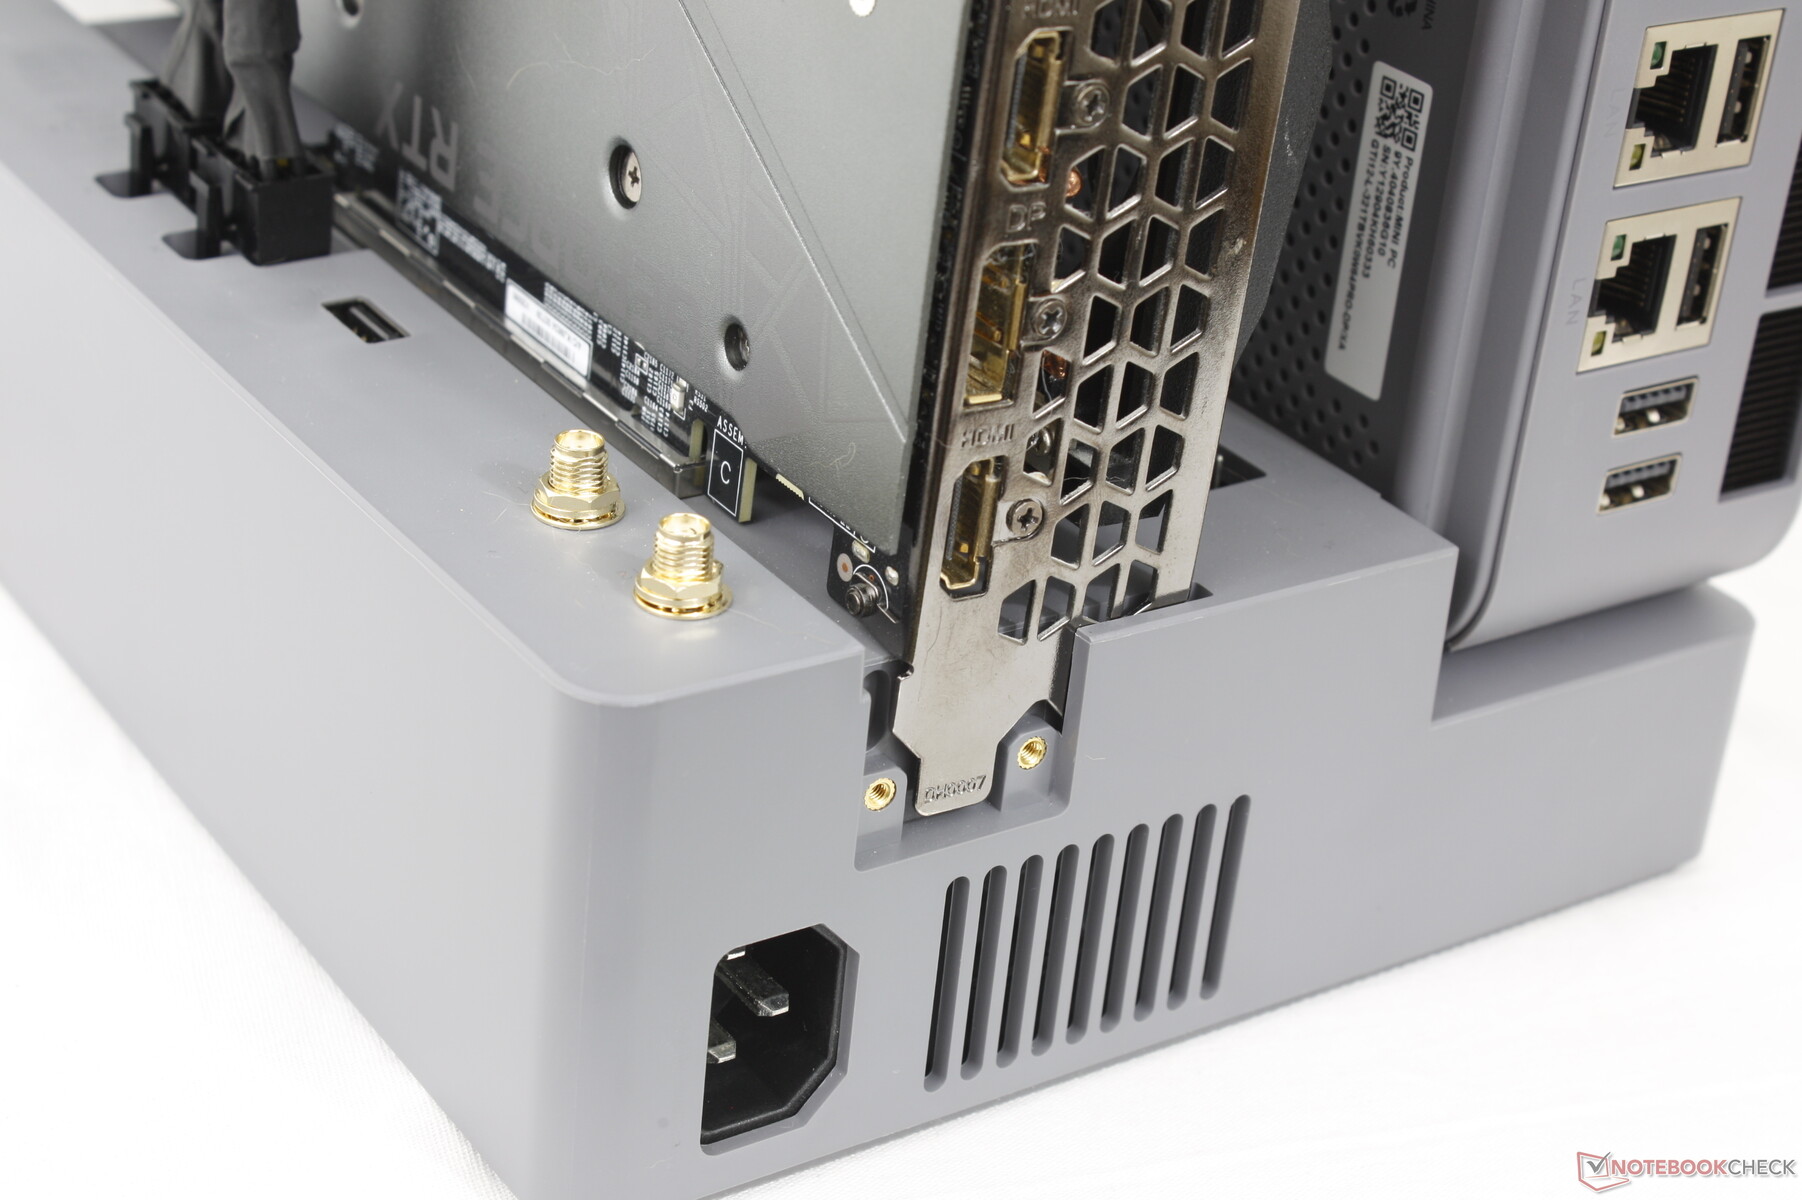
Las opciones de puertos son mayores que las que ofrecen el SER8 y muchos otros mini PC de tamaño NUC, ya que el GTI12 Ultra es muy grande. El modelo integra un lector de tarjetas SD junto con puertos USB-A adicionales y puertos RJ-45.
No dispone de bloqueo Kensington.

Lector de tarjetas SD
| SD Card Reader | |
| average JPG Copy Test (av. of 3 runs) | |
| Asus ROG NUC 14-90AS0051 (AV Pro SD microSD 128 GB V60) | |
| Beelink GTI12 Ultra EX Docking Station (Toshiba Exceria Pro SDXC 64 GB UHS-II) | |
| maximum AS SSD Seq Read Test (1GB) | |
| Asus ROG NUC 14-90AS0051 (AV Pro SD microSD 128 GB V60) | |
| Beelink GTI12 Ultra EX Docking Station (Toshiba Exceria Pro SDXC 64 GB UHS-II) | |
Comunicación
Wi-Fi 6E y Wi-Fi 7 no son compatibles probablemente para ahorrar en costes.
| Networking | |
| iperf3 transmit AXE11000 | |
| Asus NUC 14 Pro | |
| Beelink GTI12 Ultra EX Docking Station | |
| Asus ROG NUC 14-90AS0051 | |
| Geekom AX8 Pro | |
| Minisforum MS-A1 | |
| GMK NucBox K9 | |
| iperf3 receive AXE11000 | |
| Asus NUC 14 Pro | |
| Beelink GTI12 Ultra EX Docking Station | |
| Geekom AX8 Pro | |
| Asus ROG NUC 14-90AS0051 | |
| Minisforum MS-A1 | |
| GMK NucBox K9 | |
| iperf3 transmit AXE11000 6GHz | |
| Geekom AX8 Pro | |
| Asus ROG NUC 14-90AS0051 | |
| Minisforum MS-A1 | |
| Asus NUC 14 Pro | |
| iperf3 receive AXE11000 6GHz | |
| Minisforum MS-A1 | |
| Asus ROG NUC 14-90AS0051 | |
| Asus NUC 14 Pro | |
| Geekom AX8 Pro | |
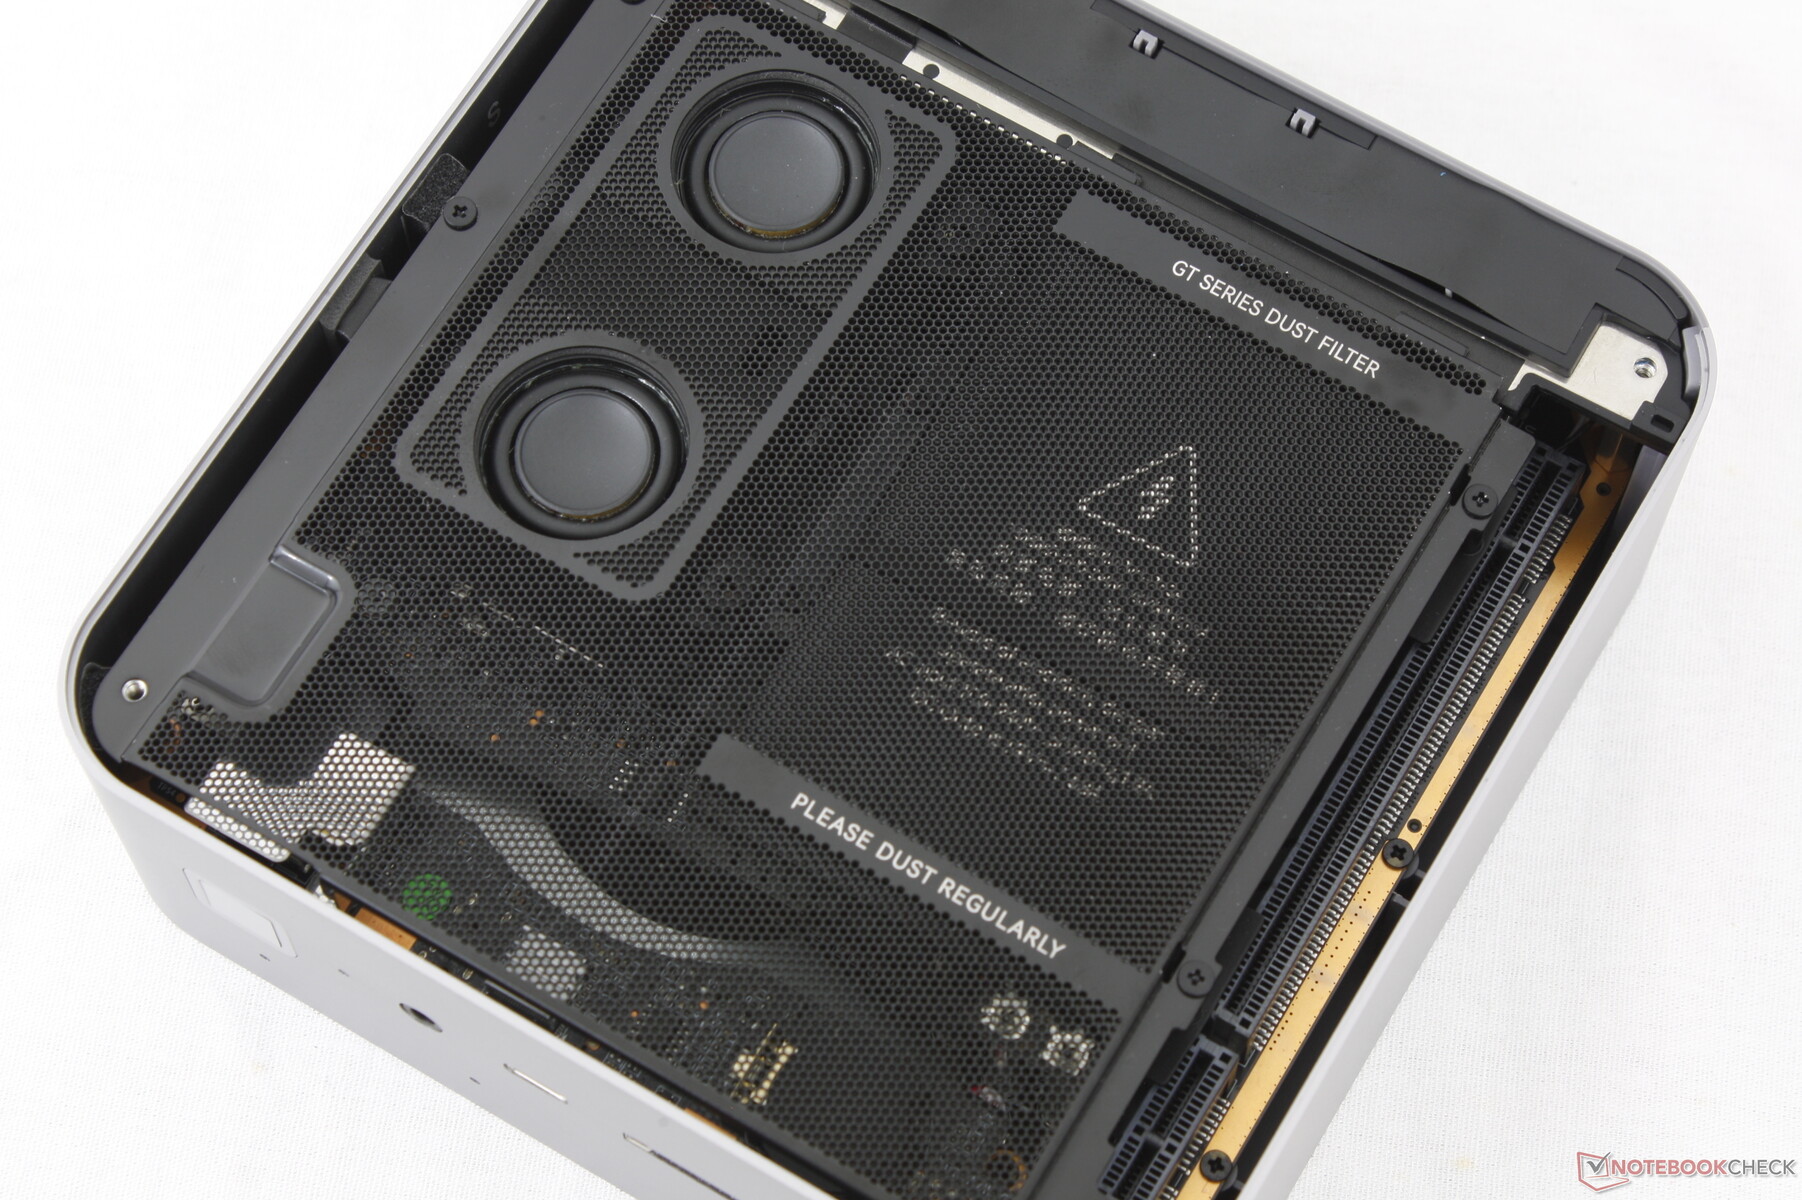
Mantenimiento
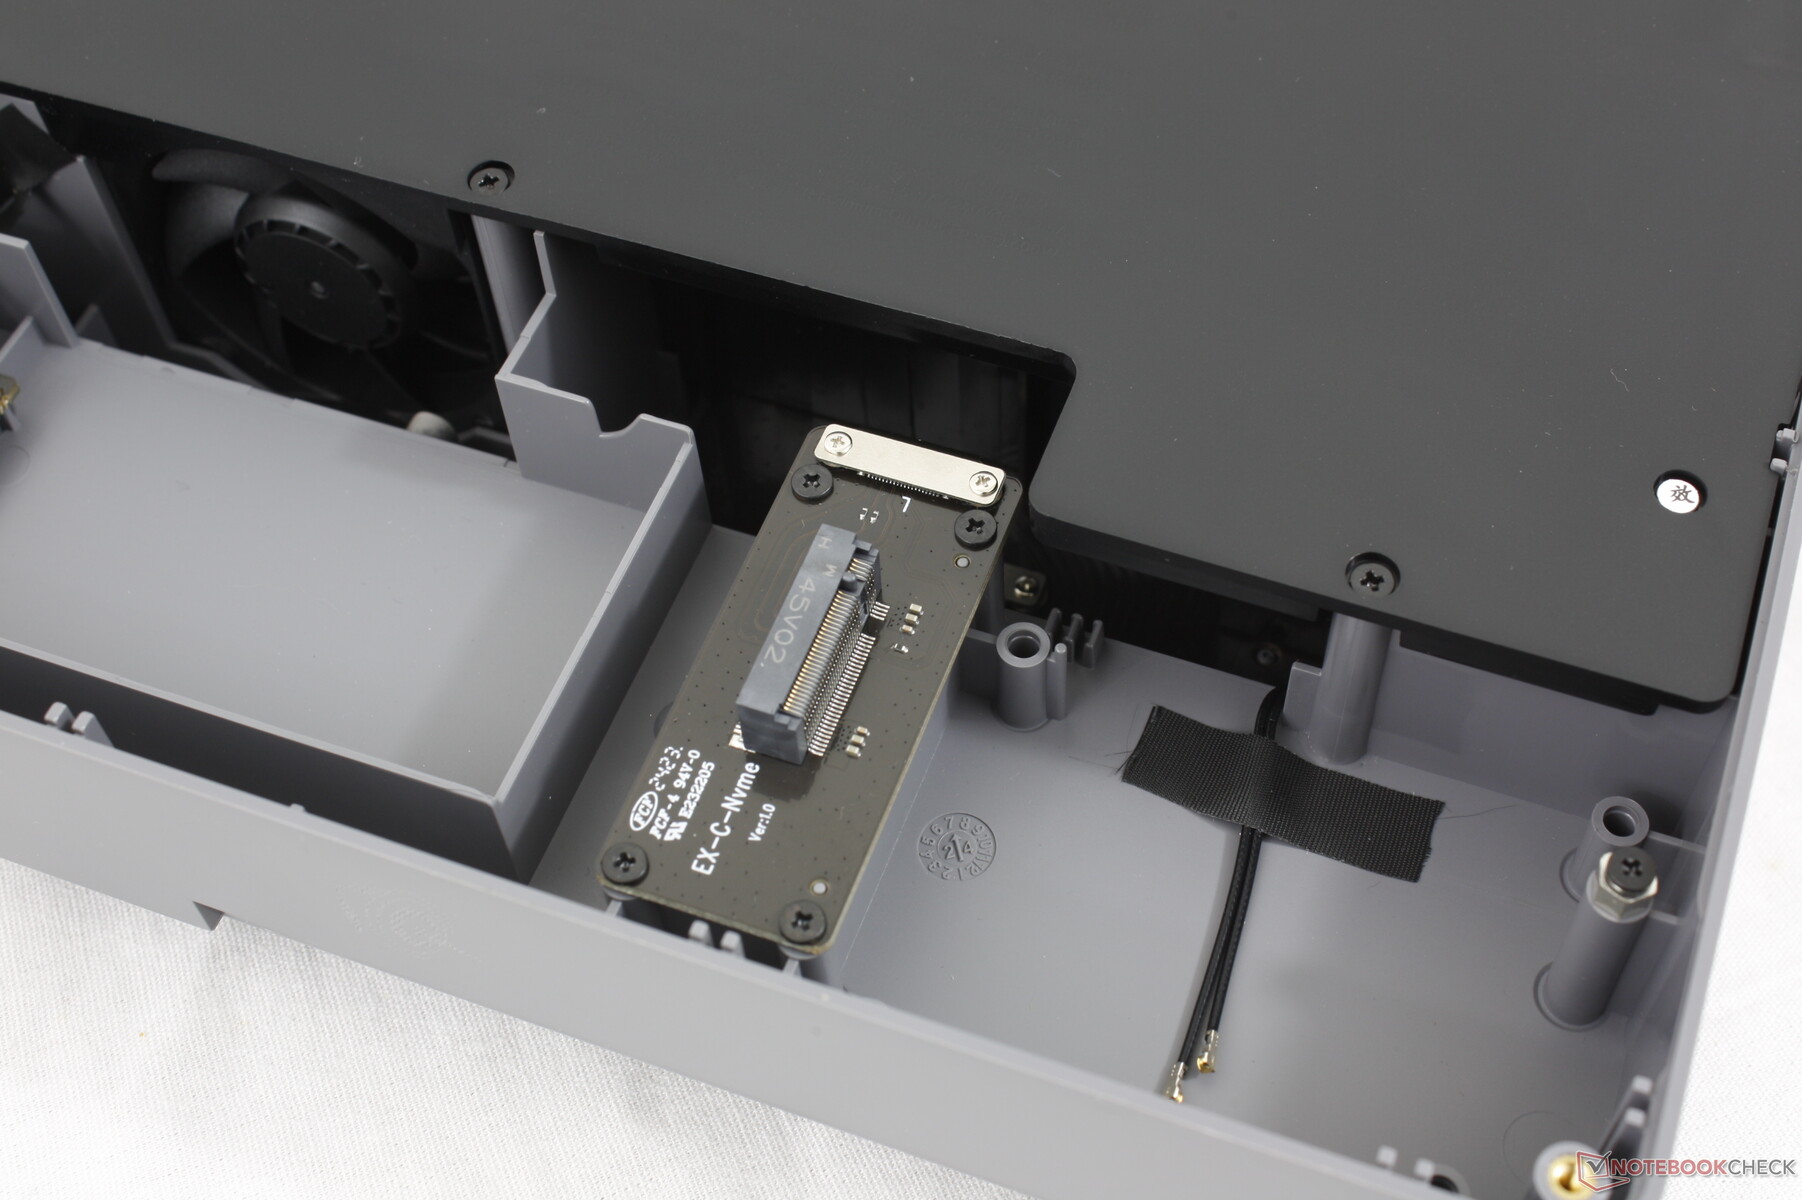
El GTI12 Ultra es mucho más difícil de mantener en comparación con sus hermanos menores debido a que tiene más piezas integradas que no se encuentran en otros modelos. Los altavoces, el filtro antipolvo y la fuente de alimentación integrada se asientan sobre la placa base y cada uno de ellos tiene tornillos de distinto tamaño para que el mantenimiento sea aún más un quebradero de cabeza.
Sostenibilidad
Beelink anuncia que no se han tomado medidas de sostenibilidad para fabricar la GTI12. El embalaje está compuesto en su mayor parte de papel con algo de envoltorio de LDPE y plástico.
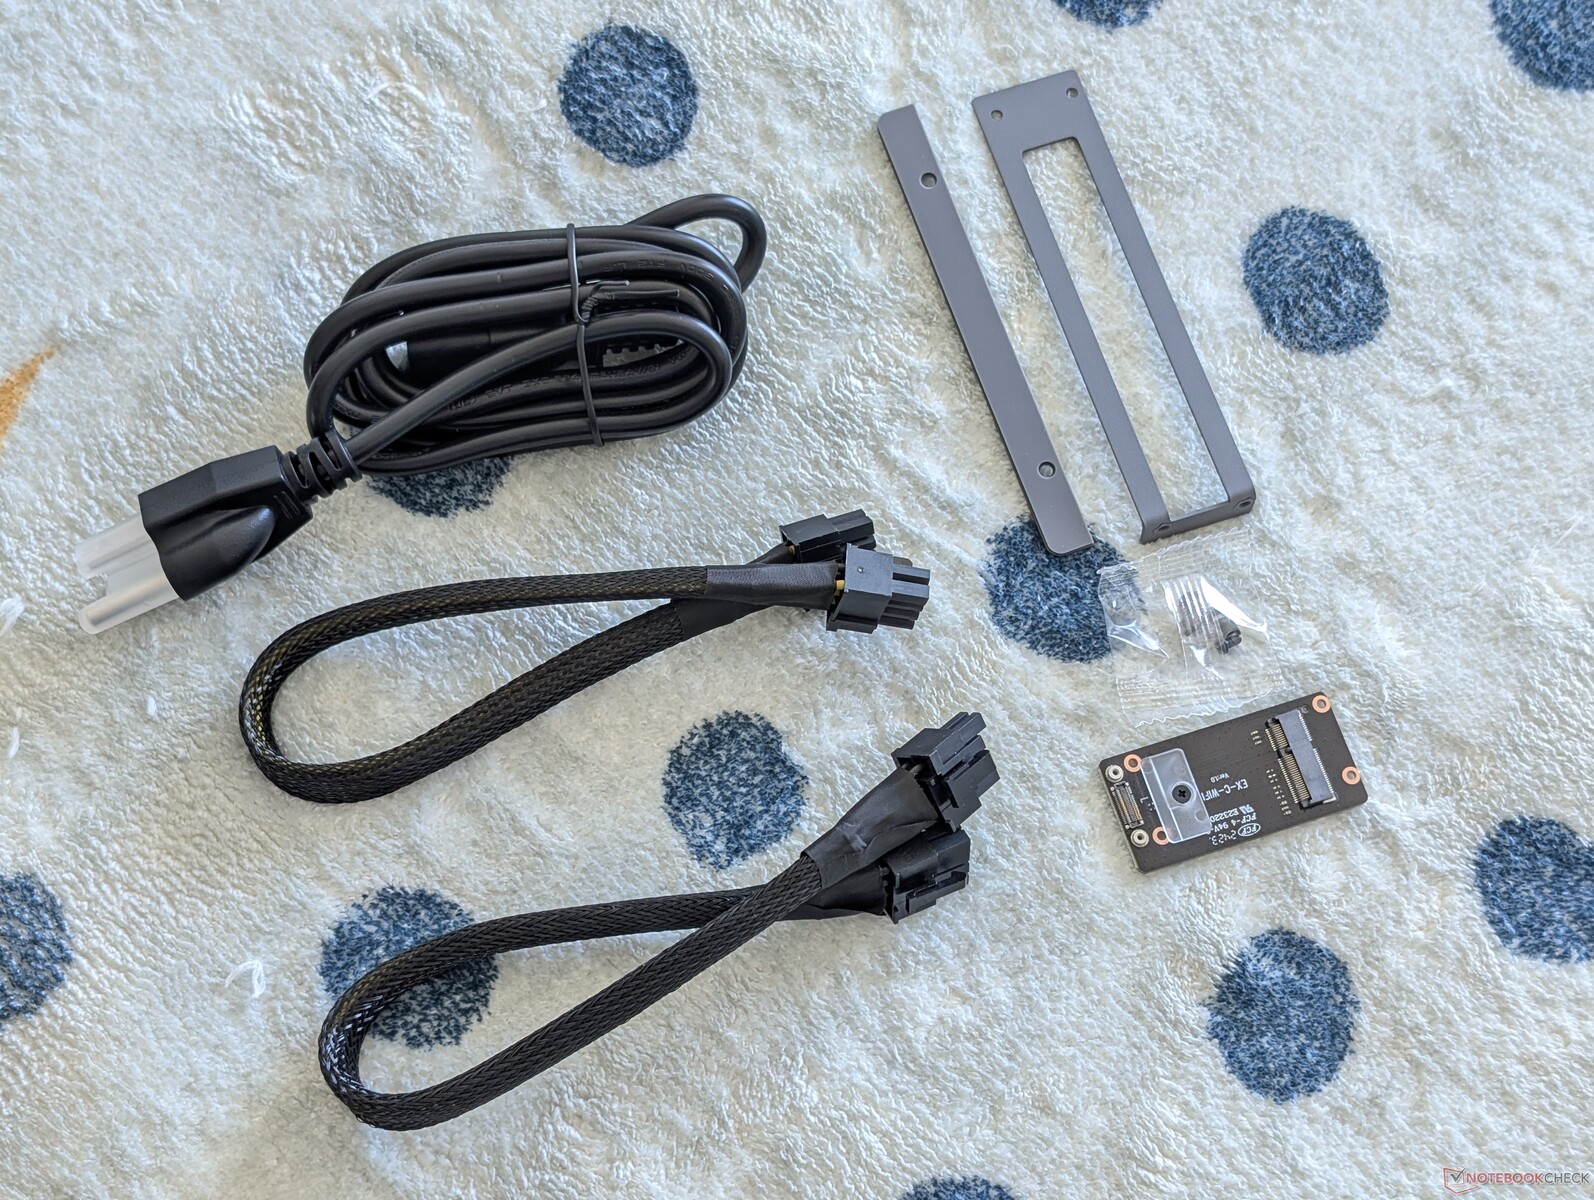
Accesorios y garantía
La base EX incluye dos cables de alimentación de 6+2 patillas y dos pequeñas placas para fijar la GPU y el mini PC a la base. La ranura M.2 Wi-Fi y la antena son opcionales para quienes deseen instalar un módulo WLAN en la base de acoplamiento en lugar de dentro del mini PC. Prácticamente todos los mini PC vienen con WLAN integrada, por lo que esta característica específica del dock puede ser ignorada por la mayoría de los usuarios.
Rendimiento
Condiciones de prueba
Pusimos Windows en modo Rendimiento antes de ejecutar las pruebas comparativas que se indican a continuación.
Procesador
El Core i9-12900H está dos o tres generaciones por detrás de la actual serie Raptor Lake-R y los resultados de las pruebas de rendimiento así lo reflejan. El más reciente Core i9-14900HXpor ejemplo, proporciona casi el doble de rendimiento multihilo que nuestra unidad Beelink. Incluso los mini PC más baratos como el Beelink SER7 pueden ofrecer un rendimiento de procesador casi idéntico.
Existen opciones de procesadores Meteor Lake Core Ultra más recientes para este modelo llamado GTI14.
Cinebench R15 Multi Loop
Cinebench R23: Multi Core | Single Core
Cinebench R20: CPU (Multi Core) | CPU (Single Core)
Cinebench R15: CPU Multi 64Bit | CPU Single 64Bit
Blender: v2.79 BMW27 CPU
7-Zip 18.03: 7z b 4 | 7z b 4 -mmt1
Geekbench 6.4: Multi-Core | Single-Core
Geekbench 5.5: Multi-Core | Single-Core
HWBOT x265 Benchmark v2.2: 4k Preset
LibreOffice : 20 Documents To PDF
R Benchmark 2.5: Overall mean
* ... más pequeño es mejor
AIDA64: FP32 Ray-Trace | FPU Julia | CPU SHA3 | CPU Queen | FPU SinJulia | FPU Mandel | CPU AES | CPU ZLib | FP64 Ray-Trace | CPU PhotoWorxx
| Performance Rating | |
| Minisforum MS-A1 | |
| Geekom AX8 Pro | |
| Asus ROG NUC 14-90AS0051 | |
| Beelink GTI12 Ultra EX Docking Station | |
| Asus NUC 14 Pro | |
| Medio Intel Core i9-12900H | |
| GMK NucBox K9 | |
| AIDA64 / FP32 Ray-Trace | |
| Minisforum MS-A1 | |
| Geekom AX8 Pro | |
| Asus ROG NUC 14-90AS0051 | |
| Beelink GTI12 Ultra EX Docking Station | |
| Asus NUC 14 Pro | |
| Medio Intel Core i9-12900H (4074 - 18289, n=28) | |
| GMK NucBox K9 | |
| AIDA64 / FPU Julia | |
| Minisforum MS-A1 | |
| Geekom AX8 Pro | |
| Asus ROG NUC 14-90AS0051 | |
| Beelink GTI12 Ultra EX Docking Station | |
| Asus NUC 14 Pro | |
| GMK NucBox K9 | |
| Medio Intel Core i9-12900H (22307 - 93236, n=28) | |
| AIDA64 / CPU SHA3 | |
| Minisforum MS-A1 | |
| Geekom AX8 Pro | |
| Asus ROG NUC 14-90AS0051 | |
| Beelink GTI12 Ultra EX Docking Station | |
| Asus NUC 14 Pro | |
| Medio Intel Core i9-12900H (1378 - 4215, n=28) | |
| GMK NucBox K9 | |
| AIDA64 / CPU Queen | |
| Minisforum MS-A1 | |
| Geekom AX8 Pro | |
| Medio Intel Core i9-12900H (78172 - 111241, n=28) | |
| Beelink GTI12 Ultra EX Docking Station | |
| Asus ROG NUC 14-90AS0051 | |
| Asus NUC 14 Pro | |
| GMK NucBox K9 | |
| AIDA64 / FPU SinJulia | |
| Minisforum MS-A1 | |
| Geekom AX8 Pro | |
| Asus ROG NUC 14-90AS0051 | |
| Beelink GTI12 Ultra EX Docking Station | |
| Medio Intel Core i9-12900H (5709 - 10410, n=28) | |
| Asus NUC 14 Pro | |
| GMK NucBox K9 | |
| AIDA64 / FPU Mandel | |
| Minisforum MS-A1 | |
| Geekom AX8 Pro | |
| Asus ROG NUC 14-90AS0051 | |
| Beelink GTI12 Ultra EX Docking Station | |
| Asus NUC 14 Pro | |
| Medio Intel Core i9-12900H (11257 - 45581, n=28) | |
| GMK NucBox K9 | |
| AIDA64 / CPU AES | |
| Minisforum MS-A1 | |
| Geekom AX8 Pro | |
| GMK NucBox K9 | |
| Asus ROG NUC 14-90AS0051 | |
| Medio Intel Core i9-12900H (31935 - 151546, n=28) | |
| Beelink GTI12 Ultra EX Docking Station | |
| Asus NUC 14 Pro | |
| AIDA64 / CPU ZLib | |
| Asus ROG NUC 14-90AS0051 | |
| Minisforum MS-A1 | |
| Beelink GTI12 Ultra EX Docking Station | |
| Geekom AX8 Pro | |
| Asus NUC 14 Pro | |
| Medio Intel Core i9-12900H (449 - 1193, n=28) | |
| GMK NucBox K9 | |
| AIDA64 / FP64 Ray-Trace | |
| Minisforum MS-A1 | |
| Geekom AX8 Pro | |
| Asus ROG NUC 14-90AS0051 | |
| Beelink GTI12 Ultra EX Docking Station | |
| Asus NUC 14 Pro | |
| Medio Intel Core i9-12900H (2235 - 10511, n=28) | |
| GMK NucBox K9 | |
| AIDA64 / CPU PhotoWorxx | |
| Asus NUC 14 Pro | |
| GMK NucBox K9 | |
| Asus ROG NUC 14-90AS0051 | |
| Beelink GTI12 Ultra EX Docking Station | |
| Minisforum MS-A1 | |
| Geekom AX8 Pro | |
| Medio Intel Core i9-12900H (20960 - 48269, n=29) | |
Rendimiento del sistema
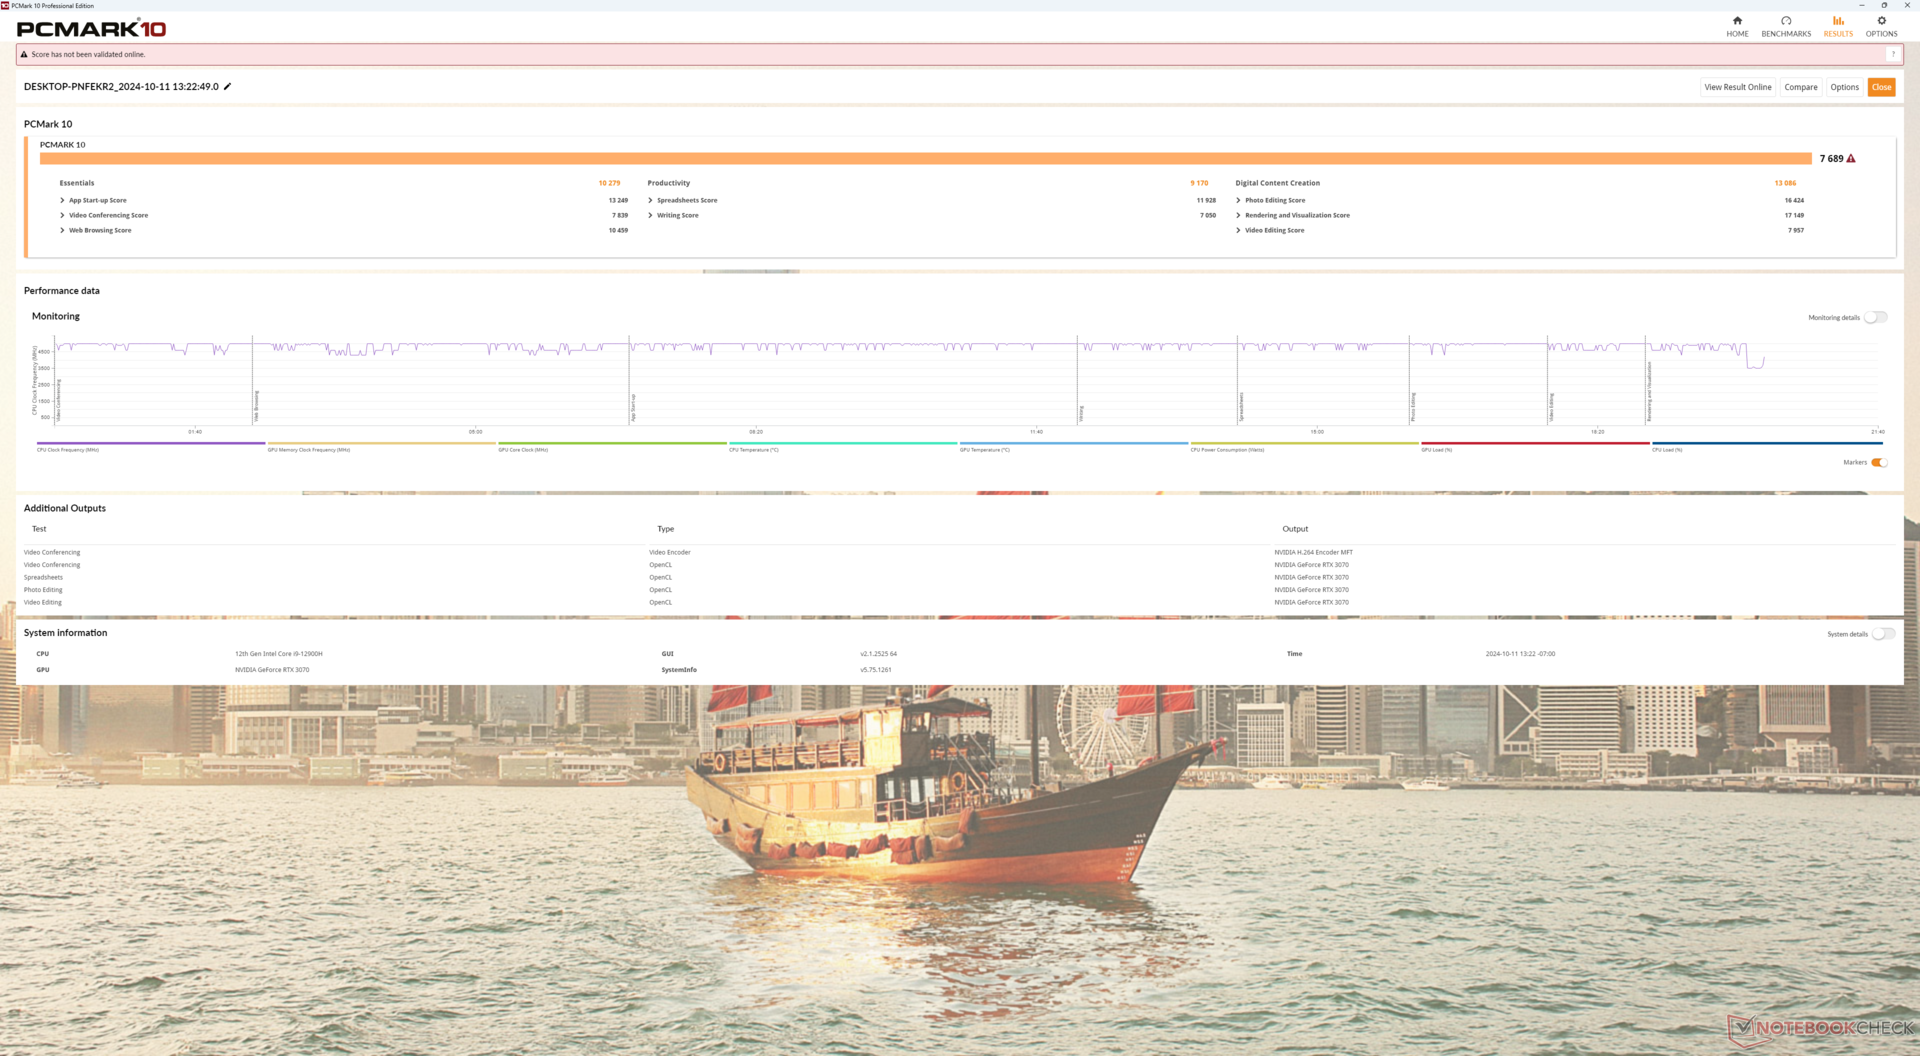
Los resultados de PCMark son comparables a los de portátiles y otros mini PC que funcionan con gráficos discretos, incluido el Asus ROG NUC 14. Sin embargo, nuestra puntuación de productividad es relativamente baja, probablemente debido a la CPU Intel de 12ª generación más antigua.
CrossMark: Overall | Productivity | Creativity | Responsiveness
WebXPRT 3: Overall
WebXPRT 4: Overall
Mozilla Kraken 1.1: Total
* ... más pequeño es mejor
| PCMark 10 Score | 7689 puntos | |
ayuda | ||
| AIDA64 / Memory Copy | |
| Asus ROG NUC 14-90AS0051 | |
| Asus NUC 14 Pro | |
| Geekom AX8 Pro | |
| GMK NucBox K9 | |
| Minisforum MS-A1 | |
| Beelink GTI12 Ultra EX Docking Station | |
| Medio Intel Core i9-12900H (34438 - 74264, n=28) | |
| AIDA64 / Memory Read | |
| Asus NUC 14 Pro | |
| Asus ROG NUC 14-90AS0051 | |
| GMK NucBox K9 | |
| Beelink GTI12 Ultra EX Docking Station | |
| Medio Intel Core i9-12900H (36365 - 74642, n=28) | |
| Geekom AX8 Pro | |
| Minisforum MS-A1 | |
| AIDA64 / Memory Write | |
| Geekom AX8 Pro | |
| Minisforum MS-A1 | |
| Asus NUC 14 Pro | |
| GMK NucBox K9 | |
| Asus ROG NUC 14-90AS0051 | |
| Beelink GTI12 Ultra EX Docking Station | |
| Medio Intel Core i9-12900H (32276 - 67858, n=28) | |
| AIDA64 / Memory Latency | |
| Asus ROG NUC 14-90AS0051 | |
| GMK NucBox K9 | |
| Asus NUC 14 Pro | |
| Geekom AX8 Pro | |
| Beelink GTI12 Ultra EX Docking Station | |
| Minisforum MS-A1 | |
| Medio Intel Core i9-12900H (74.7 - 118.1, n=27) | |
* ... más pequeño es mejor
Latencia del CPD
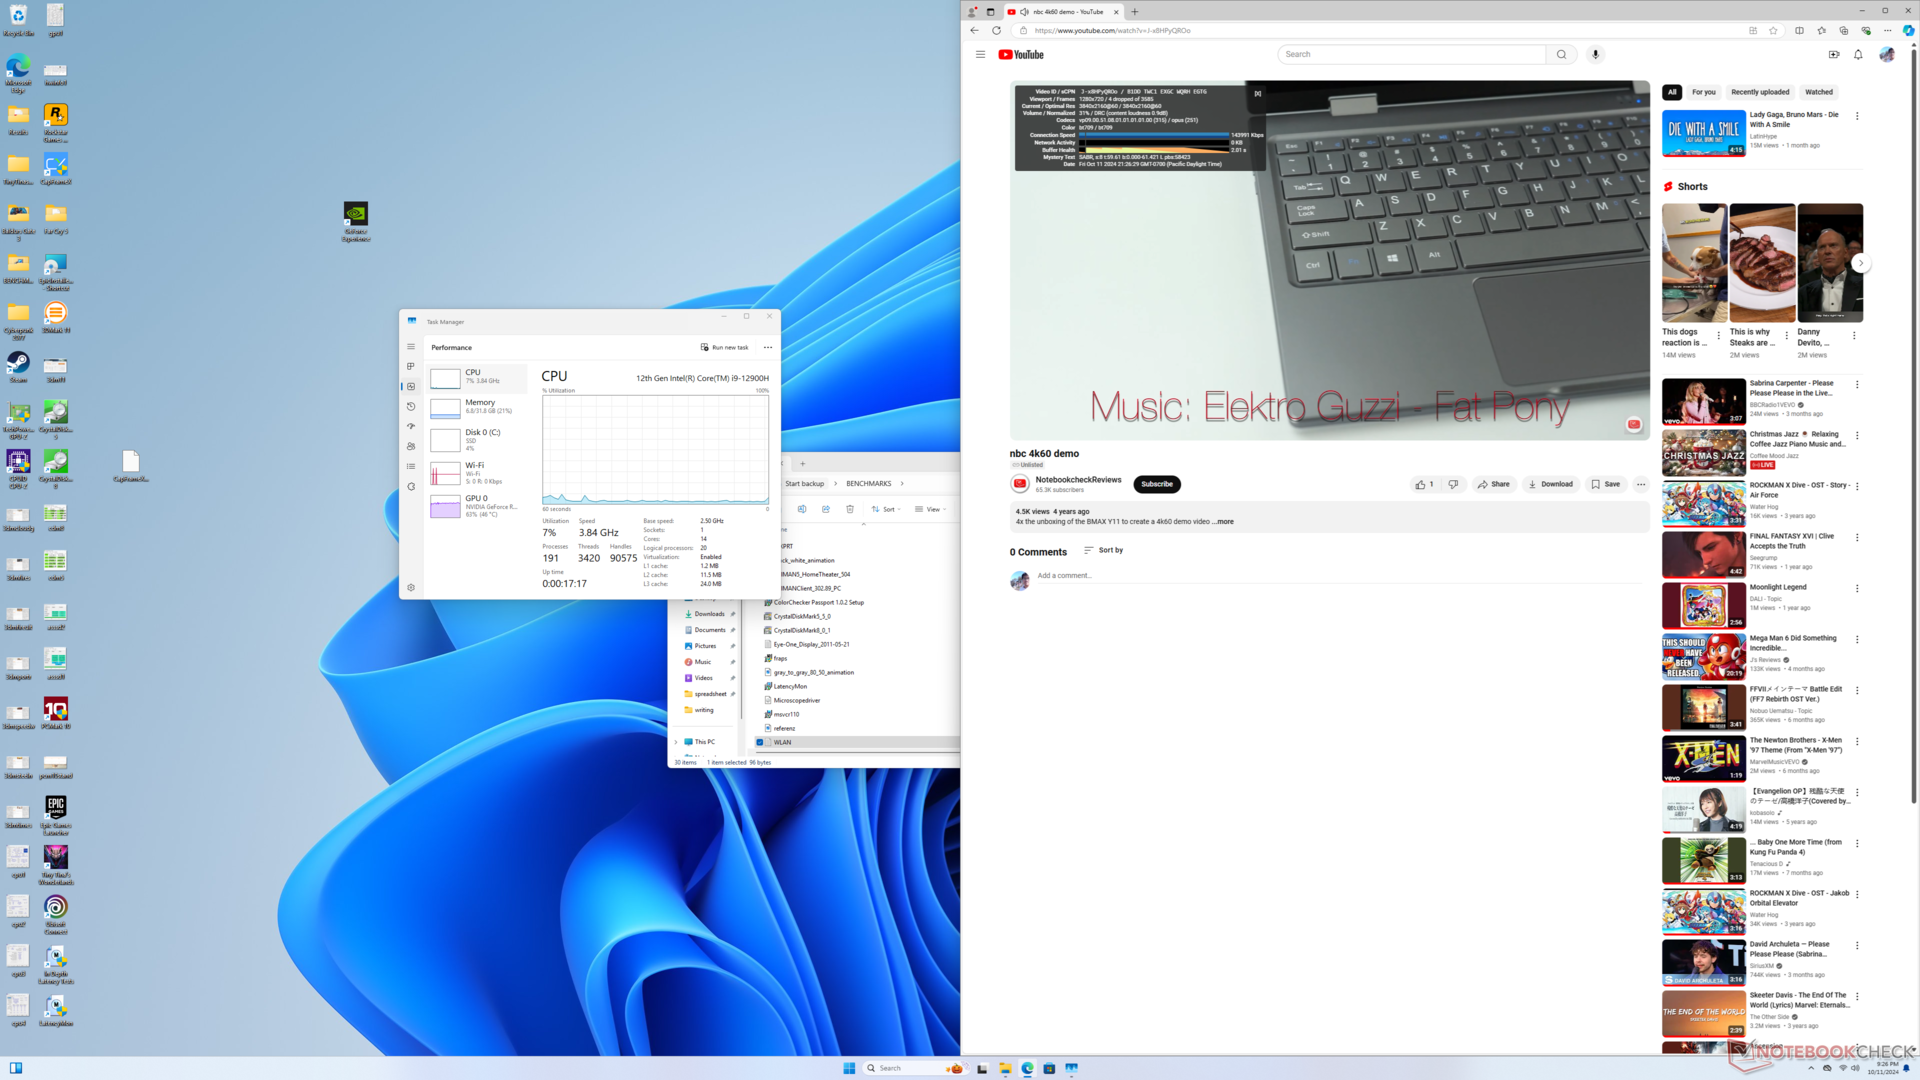
la reproducción de vídeo 4K a 60 FPS es casi perfecta. Extrañamente, siempre hay algunos fotogramas saltados inmediatamente después de pulsar el botón de reproducción, algo que no experimentamos normalmente en otros PC. Por lo demás, no hay fotogramas saltados durante el resto del vídeo de prueba.
LatencyMon es incompatible con la versión actual del sistema.
Dispositivos de almacenamiento
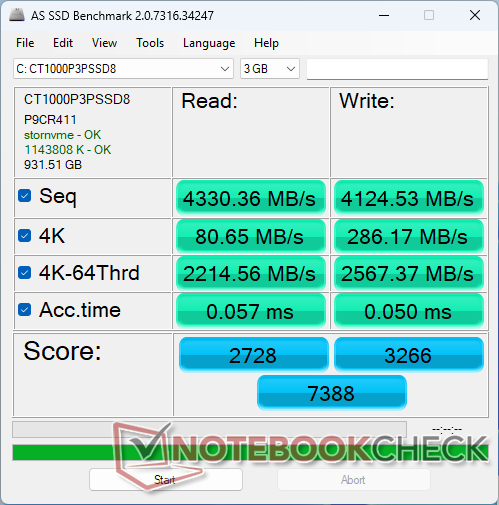
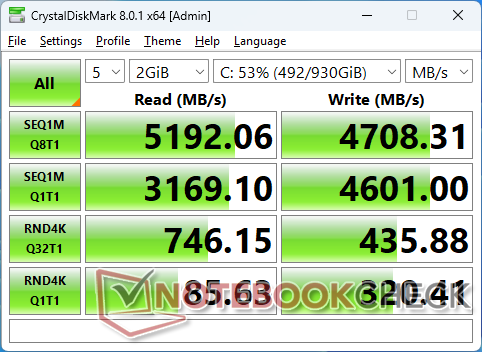
Nuestra unidad viene con un SSD Crucial P3 Plus. Las velocidades máximas de transferencia alcanzan los 5200 MB/s antes de caer a 4800 MB/s tras unos minutos de estrés. El Samsung PM9A1a más rápido en el Asus NUC 14 puede sostener 6700 MB/s en comparación.

| Drive Performance Rating - Percent | |
| Beelink GTI12 Ultra EX Docking Station | |
| GMK NucBox K9 | |
| Minisforum MS-A1 | |
| Geekom AX8 Pro | |
| Asus ROG NUC 14-90AS0051 | |
| Asus NUC 14 Pro | |
* ... más pequeño es mejor
Disk Throttling: DiskSpd Read Loop, Queue Depth 8
Rendimiento de la GPU
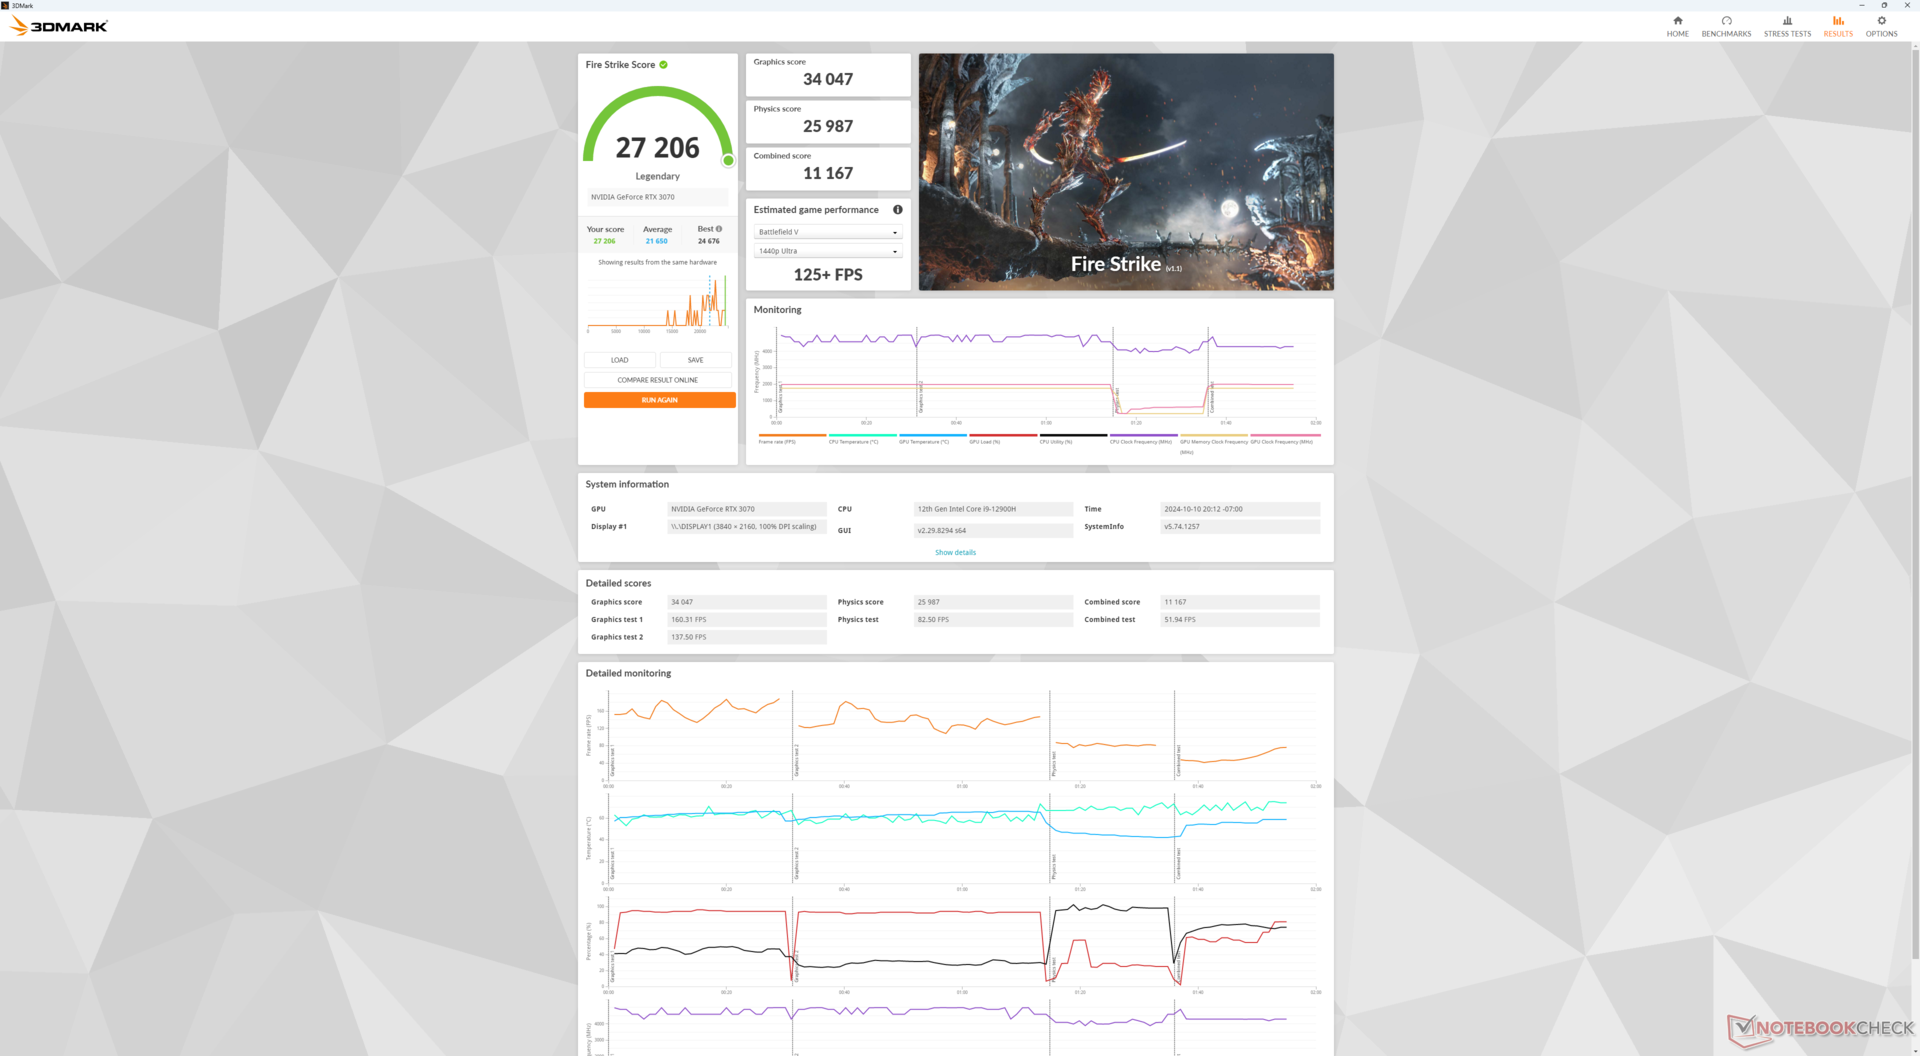
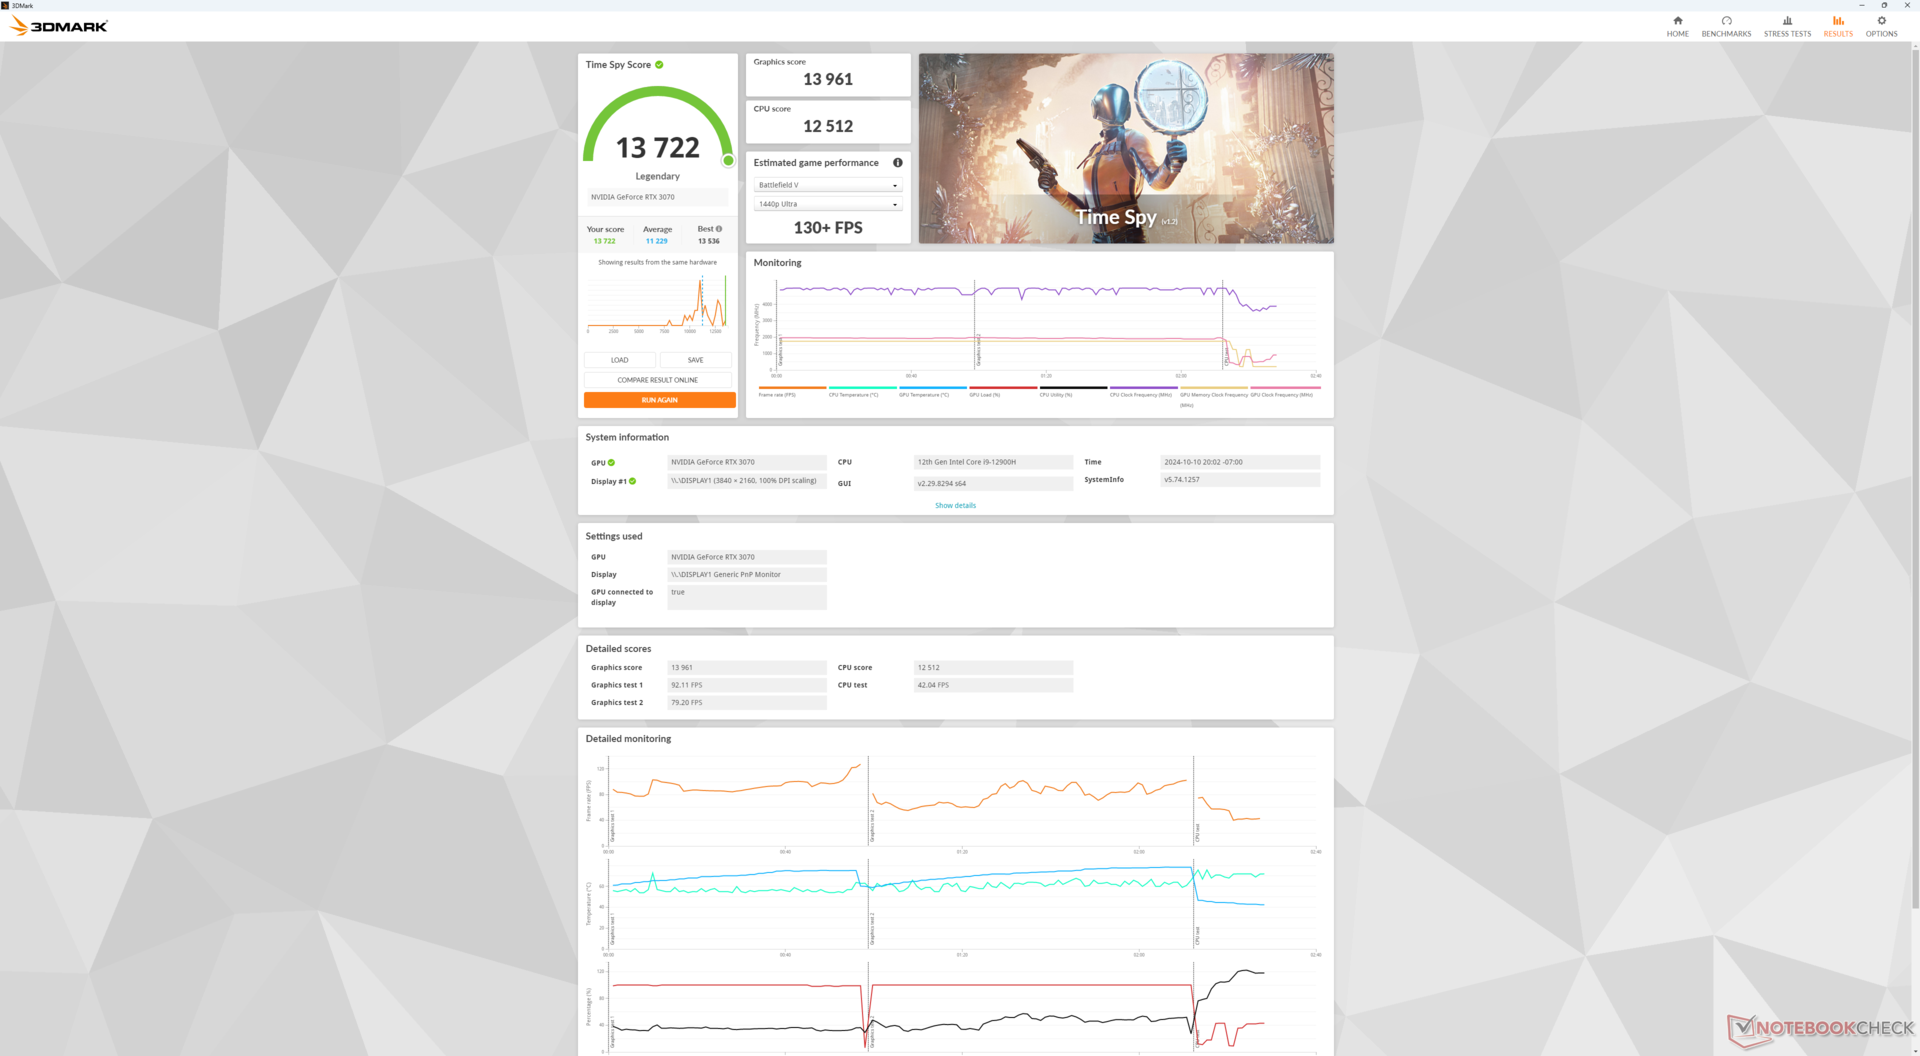
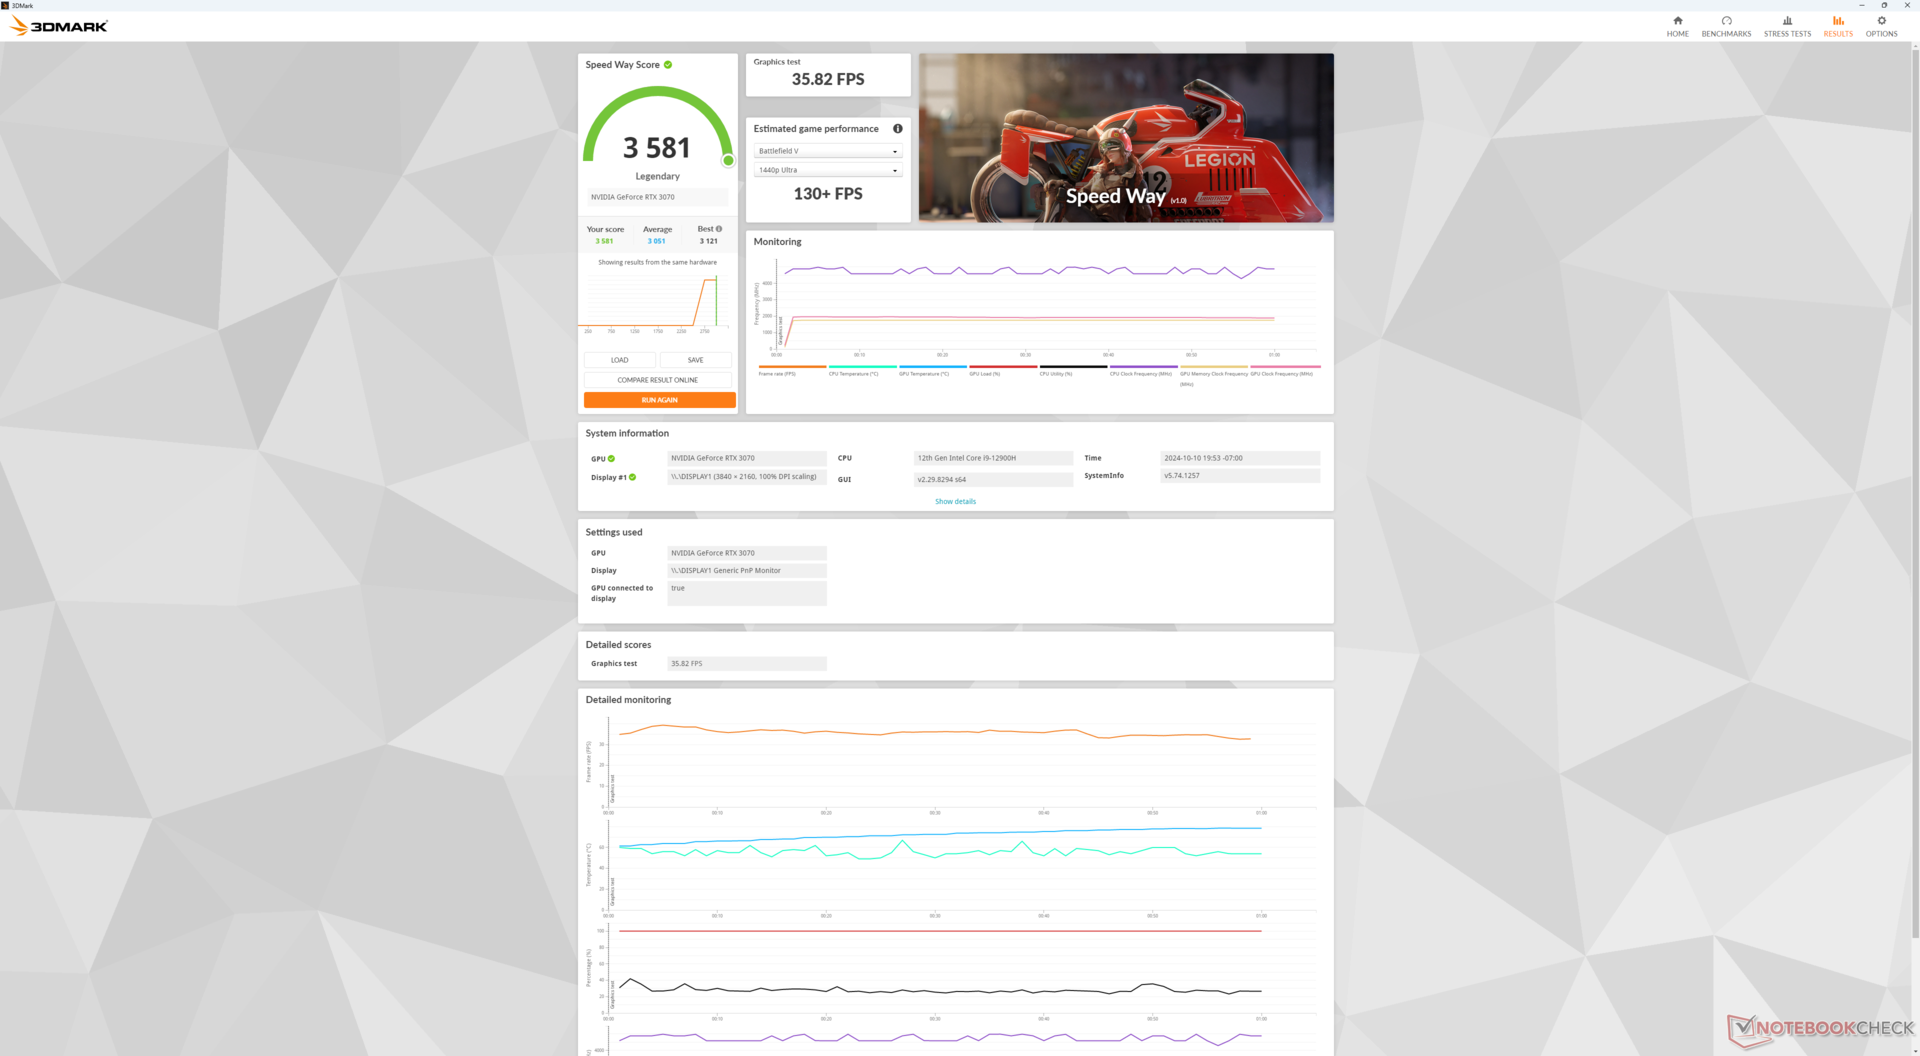
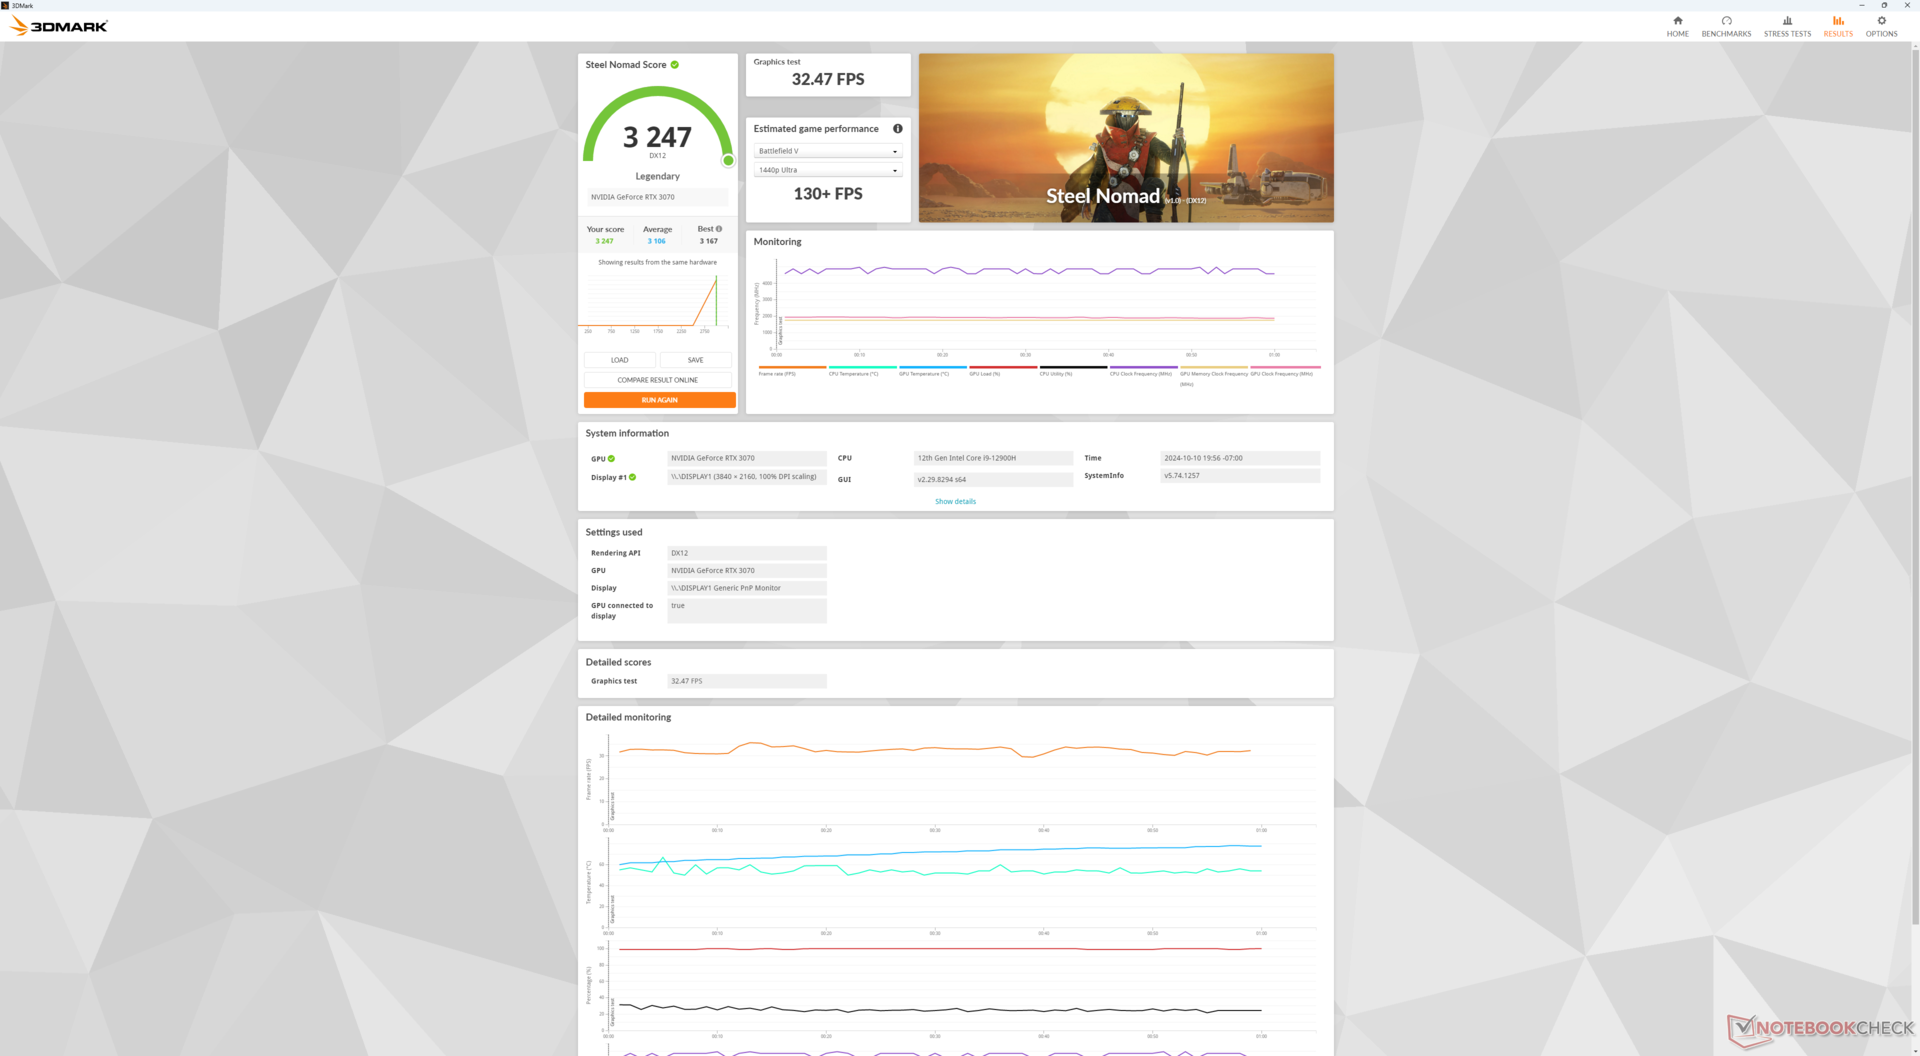
La GeForce RTX 3070 ha sido sometida a numerosas pruebas, por lo que su rendimiento no ofrece sorpresas. En cambio, estamos interesados en cualquier déficit de rendimiento que nuestra RTX 3070 acoplada pueda tener frente a un PC de sobremesa "adecuado" con la RTX 3070. En este caso, el rendimiento está esencialmente a la par con nuestro PC RTX 3070 de sobremesa de referencia o incluso es ligeramente más rápido en unos pocos puntos porcentuales para no mostrar pérdidas de rendimiento tangibles. Por supuesto, los resultados pueden variar si se instalan GPU mucho más rápidas como la RTX 4090, donde la interfaz PCIe x8 puede convertirse en un factor más limitante.
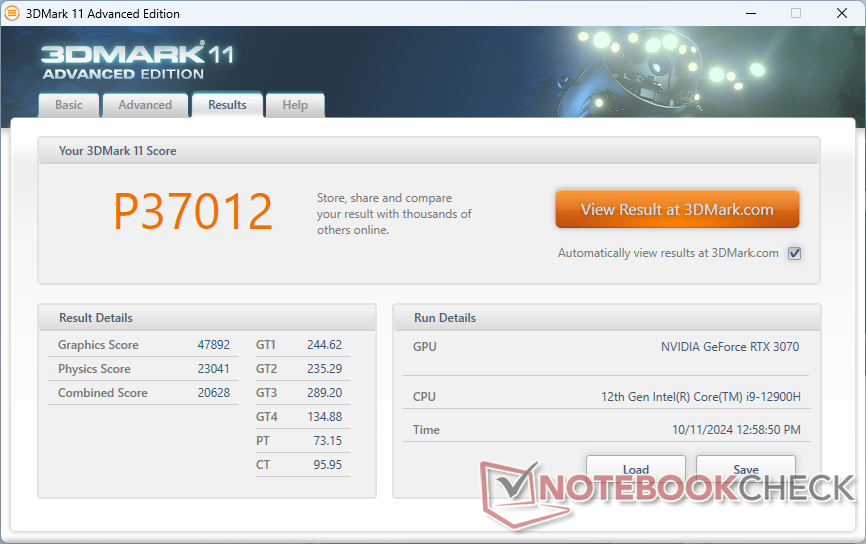
| 3DMark 11 Performance | 37012 puntos | |
| 3DMark Cloud Gate Standard Score | 57634 puntos | |
| 3DMark Fire Strike Score | 27206 puntos | |
| 3DMark Time Spy Score | 13722 puntos | |
| 3DMark Steel Nomad Score | 3247 puntos | |
ayuda | ||
* ... más pequeño es mejor
Rendimiento en juegos
A pesar de ser una GPU de hace cuatro años (¡!), la GeForce RTX 3070 de sobremesa sigue siendo potente, especialmente si se compara con los portátiles para juegos, en los que las envolventes de potencia son mucho menores. Nuestra GTI12 Ultra y eGPU de elección pueden superar con creces a portátiles con la GeForce RTX 4070 como la Maingear ML-16 MK2 para estar más en línea con la rTX 4080 portátil. Tenga en cuenta que esto es antes de tener en cuenta cualquier método de escalado DLSS y por lo que la serie RTX 40 móvil todavía puede potencialmente funcionar mejor si el título soporta DLSS 3.
| GTA V - 1920x1080 Highest Settings possible AA:4xMSAA + FX AF:16x | |
| Lenovo Legion 9 16IRX9, RTX 4090 | |
| Acemagic M2A | |
| Beelink GTI12 Ultra EX Docking Station | |
| Acemagic Tank03 | |
| Asus TUF Gaming A14 FA401WV-WB94 | |
| MSI GeForce RTX 3070 Ventus 3X | |
| Asus ROG NUC 14-90AS0051 | |
| Minisforum G7 PT | |
| Lenovo IdeaPad Pro 5 16IMH G9 RTX 4050 | |
| Cyberpunk 2077 2.2 Phantom Liberty - 1920x1080 Ultra Preset (FSR off) | |
| Lenovo Legion 9 16IRX9, RTX 4090 | |
| Beelink GTI12 Ultra EX Docking Station | |
| Minisforum G7 PT | |
| Asus ROG NUC 14-90AS0051 | |
| Acemagic M2A | |
| Acemagic Tank03 | |
| Asus TUF Gaming A14 FA401WV-WB94 | |
| Lenovo IdeaPad Pro 5 16IMH G9 RTX 4050 | |
Cyberpunk 2077 ultra FPS Chart
| bajo | medio | alto | ultra | QHD | 4K | |
|---|---|---|---|---|---|---|
| GTA V (2015) | 184.3 | 178.9 | 176.5 | 111.3 | 108.8 | 129 |
| Dota 2 Reborn (2015) | 175.9 | 162 | 158.5 | 149.3 | 144.3 | |
| Final Fantasy XV Benchmark (2018) | 209 | 184.8 | 138.7 | 104.9 | 61.5 | |
| X-Plane 11.11 (2018) | 118.2 | 106.1 | 89.5 | 79.4 | ||
| Far Cry 5 (2018) | 170 | 154 | 148 | 142 | 130 | 75 |
| Strange Brigade (2018) | 459 | 339 | 280 | 245 | 181.1 | 104.6 |
| Tiny Tina's Wonderlands (2022) | 268.9 | 216.7 | 154.9 | 122.6 | 87.1 | 48.9 |
| F1 22 (2022) | 282 | 277 | 264 | 91.8 | 58.8 | 28.8 |
| Baldur's Gate 3 (2023) | 174.5 | 152.6 | 137.1 | 132.9 | 93.5 | 49.7 |
| Cyberpunk 2077 2.2 Phantom Liberty (2023) | 148.5 | 133.9 | 115.3 | 102.2 | 65.7 | 29.9 |
Emisiones
Ruido del sistema
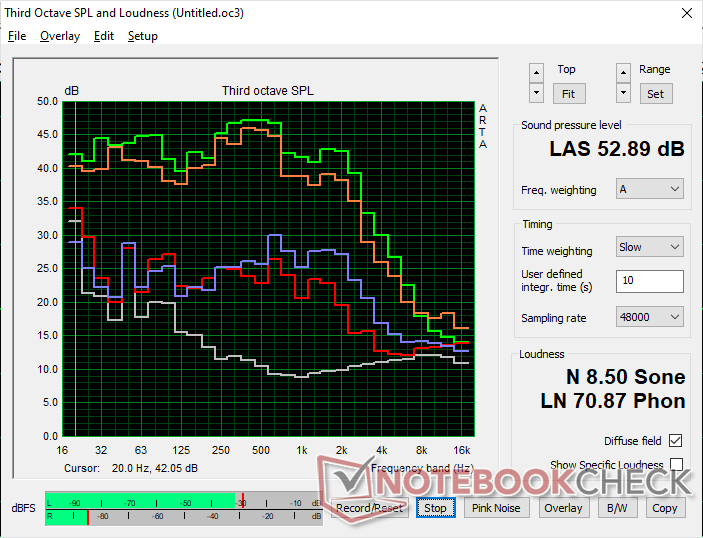
El ruido del ventilador está siempre presente, ya que el ventilador interno de la fuente de alimentación en la base EX está siempre activo, incluso si los ventiladores del mini PC y la GPU están inactivos. En general, los niveles de ruido son más altos que en la mayoría de los demás mini PC dada la misma distancia de grabación de 15 cm, pero la curva de ruido es más amplia y no tan pronunciada como a lo que estamos acostumbrados. Las frecuencias de dB más bajas son menos intrusivas y más tolerables que los ventiladores de los portátiles para juegos, que suelen ser más agudos y ruidosos.
Ruido
| Ocioso |
| 32.7 / 32.7 / 35.3 dB(A) |
| Carga |
| 36.8 / 52.9 dB(A) |
 | ||
30 dB silencioso 40 dB(A) audible 50 dB(A) ruidosamente alto |
||
min: | ||
| Beelink GTI12 Ultra EX Docking Station NVIDIA GeForce RTX 3070, i9-12900H, Crucial P3 Plus CT1000P3PSSD8 | Minisforum MS-A1 Radeon 780M, Ryzen 7 8700G, Kingston OM8PGP41024Q-A0 | GMK NucBox K9 Arc 7-Core, Ultra 5 125H, MasonSemi 1TB MC7000 | Asus NUC 14 Pro Arc 7-Core, Ultra 5 125H, Kingston KC3000 2048G SKC3000D2048G | Geekom AX8 Pro Radeon 780M, R9 8945HS, Acer N7000 2 TB | Asus ROG NUC 14-90AS0051 NVIDIA GeForce RTX 4070 Laptop GPU, Ultra 9 185H, Samsung PM9A1a MZVL21T0HDLU | |
|---|---|---|---|---|---|---|
| Noise | 1% | 2% | 9% | 5% | 15% | |
| apagado / medio ambiente * | 22.8 | 24.8 -9% | 23 -1% | 24 -5% | 24.9 -9% | 24.9 -9% |
| Idle Minimum * | 32.7 | 33.9 -4% | 29.8 9% | 26 20% | 24.9 24% | 24.9 24% |
| Idle Average * | 32.7 | 34 -4% | 35.7 -9% | 26.2 20% | 24.9 24% | 24.9 24% |
| Idle Maximum * | 35.3 | 34 4% | 35.7 -1% | 26.2 26% | 24.9 29% | 24.9 29% |
| Load Average * | 36.8 | 41.1 -12% | 41.9 -14% | 42.4 -15% | 50.1 -36% | 37.9 -3% |
| Cyberpunk 2077 ultra * | 50.3 | 42.2 16% | 43.8 13% | 47.7 5% | 50 1% | 38.3 24% |
| Load Maximum * | 52.9 | 46.2 13% | 44 17% | 47.8 10% | 50.2 5% | 44.2 16% |
* ... más pequeño es mejor
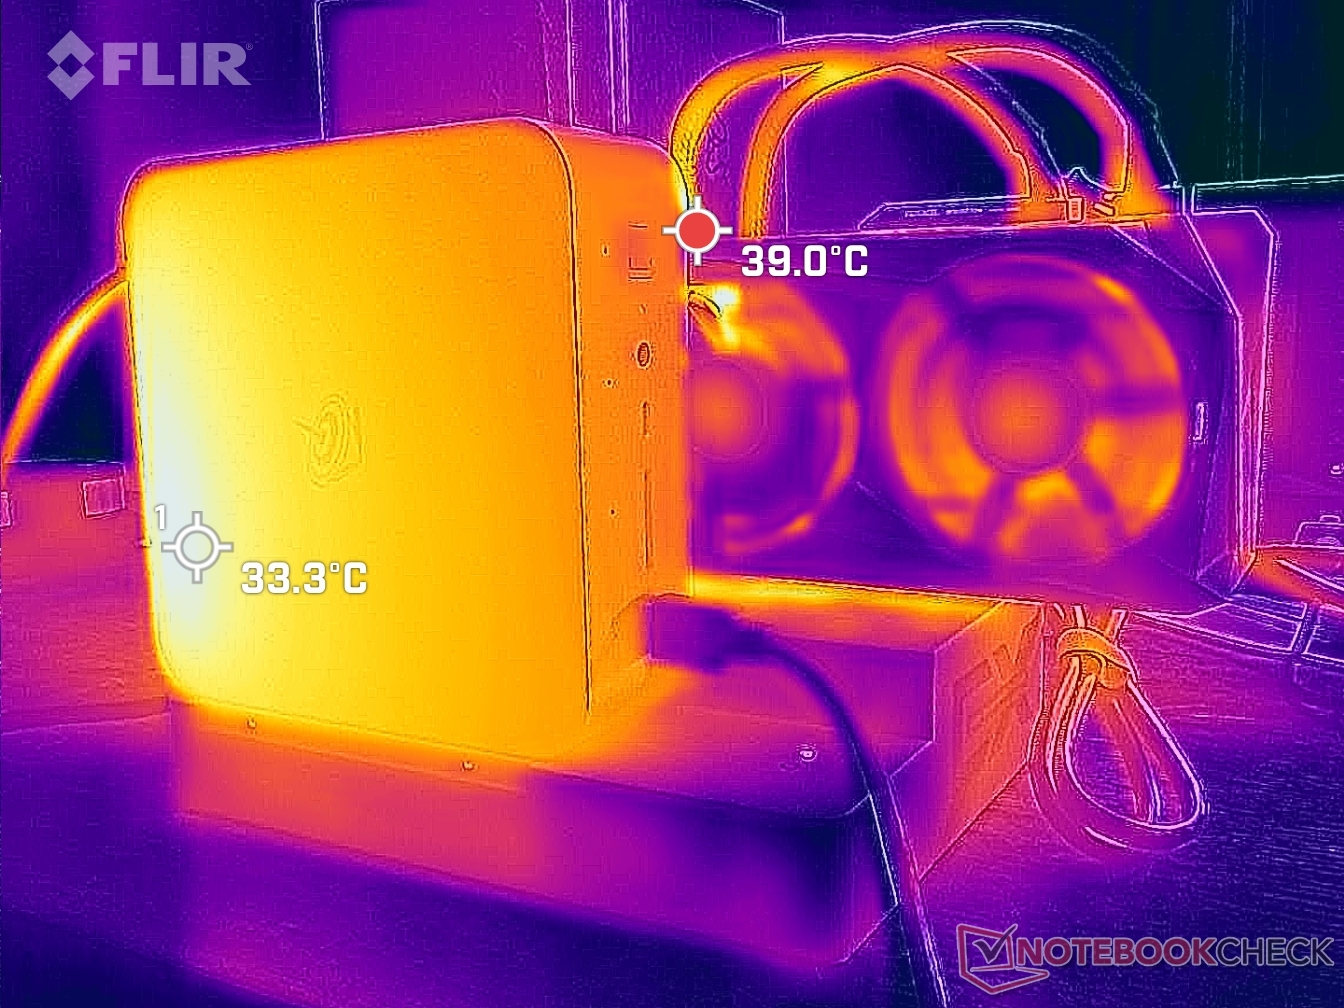
Temperatura
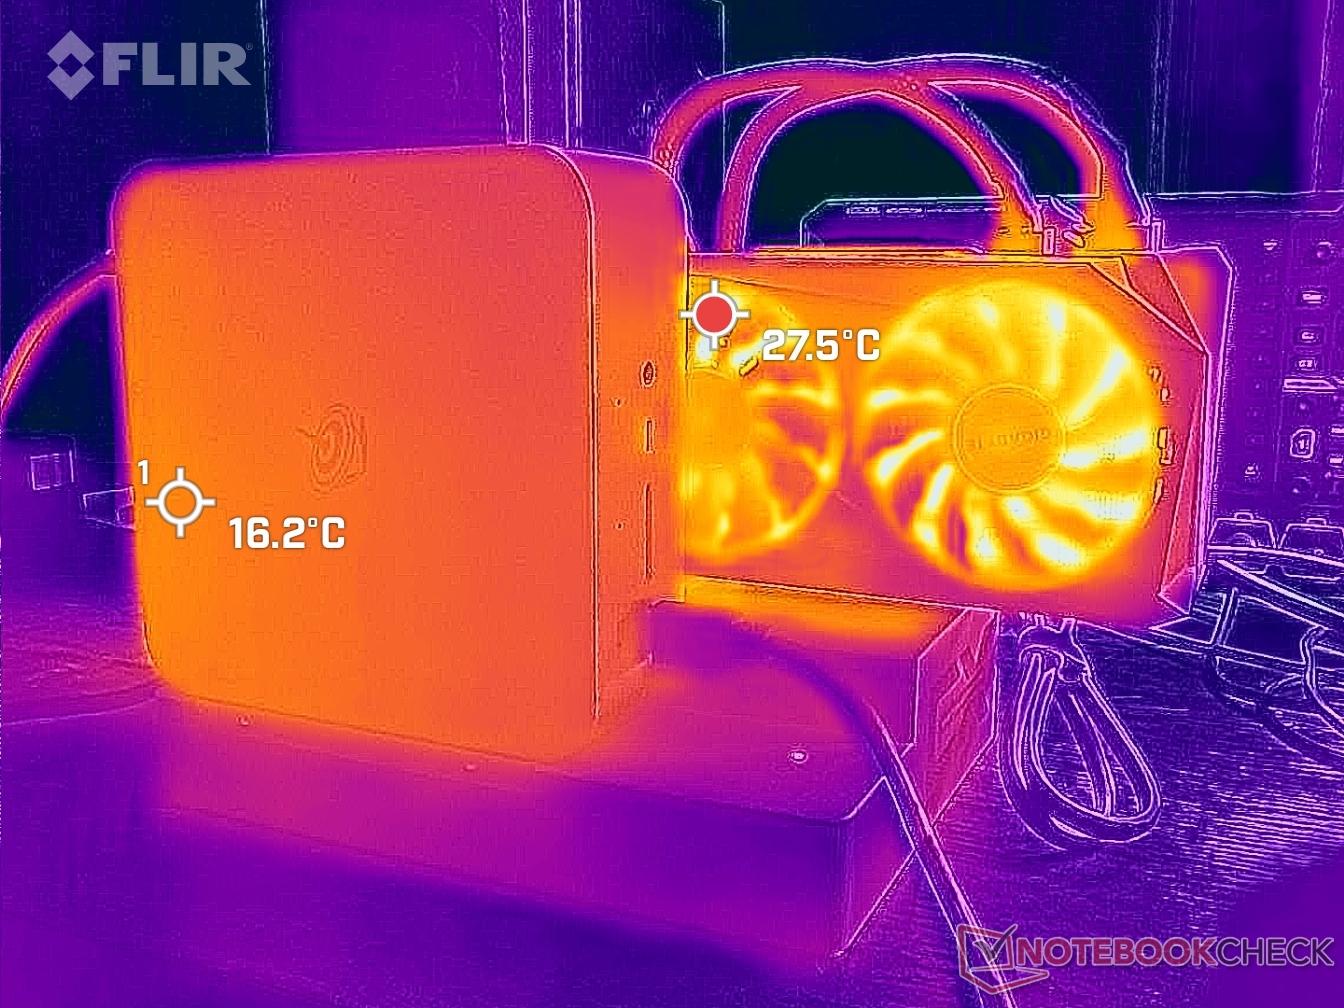
La superficie superior del mini PC puede alcanzar alrededor de 34 C cuando se está jugando o más de 41 C cuando la CPU está al 100 por cien de utilización para estar más caliente que muchos otros mini PC. Esto se debe principalmente a que la unidad integra toda la fuente de alimentación dentro del chasis y no incluye rejillas de ventilación en los laterales.
Prueba de estrés
La CPU aumentaría a 3,2 GHz y 69 W al iniciar el estrés Prime95. Después de uno o dos minutos, sin embargo, bajaría a 2,9 GHz y 61 W para mantener una temperatura del núcleo razonable de 78 C. El Turbo Boost máximo no es, por desgracia, indefinido a pesar del gran tamaño del chasis, pero al menos la caída del rendimiento es relativamente menor.
La temperatura del núcleo se estabilizaría en 83 C al jugar, lo que es más cálido de lo esperado para un mini PC.
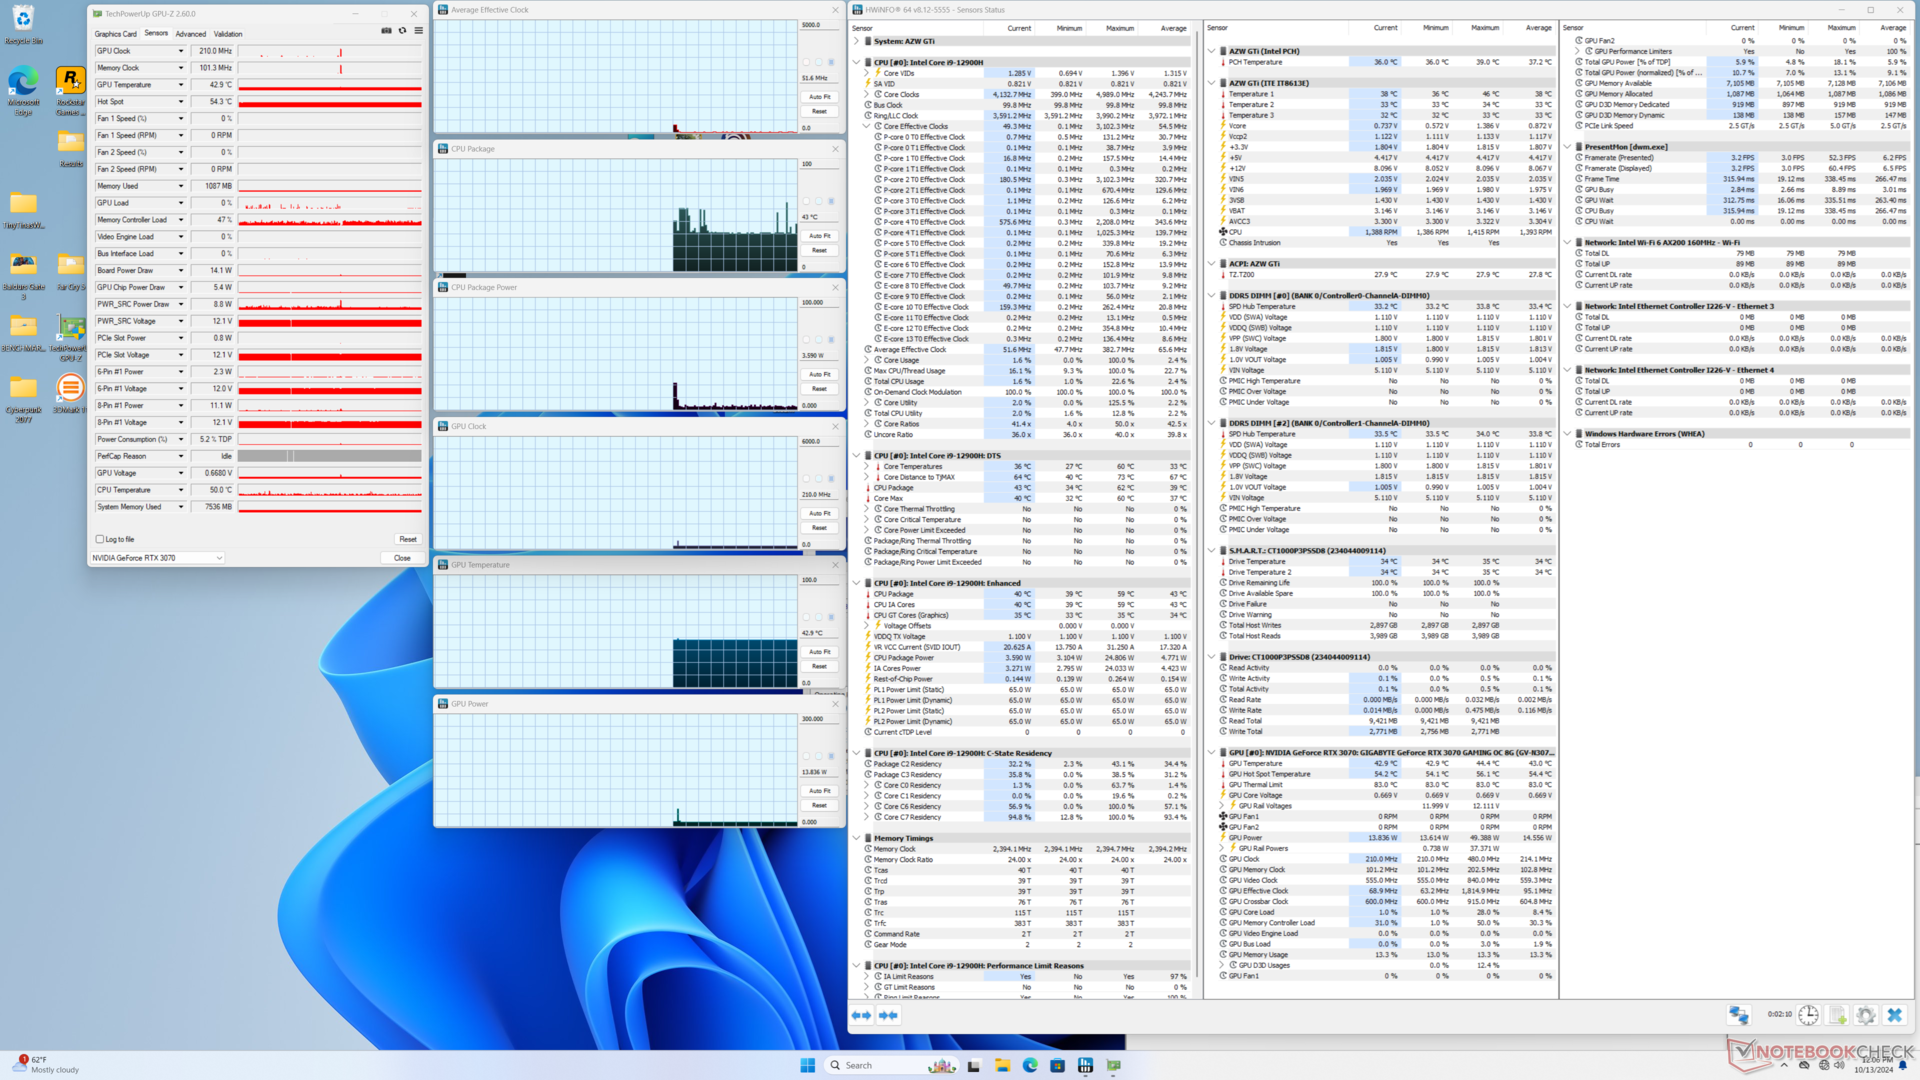
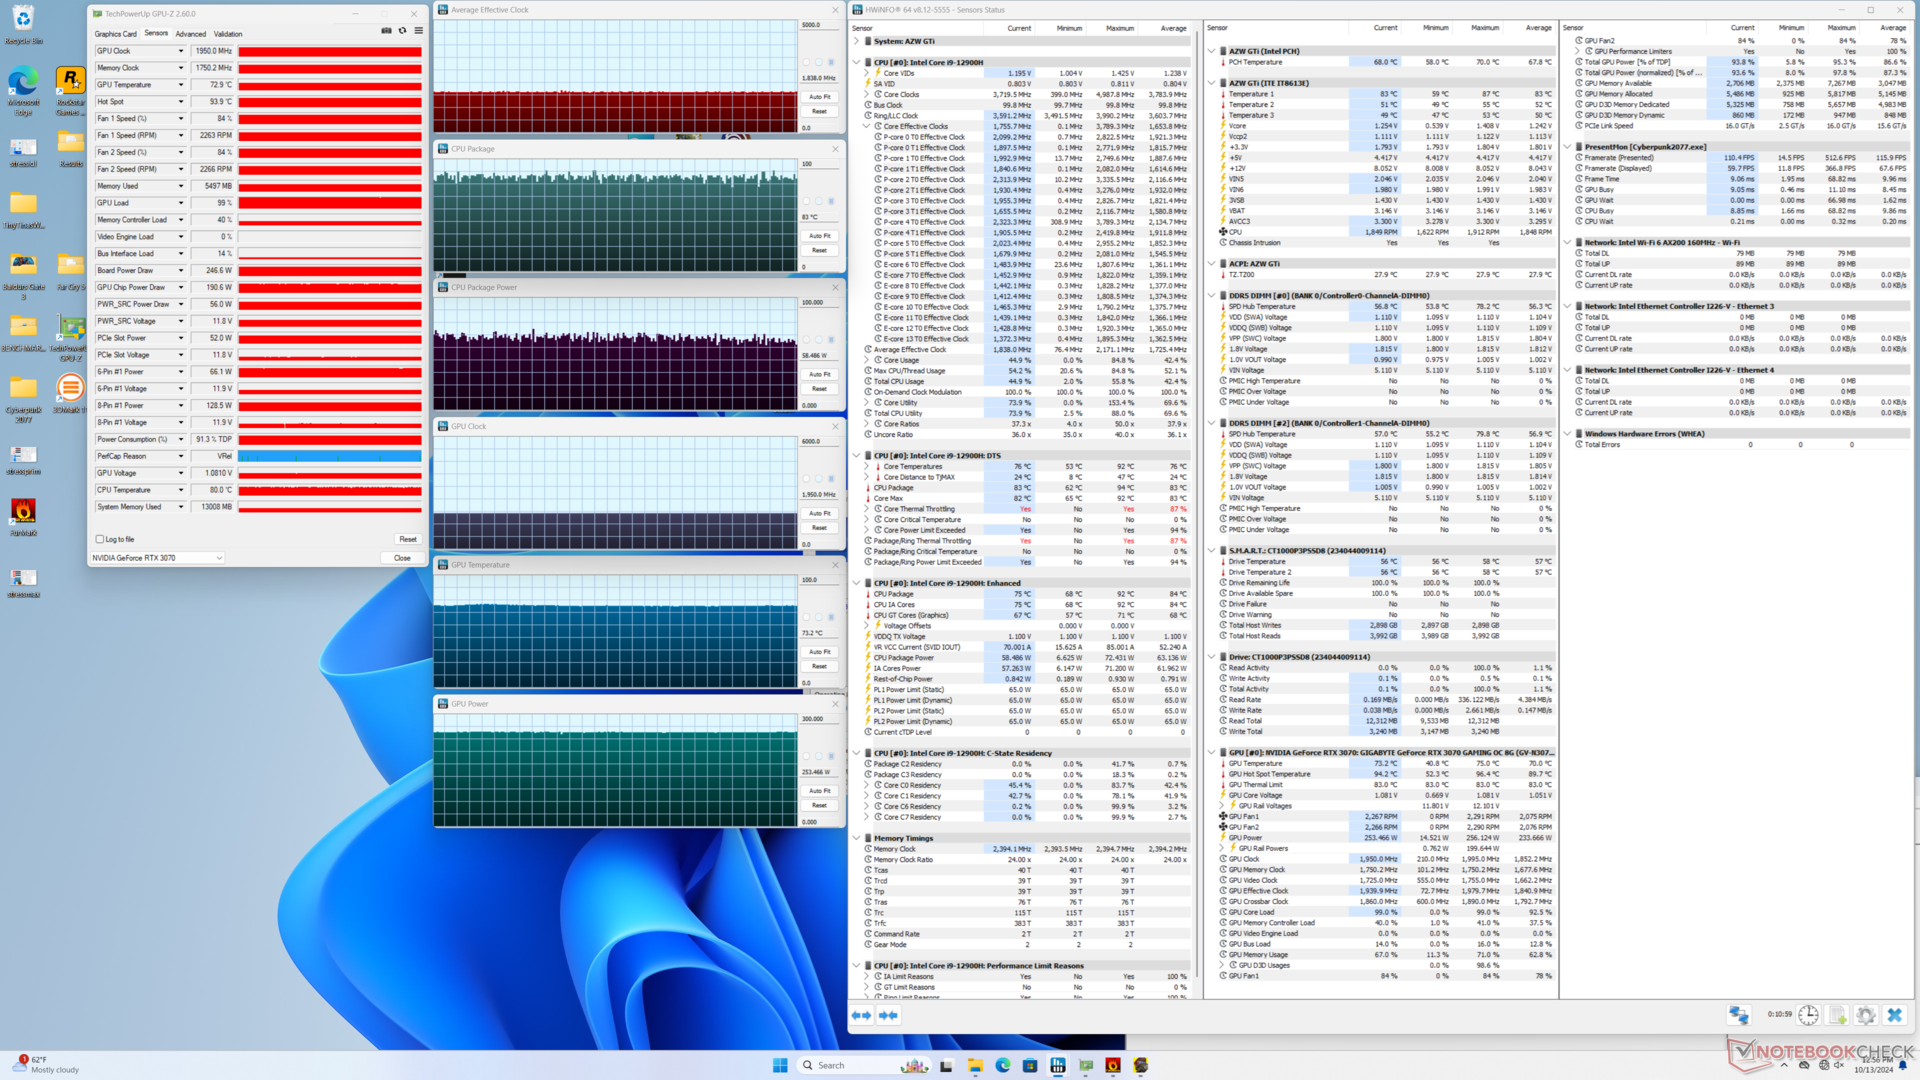
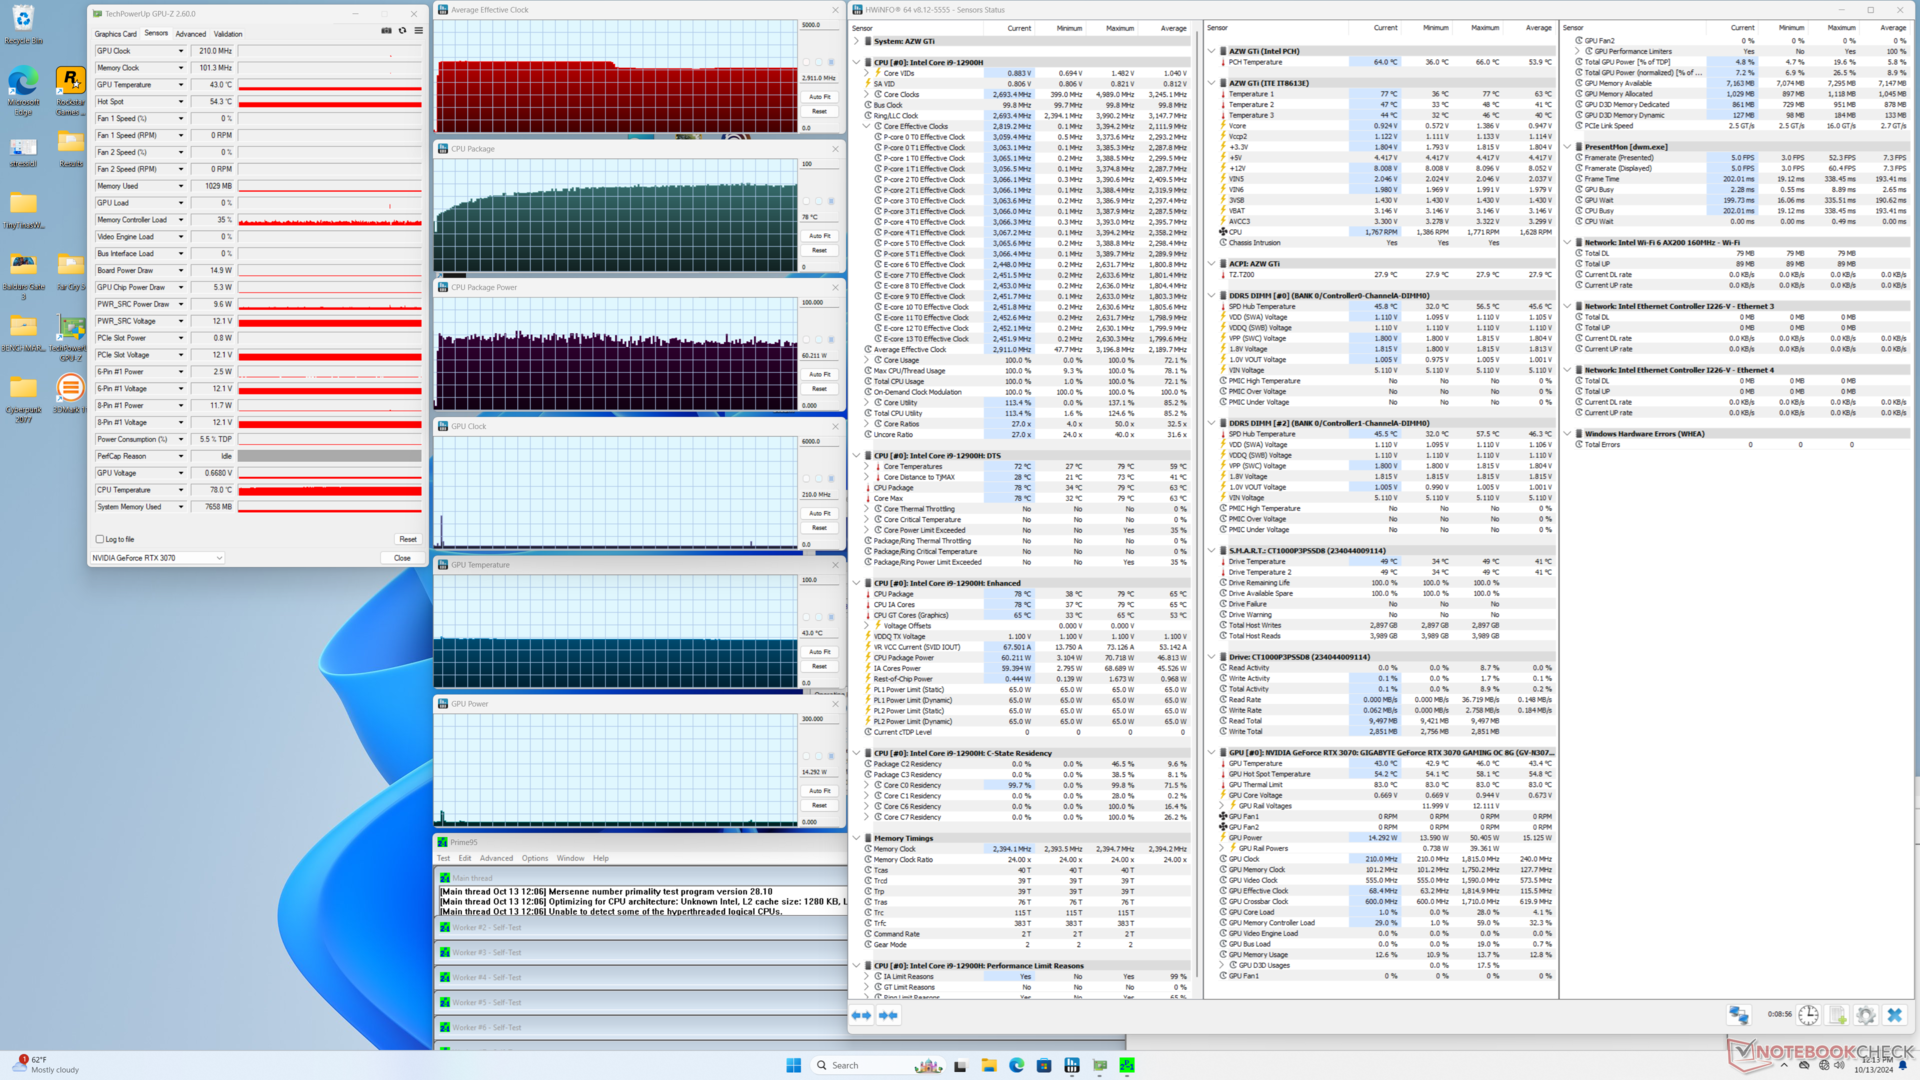
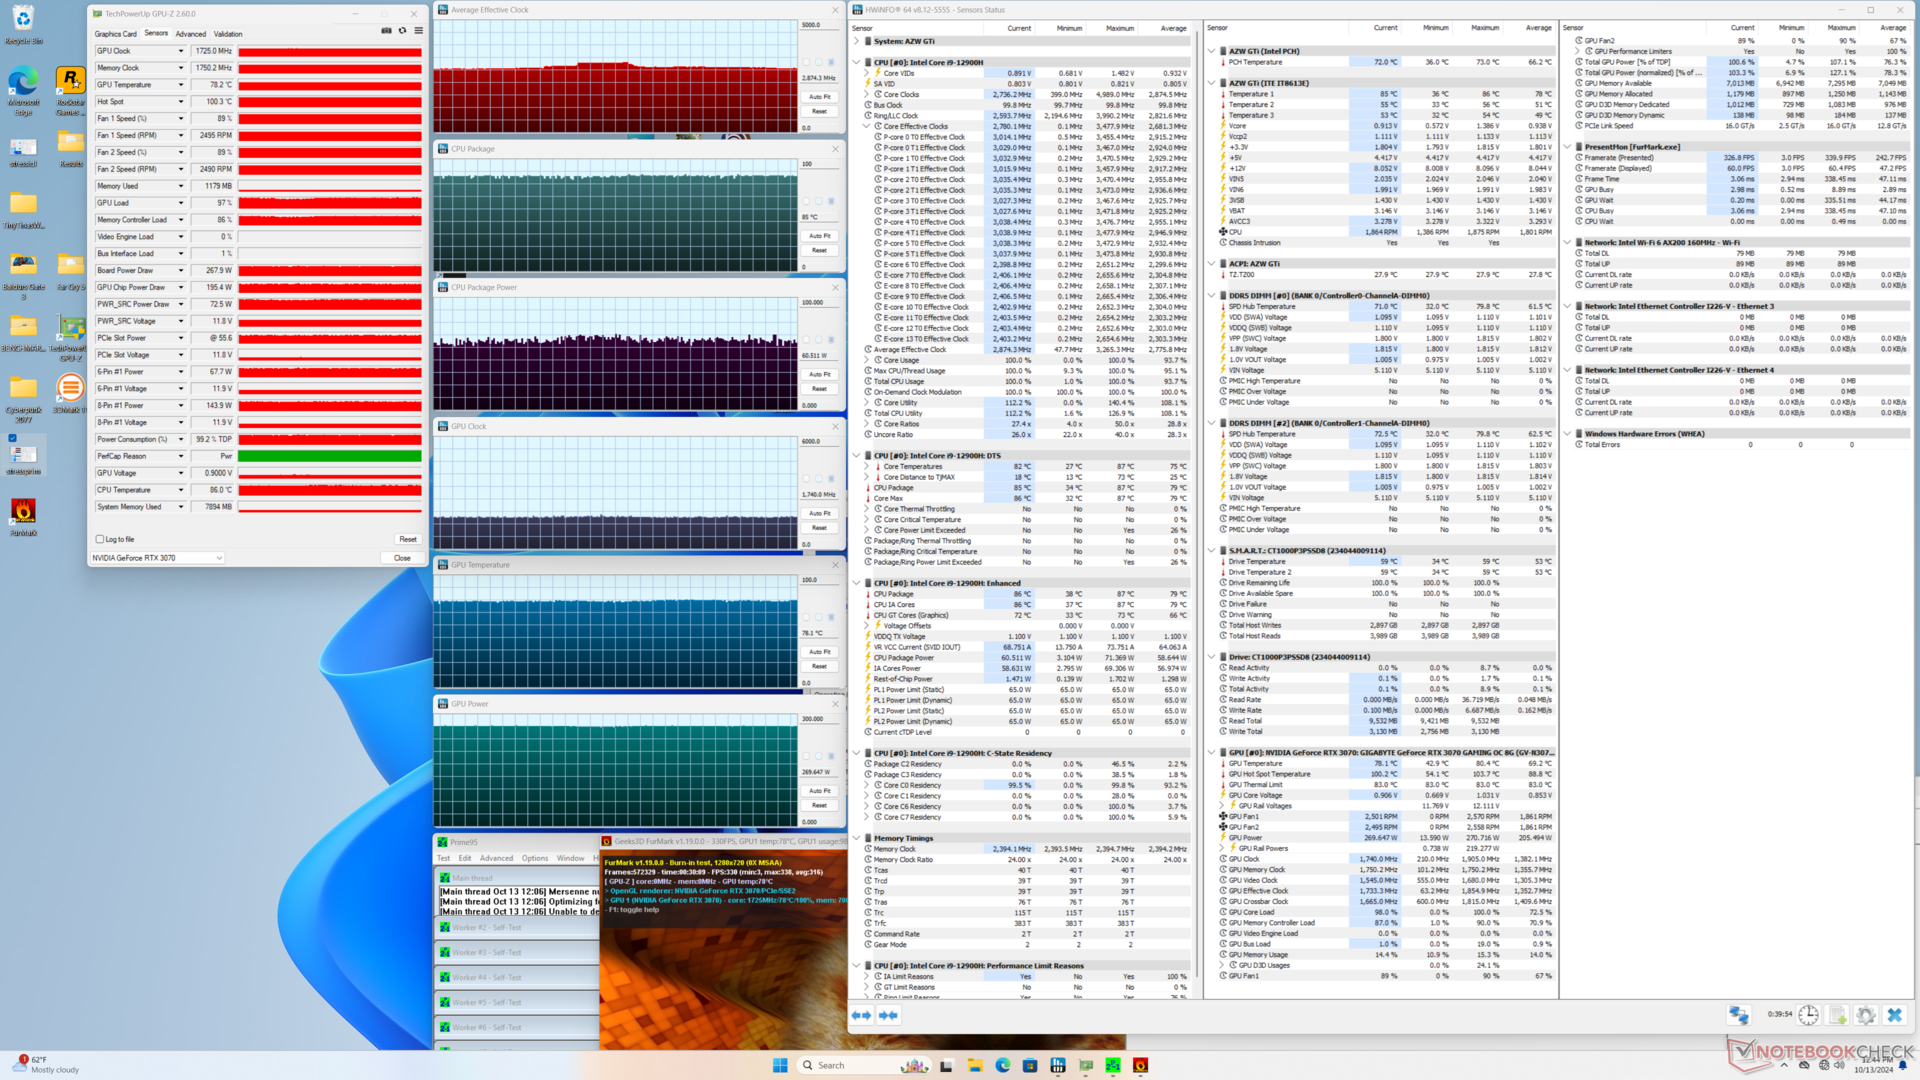
| Reloj medio de la CPU (GHz) | Reloj medio de la GPU (MHz) | Temperatura media dela CPU (°C) | Temperatura media de la GPU (°C) | |
| Sistema en reposo | -- | -- | 40 | 43 |
| Prime95 Stress | 2.9 | -- | 78 | 43 |
| Prime95 + FurMark Estrés | 2.9 | 1725 | 85 | 78 |
| Cyberpunk 2077 Estrés | 1.8 | 1950 | 83 | 73 |
Altavoces
Los altavoces internos no son muy altos ni impresionantes como los que experimentamos en el reciente Bosgame. Son más adecuados para funciones auxiliares como conferencias o salas pequeñas donde la calidad de audio importa menos. Los altavoces externos adecuados siguen siendo recomendables para cualquier tipo de reproducción multimedia.
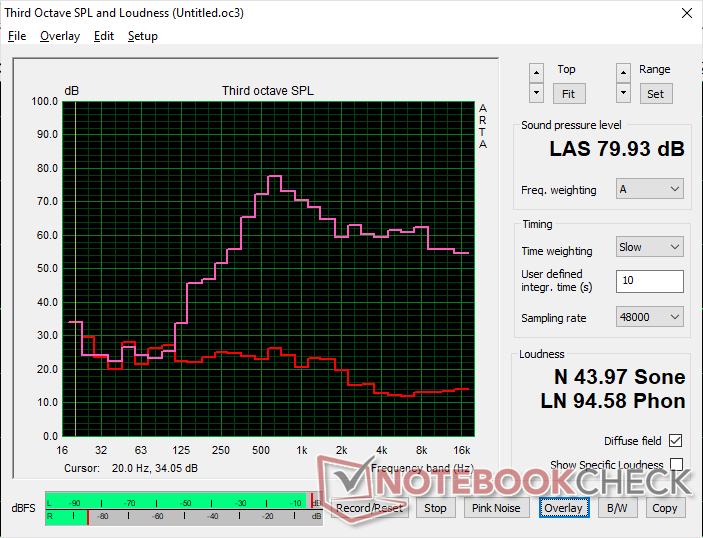
Beelink GTI12 Ultra EX Docking Station análisis de audio
(±) | la sonoridad del altavoz es media pero buena (79.9 dB)
Graves 100 - 315 Hz
(-) | casi sin bajos - de media 17.1% inferior a la mediana
(±) | la linealidad de los graves es media (14.3% delta a frecuencia anterior)
Medios 400 - 2000 Hz
(±) | medias más altas - de media 8.9% más altas que la mediana
(±) | la linealidad de los medios es media (13% delta respecto a la frecuencia anterior)
Altos 2 - 16 kHz
(+) | máximos equilibrados - a sólo 1.7% de la mediana
(+) | los máximos son lineales (6.7% delta a la frecuencia anterior)
Total 100 - 16.000 Hz
(±) | la linealidad del sonido global es media (24.2% de diferencia con la mediana)
En comparación con la misma clase
» 58% de todos los dispositivos probados de esta clase eran mejores, 11% similares, 32% peores
» El mejor tuvo un delta de 13%, la media fue 25%, el peor fue ###max##%
En comparación con todos los dispositivos probados
» 71% de todos los dispositivos probados eran mejores, 6% similares, 23% peores
» El mejor tuvo un delta de 4%, la media fue 24%, el peor fue ###max##%
Apple MacBook Pro 16 2021 M1 Pro análisis de audio
(+) | los altavoces pueden reproducir a un volumen relativamente alto (#84.7 dB)
Graves 100 - 315 Hz
(+) | buen bajo - sólo 3.8% lejos de la mediana
(+) | el bajo es lineal (5.2% delta a la frecuencia anterior)
Medios 400 - 2000 Hz
(+) | medios equilibrados - a sólo 1.3% de la mediana
(+) | los medios son lineales (2.1% delta a la frecuencia anterior)
Altos 2 - 16 kHz
(+) | máximos equilibrados - a sólo 1.9% de la mediana
(+) | los máximos son lineales (2.7% delta a la frecuencia anterior)
Total 100 - 16.000 Hz
(+) | el sonido global es lineal (4.6% de diferencia con la mediana)
En comparación con la misma clase
» 0% de todos los dispositivos probados de esta clase eran mejores, 0% similares, 100% peores
» El mejor tuvo un delta de 5%, la media fue 18%, el peor fue ###max##%
En comparación con todos los dispositivos probados
» 0% de todos los dispositivos probados eran mejores, 0% similares, 100% peores
» El mejor tuvo un delta de 4%, la media fue 24%, el peor fue ###max##%
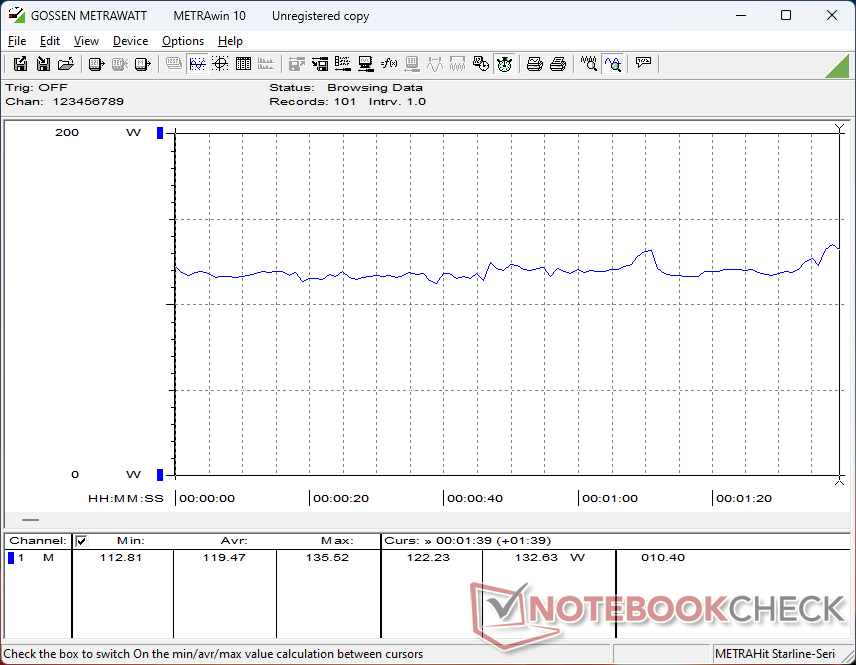
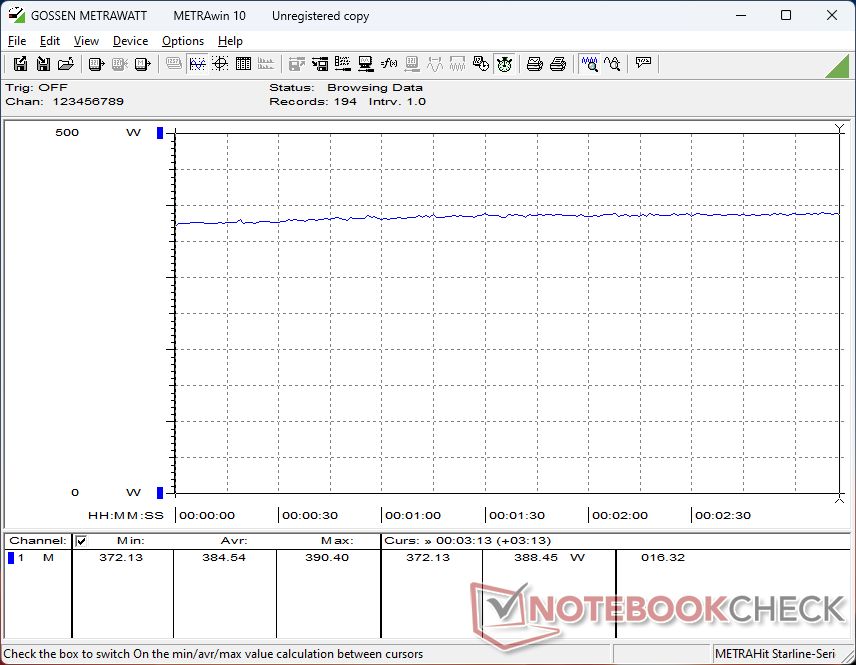
Gestión de la energía
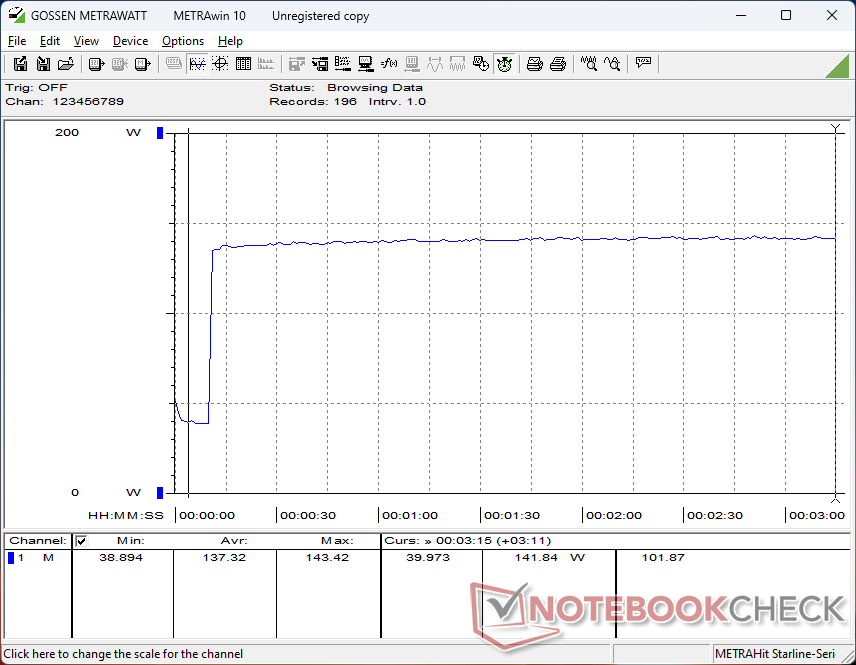
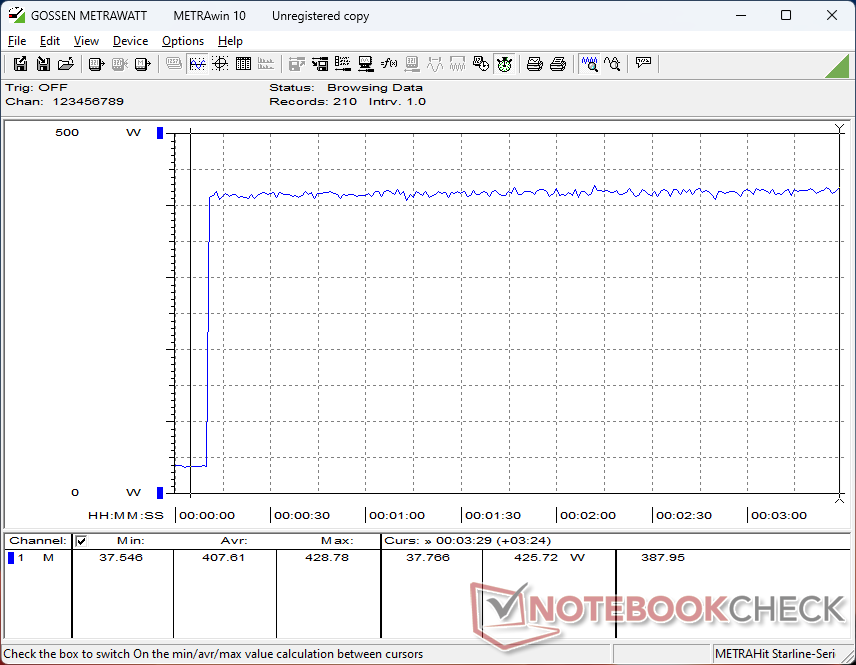
Consumo de energía
Se espera que el GTI12 Ultra y la EX Docking Station sean mucho más exigentes que otros mini PC, incluido el Asus ROG NUC 14 y su propia solución de acoplamiento RTX 4070. El ralentí en sobremesa ya consume más del doble de energía que en la mayoría de portátiles mientras que los juegos pueden demandar más de 380 W frente a los 336 W del MSI Titan 18 HX que es uno de los portátiles para juegos más rápidos actualmente disponibles.
Como ya se ha mencionado, tanto el GTI12 Ultra como el dock EX no disponen de un ladrillo de alimentación externo, a diferencia de lo que ocurre en la mayoría de los demás mini PC y portátiles.
| Off / Standby | |
| Ocioso | |
| Carga |
|
Clave:
min: | |
| Beelink GTI12 Ultra EX Docking Station i9-12900H, NVIDIA GeForce RTX 3070, Crucial P3 Plus CT1000P3PSSD8, , x, | Minisforum MS-A1 Ryzen 7 8700G, Radeon 780M, Kingston OM8PGP41024Q-A0, , x, | GMK NucBox K9 Ultra 5 125H, Arc 7-Core, MasonSemi 1TB MC7000, , x, | Asus NUC 14 Pro Ultra 5 125H, Arc 7-Core, Kingston KC3000 2048G SKC3000D2048G, , x, | Geekom AX8 Pro R9 8945HS, Radeon 780M, Acer N7000 2 TB, , x, | Asus ROG NUC 14-90AS0051 Ultra 9 185H, NVIDIA GeForce RTX 4070 Laptop GPU, Samsung PM9A1a MZVL21T0HDLU, , x, | |
|---|---|---|---|---|---|---|
| Power Consumption | 62% | 72% | 74% | 60% | 47% | |
| Idle Minimum * | 35.9 | 8.8 75% | 10.9 70% | 5.1 86% | 14 61% | 10.6 70% |
| Idle Average * | 35.9 | 12.6 65% | 11 69% | 6.4 82% | 15.9 56% | 14.8 59% |
| Idle Maximum * | 36 | 14 61% | 11.4 68% | 14.7 59% | 19.5 46% | 27.5 24% |
| Load Average * | 119.5 | 93.2 22% | 52.8 56% | 55.5 54% | 76.4 36% | 84.6 29% |
| Cyberpunk 2077 ultra external monitor * | 384 | 102.1 73% | 57.1 85% | 59.1 85% | 54.3 86% | 171.4 55% |
| Load Maximum * | 422.9 | 105.4 75% | 72.2 83% | 103.3 76% | 99.1 77% | 244 42% |
* ... más pequeño es mejor
Power Consumption Cyberpunk / Stress Test
Power Consumption external Monitor
Pro
Contra
Veredicto - Excelente calidad de construcción por el precio
El GTI12 Ultra hace honor a su nombre "Ultra" con su diseño de chasis ampliado y sus características adicionales respecto a las series Beelink GTI o SER normales. Su fuente de alimentación integrada en particular es algo que nos encantaría que se convirtiera en la norma, ya que algunas fuentes de alimentación pueden ser casi tan grandes como los propios mini PC. El diseño y la calidad del chasis también son de primera, al igual que en el SER8.
El principal inconveniente se hace obvio cuando se necesita realizar el mantenimiento de la unidad. Primero hay que desmontar los altavoces y la fuente de alimentación para acceder a las ranuras M.2 SSD y RAM, por lo que el proceso resulta más incómodo que en la mayoría de los demás mini PC. También se calienta más de lo que nos gustaría a pesar de ser notablemente más grande y pesado que otros de la categoría. El lector SD integrado, muy lento, es también una bofetada en la cara para los creadores de contenidos, sobre todo teniendo en cuenta que el modelo se comercializa como un mini PC de gama alta.
En cuanto a la base de conexión EX, se trata de un diseño robusto aunque poco elegante con sus cables de alimentación y antenas expuestos, incluso si decide no utilizar ninguna de las funciones WLAN de la base. El diseño "al aire libre" de la EX va a atraer más polvo y pelos visibles en comparación con una solución eGPU en caja como la Aorus Gaming Box donde los prefiltros suelen estar incorporados. La EX tampoco es ideal para mostrar la tarjeta gráfica, ya que la GPU debe instalarse mirando hacia el mini PC en lugar de alejarse de él.
La GTI12 Ultra y la estación de acoplamiento EX son sorprendentemente asequibles teniendo en cuenta la calidad de construcción y la competencia.
Si se eliminara la función Wi-Fi de la EX, muy poco utilizada, o se cambiara por más puertos, se podría reducir aún más el tamaño y el precio de la base.
Precio y disponibilidad
Beelink está enviando actualmente el GTI12 Ultra con 1 TB SSD, 32 GB RAM y EX Docking Station como paquete por solo 738 USD. Las opciones de CPU Meteor Lake más recientes están disponibles a partir de 200 USD más.
Beelink GTI12 Ultra EX Docking Station
- 10/21/2024 v8
Allen Ngo
 Total Sustainability Score:
 Transparencia
La selección de los dispositivos que se van a reseñar corre a cargo de nuestro equipo editorial. La muestra de prueba fue proporcionada al autor en calidad de préstamo por el fabricante o el minorista a los efectos de esta reseña. El prestamista no tuvo ninguna influencia en esta reseña, ni el fabricante recibió una copia de la misma antes de su publicación. No había ninguna obligación de publicar esta reseña. Nunca aceptamos compensaciones o pagos a cambio de nuestras reseñas. Como empresa de medios independiente, Notebookcheck no está sujeta a la autoridad de fabricantes, minoristas o editores.
Así es como prueba Notebookcheck
Cada año, Notebookcheck revisa de forma independiente cientos de portátiles y smartphones utilizando procedimientos estandarizados para asegurar que todos los resultados son comparables. Hemos desarrollado continuamente nuestros métodos de prueba durante unos 20 años y hemos establecido los estándares de la industria en el proceso. En nuestros laboratorios de pruebas, técnicos y editores experimentados utilizan equipos de medición de alta calidad. Estas pruebas implican un proceso de validación en varias fases. Nuestro complejo sistema de clasificación se basa en cientos de mediciones y puntos de referencia bien fundamentados, lo que mantiene la objetividad.Price comparison

